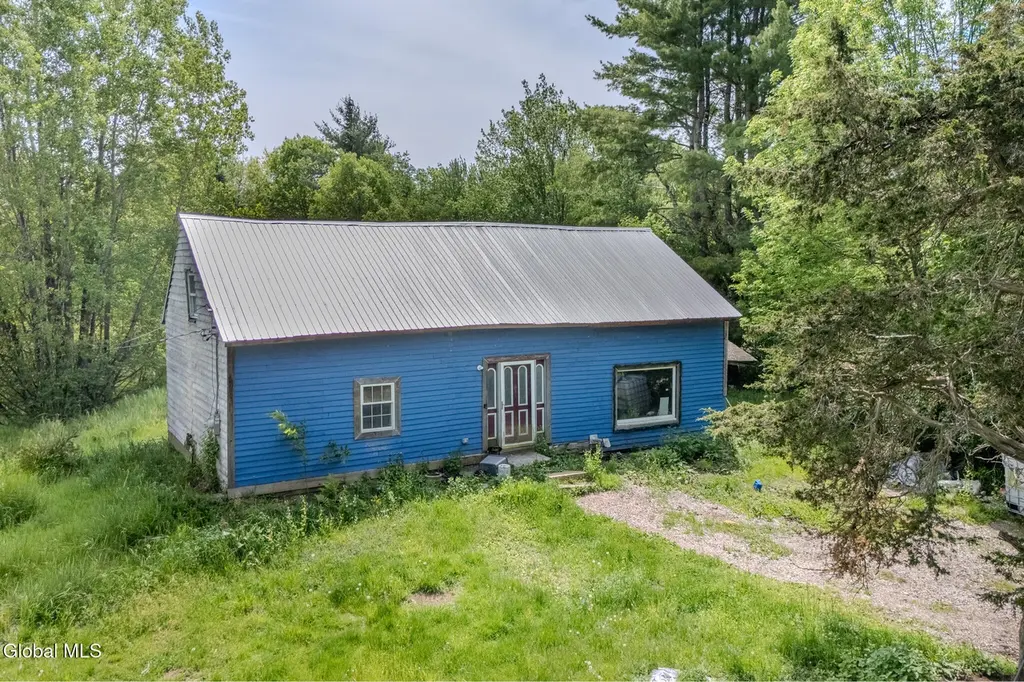
328 North Rd · Poestenkill, NY
Flood risk 1/10 · Minimal
- FEMA flood zone
- —
- Chance of flooding over 30 yrs
- 0.0%
- Est. flood insurance / yr
- —
Fire risk 4/10 · Minor
- Est. fire insurance / yr
- $691 – $1,283
Heat risk 2/10 · Minimal
- Hot days now (above 90°F)
- 7 days/yr
- Hot days in 30 yrs
- 16 days/yr
Wind risk 3/10 · Minor
- Chance of severe wind over 30 yrs
- 6.0%
Air-quality risk 2/10 · Minimal
- Unhealthy air days now
- 1 days/yr
- Unhealthy air days in 30 yrs
- 2 days/yr
Risk factors via First Street. Map © Google.
Why this score? — see what drove the A- grade
The composite is a weighted blend of 9 inputs, each scored 0–100. Each bar is that input's sub-score; the figure is the points it added to the 100-point composite (weight × sub-score).
- Cash flow +30.0/30.0
- 1% rule +10.0/10.0
- DSCR +10.0/10.0
- Appreciation +10.0/10.0
- ARV discount +7.5/15.0
- Schools +5.7/10.0
- Livability +3.2/5.0
- Rent growth +2.5/5.0
- Condition / age +2.5/5.0
$74,999
🖨 Deal sheet 📄 Offer letter ✓ Due diligence
Listing remarks
Opportunity awaits at 328 North Rd in Averill Park! Situated on a spacious country lot with peaceful surroundings, this fixer-upper is ideal for investors, flippers, or buyers looking to build sweat equity. Home offers endless potential with solid footprint, rural charm, and room to customize to your vision. Conveniently located near local lakes, outdoor recreation, schools, and an easy commute to the Capital Region. Bring your tools and imagination -- restore, renovate, or reimagine this property into something truly special. Property sold as-is. Great potential for renovation, rental income, or long-term investment in desirable Averill Park.
Key facts
- Outdoor recreation
- Solid footprint
- Rural charm
Tags
Property features AI
Exterior
- Parking: Driveway with space for 8 vehicles
- Utilities: Septic tank
- Home design: Single family residence; Property listed as fixer
- Construction: Cedar construction
- Exterior features: Metal roof; Level, wooded lot with road frontage; 1.33-acre lot
Interior
- Kitchen: Kitchen on the first floor
- Bedrooms: Four bedrooms — three on the first floor and one on the second floor; Two additional bedrooms on the second floor
- Bathrooms: Two full bathrooms — one on the first floor and one on the second floor
- Heating & cooling: Baseboard heating; Electric heating; Pellet stove
- Interior features: Partial, unfinished walk-out basement; 9 total rooms
- Laundry & utility: Laundry located in a bathroom on the main level
Neighborhood map
What this means for you Summary
Snapshot
- This is a 4-bed/1.0-bath single-family listed at $75k.
Deal economics
- At list price, monthly cash flow is $2k ($18k/yr) — positive.
- The deal already cash-flows at list — no discount required.
- Meets the 1% rule at list price ($3k rent vs $75k).
- Recommended offer: $74k (1.5% below list) — sets the bar for market timing.
- Cap rate 30.9% vs local median 2.1% in Poestenkill — top-decile yield for the area; either an underpriced asset or a hidden risk that comps aren't pricing in. Stress-test before assuming the spread holds.
Location & tenants
- Location reads 63/100 on livability (#798 in NY) — a middle-class / working-renter tenant base. Strengths: employment A+, housing A-, cost of living B+; Watch: crime D, amenities F, commute F.
- Averill Park Central School District (rural): math 58% / reading 69% proficiency, ranked #169 of 590 in NY (top 29%) — acceptable for families but not a draw, mixed tenant base, ~2y average lease; only 14% free/reduced lunch — higher-income household profile.
- Zoned schools: Averill Park High School (math 97% / reading 98%, grade A+, #49 of 1,100 statewide, top 5%, 897 students, 25% FRL).
- Zoned-school proficiency averages 97% at this address vs 64% district-wide (+34 pts) — the actual schools serving this property are materially stronger than the Averill Park Central School District average implies; a family-tenant draw the district grade alone would hide.
- Market conditions: 52 active listings in the ZIP; 405 units permitted in Rensselaer County in 2024 (224 in 5+ unit buildings).
Forward outlook
- In year one you build about $8k of equity ($518 loan paydown + $8k appreciation (10.0% local appreciation)).
- Rensselaer County population projected to shrink 6% by 2050 — rents likely to lag national; underwrite the cash flow, not the appreciation.
- At projected returns (10.0% appreciation + 3.0% rent growth), your $21k cash investment doubles in ~1 year — after that, you're playing with house money.
- By year 5, paydown + projected appreciation supports a ~$37k cash-out refi (75% LTV) — recoverable capital for the next deal without selling this one.
Negotiation context
- It's been on market 20 days — a 2% lower offer ($74k) is reasonable based on typical stale-listing flexibility.
Risks & watch-outs
- Watch-outs: property tax is 4.4% of price; built in 1870 — expect roof / HVAC / electrical / plumbing capex.
Questions for the listing agent
- Built in 1870 — when were the roof, HVAC, electrical panel, plumbing, and water heater last replaced?
- Property tax is high relative to price — has the assessment been appealed recently, and will the sale trigger a re-assessment?
- Is there a deadline driving the sale (1031 exchange, divorce, estate, relocation)? That informs how much negotiation room exists.
- Schools are B-rated — typically a magnet for longer-tenancy family renters. What's the average tenant stay here, and is there a school-zone premium baked into asking?
- Crime grade is D in this area — have there been break-ins, vandalism, or insurance claims at this property in the last 3 years? What carrier currently insures it and at what premium?
- What's the average days-on-market for RENTAL listings here right now (not sales)? A rising rental-DOM trend means longer vacancies and softer asking-rent achievability than the comps imply.
- What's the recent tenant-quality profile in this submarket — average credit score on applications, eviction rate, late-payment / NSF rate, and stable-employment percentage? A property-management company in the area should have these aggregated.
- How much new for-sale + rental construction is in the pipeline within 1–3 miles? Heavy new supply typically softens prices + rents 12–24 months out; constrained supply supports both.
Investment metrics
- 1% rule
- 3.78% ✓
- Cap rate
- 30.89%
- Cash-on-cash
- 87.83%
- DSCR
- 4.91
- GRM
- 2.2
CMA / ARV
No comps found within radius.
Projected returns pro-forma
10.0% appreciation · 3.0% rent growth · sell at horizon
- IRR
- 97.1%
- Equity multiple
- 7.61×
- Total profit
- $138,894
- Equity at exit
- $67,565
- IRR
- 92.3%
- Equity multiple
- 16.83×
- Total profit
- $332,344
- Equity at exit
- $145,707
Cash invested: $21,000 (down + closing). Projections, not guarantees.
Landlord ↔ Tenant lean methodology
- Overall (STATE)
- 15 Strongly Tenant-Friendly
- State New York
- 15 Strongly Tenant-Friendly · D+10
- County
- — inherits STATE
- City
- — inherits STATE
ZIP-level market 12018
- Home prices YoY
- 4.5%
- Active inventory
- 52
- Price-to-rent
- 2.2×
Monthly cashflow live
- Estimated rent
- $2,832 medium interval (Pro) →
- Mortgage (P&I)
- −$393
- Tax from tax record
- −$276 /mo · $3,306/yr
- Insurance
- −$31
- HOA
- −$0
- Vacancy / Maint / Mgmt
- −$595
- Net cashflow
- $1,537
Break-even live
UW: 25.0% down · 7.5% · 30yr · 1.5% tax · 5.0% vac · 8.0% maint · 8.0% mgmt
Financing live
Cash to close
- Down payment
- $18,750
- Closing costs
- $2,250
- Reserves months
- —
- Total cash needed
- —
Loan-product check · same deal, 3 products live
Conventional
25% down · 7.5% · 30yr
- Down + closing
- —
- Monthly P&I
- —
- Monthly cashflow
- —
- DSCR
- —
- Eligible?
- —
Personal DTI + credit; lowest rate.
DSCR
20% down · 8.5% · 30yr
- Down + closing
- —
- Monthly P&I
- —
- Monthly cashflow
- —
- DSCR
- —
- Eligible?
- —
No personal income docs; deal must DSCR.
Hard money
10% down · 12.0% · 12mo
- Down + closing
- —
- Monthly P&I
- —
- Monthly cashflow
- —
- DSCR
- —
- Eligible?
- —
Short-term bridge; refi at stabilization.
Listing history 15 events
-
2026-06-18days on market $74,999 Active 20 DOM
-
2026-06-17days on market $74,999 Active 19 DOM
-
2026-06-16days on market $74,999 Active 18 DOM
-
2026-06-15price $74,999 Active 17 DOM
-
2026-06-15days on market $89,999 Active 17 DOM
-
2026-06-14days on market $89,999 Active 15 DOM
-
2026-06-10days on market $89,999 Active 12 DOM
-
2026-06-09days on market $89,999 Active 11 DOM
-
2026-06-08days on market $89,999 Active 10 DOM
-
2026-06-07days on market $89,999 Active 9 DOM
-
2026-06-03days on market $89,999 Active 5 DOM
-
2026-06-02days on market $89,999 Active 4 DOM
-
2026-06-01days on market $89,999 Active 3 DOM
-
2026-05-31days on market $89,999 Active 2 DOM
-
2026-05-29$89,999 Active
ⓘ Source: listings_history table (triggers on properties + properties_extension) + one-shot
backfill from property_details.listing_events for pre-trigger history.
Tax reassessment forecast NY · Partial reset (capped growth)
- Current annual tax
- $3,306 · $276/mo
- Projected year-2 tax
- $3,306 · $276/mo
- Expected delta
- $0/yr ($0/mo · 0.0%)
ⓘ Screening estimate from a state-policy table — verify with the county assessor before closing.
Climate risk First Street
- Flood 1/10 Low 0% chance over 30 yrs
- Wildfire 4/10 Moderate
- Heat 2/10 Low 7 d/yr ≥90°F today · 16 d/yr by 30 yrs out
- Wind 3/10 Moderate 6% chance of damaging wind over 30 yrs
- Air quality 2/10 Low 1 unhealthy d/yr today · 2 by 30 yrs out
Nearby sold comps map
Loading sold comps map…
Walkable amenities ~0.75 mi
Loading nearby amenities…
Taxation est. · year 1
- Rental income
- $33,981
- − Mortgage interest
- −$4,201
- − Property taxes
- −$3,306
- − Insurance
- −$375
- − Repairs & maintenance
- −$2,718
- − Management
- −$2,718
- − Depreciation
- −$2,182
- Taxable income
- $18,480
- Est. tax owed @ 24.0%
- −$4,435
- After-tax cash flow
- $14,009/yr
For passive investors: Depreciation is non-cash, so a rental often shows a tax loss while cash-flowing — sheltering income. Rental losses are passive: they offset passive income freely, and up to $25,000/yr can offset ordinary (W-2) income if you actively participate and your MAGI is under $100k (phasing out to $0 by $150k); unused losses carry forward. On sale, claimed depreciation is recaptured at up to 25%, and gains may owe capital-gains tax (a 1031 exchange can defer both). Figures are a year-1 estimate at your 24.0% rate — not tax advice; consult a CPA.
Schools (NCES district)
- District
- Averill Park Central School District
- NCES district ID
- 3600016
- Math proficiency
- 58% ▼ -15.00%
- Reading proficiency
- 69% ▲ 2.00%
- Median HH income
- $81,340
- Composite
- 56.94/100
- National rank
- #1113
- State rank
- #169 of 590 in NY
Livability — Poestenkill
- Score
- 63/100
- State rank
- #798
- US rank
- #15428
Category grades
Schools grade is shown separately in the Schools card above.
Census & demographics
- City population
- 1,526
- Population (ZIP)
- 7,069
Population outlook (Rensselaer County) Hauer SSP2
- Today (2025)
- 162,400 people
- By 2030
- 161,746 · -0.4%
- By 2040
- 158,095 · -2.7%
- By 2050
- 152,966 · -5.8%
- By 2075
- 140,767 · -13.3%
- By 2100
- 124,727 · -23.2%
Race, ethnicity, and origin ACS 2023
- Neighborhood character
- Predominantly White (95%)
- Race & ethnicity
- White 95% Two or more races 4% Hispanic / Latino 3%
- Common ancestry
- Romanian 5% Lithuanian 4% Italian 4%
- Foreign-born
- 5% · Canada
- Languages at home
- 93% English-only · Other Indo-European 4% French/Haitian/Cajun 1% Russian/Polish/Slavic 1%
Political lean MEDSL · Rensselaer
- 2024 margin
- Toss-up / Even · D 50.7% · R 49.3%
- 2008→2024 swing
- -8.0pp toward R · 2008: 9.3pp · 2024: 1.4pp
- All cycles
- 2024: D+1.4 2020: D+5.6 2016: R+2.9 2012: D+11.8 2008: D+9.3
Not yet ingested
- Civics
- —
Market trends
- HPI YoY
- ▲ 11.43%
- Current HPI
- 263.2196
- Rent YoY
- —
- Metro
- —
- State GDP YoY
- ▲ 2.60%
- F500 in state
- 92
Industry mix (Fortune 500 HQ in NY)
| Industry | F500 HQs | Revenue |
|---|---|---|
| Financial Services | 10 | $950B |
|
||
| Consumer Goods | 9 | $162B |
|
||
| Insurance | 4 | $225B |
|
||
| Telecommunications | 2 | $144B |
|
||
| Pharmaceuticals | 2 | $112B |
|
||
| Media / Entertainment | 2 | $69B |
|
||
Price history
1 event — show timeline
- 2026-05-29 Listed $89,999 Global MLS
Property tax history
+1.5%/yrLatest (2025): $3,306 · -27.6% YoY. Source: county tax records.
Cash-flow waterfall
monthlySold comps — $/sqft
last 12 mo · ≤1 miLoading sold comps…