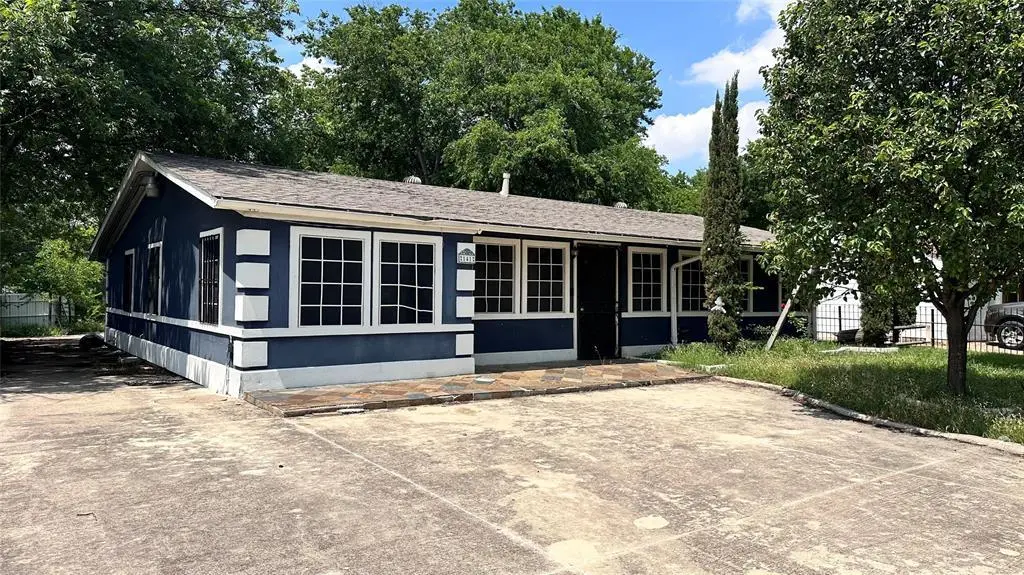
141 W Brownlee Ave · Dallas, TX
Flood risk 1/10 · Minimal
- FEMA flood zone
- X (unshaded)
- Chance of flooding over 30 yrs
- 0.0%
- Est. flood insurance / yr
- $507 – $1,088
Fire risk 1/10 · Minimal
- Est. fire insurance / yr
- $1,222 – $2,270
Heat risk 7/10 · Major
- Hot days now (above 110°F)
- 7 days/yr
- Hot days in 30 yrs
- 24 days/yr
Wind risk 6/10 · Moderate
- Chance of severe wind over 30 yrs
- 27.0%
Air-quality risk 2/10 · Minimal
- Unhealthy air days now
- 1 days/yr
- Unhealthy air days in 30 yrs
- 2 days/yr
Risk factors via First Street. Map © Google.
Why this score? — see what drove the C- grade
The composite is a weighted blend of 9 inputs, each scored 0–100. Each bar is that input's sub-score; the figure is the points it added to the 100-point composite (weight × sub-score).
- Cash flow +15.1/30.0
- ARV discount +15.0/15.0
- 1% rule +5.5/10.0
- DSCR +4.6/10.0
- Livability +4.0/5.0
- Rent growth +3.4/5.0
- Schools +2.8/10.0
- Condition / age +2.5/5.0
- Appreciation +0.0/10.0
$155,000
🖨 Deal sheet 📄 Offer letter ✓ Due diligence
Listing remarks
Multiple offers!! Highest and best due Friday, June 5th at 12 pm!! Welcome to this incredible opportunity nestled in the established Wynnewood community of South Dallas! Whether you’re a seasoned investor or a visionary homebuyer ready to put your personal touch on your forever home, this property checks every box. Step inside and discover a canvas ready for transformation. The 2 bathrooms have already been tastefully updated, giving you a head start on your renovation journey, while the rest of the home awaits your creative vision. The possibilities are truly endless. Curb appeal is already working in your favor. .. the exterior of this charming home is undeniably adorable and full o
Key facts
- Updated bathrooms
- 0.29 acre lot
- 2 garage spots
Tags
Property features AI
Finance
- Financial info: Listing accepts Cash and Conventional financing; Treat as clear loan type; No second mortgage indicated
- HOA & community: No association
Exterior
- Parking: Detached carport; Drive-through access; Driveway; Garage (2 spaces, garage faces rear); 2 carport spaces; 4 covered parking spaces
- Utilities: City water; City sewer; Not in a municipal utility district
- Home design: Single-family residence; One story; Residential property
- Construction: Stucco exterior; Composition roof; Slab foundation; Built in 1946
- Exterior features: Covered porch(es); RV/boat parking; Few trees; Interior lot; Landscaped yard; Large grassy backyard
Interior
- Kitchen: Eat-in kitchen; Disposal
- Bedrooms: 4 bedrooms (all on main level); Primary bedroom on main level with ensuite bath, separate shower, dual sinks and walk-in closet
- Flooring: Laminate flooring; Tile flooring
- Bathrooms: 2 full bathrooms
- Interior features: Eat-in kitchen; Walk-in closets; One living area; One dining area; 8 total rooms
Neighborhood map
What this means for you Summary
Snapshot
- This is a 2-bed/1.0-bath single-family listed at $155k.
Deal economics
- At list price, monthly cash flow is $50 ($603/yr) — positive.
- The deal already cash-flows at list — no discount required.
- Meets the 1% rule at list price ($2k rent vs $155k).
- Cap rate 6.7% vs local median 2.3% in Dallas — top-decile yield for the area; either an underpriced asset or a hidden risk that comps aren't pricing in. Stress-test before assuming the spread holds.
Location & tenants
- Location reads 81/100 on livability (#24 in TX, #1,380 nationally) — a professional / high-income tenant draw. Strengths: amenities A+, commute A+, housing A+; Watch: crime F.
- Dallas ISD (urban): math 31% / reading 36% proficiency, ranked #559 of 826 in TX (top 68%) — families likely to look elsewhere, expect single-tenant / working-renter base with shorter leases; 83% free/reduced lunch — lower-income household profile, screen leases tightly.
- Zoned schools: Clinton P Russell El (math 25% / reading 23%, grade F, #3,221 of 4,322 statewide, top 75%, 558 students, 93% FRL).
- Market conditions: Rents rising (+3.7%/yr); 58 active listings in the ZIP; 30 comparable units currently listed for rent nearby; rentals at typical pace (median 24d on market — plan ~3-4 weeks tenant-placement turnaround); 12,577 units permitted in Dallas County in 2024 (6,829 in 5+ unit buildings).
- This rent runs 38% of the median local income ($52k/yr) — at the standard rent-burdened threshold; future hikes will face affordability resistance.
Forward outlook
- Local home prices are declining (-3.0%/yr); year-one equity from $1k of loan paydown is wiped out by about $5k of value loss. Plan a longer hold.
- Dallas County population projected at +35% by 2050 — long-run rental-demand tailwind backs the buy-and-hold thesis.
Negotiation context
- Only 11 days on market — expect competitive offers; lowballing is unlikely to land.
Risks & watch-outs
- Watch-outs: property tax is 2.8% of price; built in 1946 — expect roof / HVAC / electrical / plumbing capex.
- Climate carrying-cost: major wind risk, 27% chance of damaging wind over 30y; extreme-heat days projected 7→24/yr by 2055 (HVAC capex compounding) — expect insurance premiums to compound above CPI over the hold.
Questions for the listing agent
- Built in 1946 — when were the roof, HVAC, electrical panel, plumbing, and water heater last replaced?
- Property tax is high relative to price — has the assessment been appealed recently, and will the sale trigger a re-assessment?
- Is there a deadline driving the sale (1031 exchange, divorce, estate, relocation)? That informs how much negotiation room exists.
- Crime grade is F in this area — have there been break-ins, vandalism, or insurance claims at this property in the last 3 years? What carrier currently insures it and at what premium?
- What's the average days-on-market for RENTAL listings here right now (not sales)? A rising rental-DOM trend means longer vacancies and softer asking-rent achievability than the comps imply.
- What's the recent tenant-quality profile in this submarket — average credit score on applications, eviction rate, late-payment / NSF rate, and stable-employment percentage? A property-management company in the area should have these aggregated.
- How much new for-sale + rental construction is in the pipeline within 1–3 miles? Heavy new supply typically softens prices + rents 12–24 months out; constrained supply supports both.
Investment metrics
- 1% rule
- 1.05% ✓
- Cap rate
- 6.68%
- Cash-on-cash
- 1.39%
- DSCR
- 1.06
- GRM
- 7.9
CMA / ARV
- ARV (on-the-fly)
- $191,835
- Comps found
- 12
Show comp detail 12 sales within ~0.75 mi
| Address | Dist | Beds/Ba | Sqft | Sold | Price | $/sf | Match |
|---|---|---|---|---|---|---|---|
| 139 W Grover C Washington Ave | 0.44mi | 2/1.0 | 1,028 (+1%) | 7mo | $150,000 | $146 | 71 |
| 3122 Seevers Ave | 0.37mi | 3/2.0 (+1) | 980 (-3%) | 1mo | $245,000 | $250 | 67 |
| 3042 O Bannon Dr | 0.64mi | 3/2.0 (+1) | 1,016 (+0%) | 0mo | $258,000 | $254 | 60 |
| 102 Mitscher Dr | 0.10mi | 3/2.0 (+1) | 910 (-10%) | 11mo | $249,000 | $274 | 60 |
| 3107 Alabama Ave | 0.41mi | 3/1.0 (+1) | 916 (-10%) | 3mo | $155,000 | $169 | 57 |
| 3018 S Marsalis Ave | 0.63mi | 3/1.0 (+1) | 1,002 (-1%) | 10mo | $130,000 | $130 | 55 |
| 407 Bradley St | 0.23mi | 3/3.0 (+1) | 1,135 (+12%) | 5mo | $269,000 | $237 | 52 |
| 2420 Seevers Ave | 0.52mi | 3/2.0 (+1) | 1,118 (+10%) | 1mo | $240,000 | $215 | 49 |
| 2601 Ramsey Ave | 0.43mi | 2/1.0 | 864 (-15%) | 9mo | $115,000 | $133 | 48 |
| 3309 Alaska Ave | 0.70mi | 2/1.0 | 927 (-9%) | 10mo | $139,900 | $151 | 44 |
| 3139 Michigan Ave | 0.56mi | 3/1.0 (+1) | 1,140 (+12%) | 8mo | $89,900 | $79 | 41 |
| 2503 S Marsalis Ave | 0.72mi | 3/2.0 (+1) | 1,140 (+12%) | 11mo | $215,000 | $189 | 28 |
Match score weights: distance 35% · size 25% · config 20% · recency 20%. Top-matched comps best support the ARV.
Projected returns pro-forma
-3.0% appreciation · 3.71% rent growth · sell at horizon
- IRR
- -13.1%
- Equity multiple
- 0.53×
- Total profit
- $-20,615
- Equity at exit
- $23,111
- IRR
- -2.8%
- Equity multiple
- 0.81×
- Total profit
- $-8,428
- Equity at exit
- $13,402
Cash invested: $43,400 (down + closing). Projections, not guarantees.
Landlord ↔ Tenant lean methodology
- Overall (STATE)
- 87 Strongly Landlord-Friendly
- State Texas
- 87 Strongly Landlord-Friendly · R+5
- County
- — inherits STATE
- City
- — inherits STATE
ZIP-level market 75224
- Rents YoY
- 3.7%
- Active inventory
- 58
- Price-to-rent
- 7.9×
Monthly cashflow live
- Estimated rent
- $1,631 high interval (Pro) →
- Mortgage (P&I)
- −$813
- Tax from tax record
- −$361 /mo · $4,327/yr
- Insurance
- −$65
- HOA
- −$0
- Vacancy / Maint / Mgmt
- −$342
- Net cashflow
- $50
Break-even live
UW: 25.0% down · 7.5% · 30yr · 1.5% tax · 5.0% vac · 8.0% maint · 8.0% mgmt
Financing live
Cash to close
- Down payment
- $38,750
- Closing costs
- $4,650
- Reserves months
- —
- Total cash needed
- —
Loan-product check · same deal, 3 products live
Conventional
25% down · 7.5% · 30yr
- Down + closing
- —
- Monthly P&I
- —
- Monthly cashflow
- —
- DSCR
- —
- Eligible?
- —
Personal DTI + credit; lowest rate.
DSCR
20% down · 8.5% · 30yr
- Down + closing
- —
- Monthly P&I
- —
- Monthly cashflow
- —
- DSCR
- —
- Eligible?
- —
No personal income docs; deal must DSCR.
Hard money
10% down · 12.0% · 12mo
- Down + closing
- —
- Monthly P&I
- —
- Monthly cashflow
- —
- DSCR
- —
- Eligible?
- —
Short-term bridge; refi at stabilization.
Rent comps 30 comps
| Address | Beds | Baths | Sqft | Rent | $/sqft | DOM | Units | Dist |
|---|---|---|---|---|---|---|---|---|
| 2819 Alabama Ave Dallas, TX | 3.0 | 2.0 | 1218 | $1,925 | $1.58 | 43d | 1 | 0.33mi |
| 2634 Seevers Ave Dallas, TX | 3.0 | 2.0 | 1000 | $1,800 | $1.80 | 24d | 1 | 0.38mi |
| 3212 S Llewellyn Ave Dallas, TX | 2.0 | 2.0 | 1040 | $1,750 | $1.68 | 43d | 1 | 0.53mi |
| 2826 Alaska Ave Dallas, TX | 3.0 | 2.0 | 1190 | $1,795 | $1.51 | 24d | 1 | 0.55mi |
| 2454 S Zang Blvd Dallas, TX | 1.0–2.0 | 1.0 | 750 | $1,400 | $1.87 | 3d | 14 | 0.55mi |
| 620 Lacewood Dr Dallas, TX | 3.0 | 1.0 | 1218 | $1,750 | $1.44 | 2d | 1 | 0.59mi |
| 2311 Anzio Dr Dallas, TX | 2.0 | 1.0 | 814 | $1,350 | $1.66 | 2d | 22 | 0.69mi |
| 3702 Conway St Dallas, TX | 2.0–3.0 | 1.5–2.0 | 1033 | $1,445 | $1.40 | 1d | 5 | 0.78mi |
| 3311 S Vernon Ave Dallas, TX | 1.0–2.0 | 1.0–1.5 | 929 | $1,325 | $1.43 | 1d | 15 | 0.82mi |
| 2406 S Marsalis Ave Dallas, TX | 2.0 | 1.0 | 956 | $1,700 | $1.78 | 43d | 1 | 0.83mi |
| 2423 Maryland Ave Dallas, TX | 2.0 | 2.0 | 1102 | $2,350 | $2.13 | 43d | 1 | 0.84mi |
| 3607 Fawn Valley Dr Dallas, TX | 1.0–2.0 | 1.0 | 644 | $1,165 | $1.81 | 15d | 1 | 0.92mi |
| 3504 Fawn Valley Dr Dallas, TX | 1.0–3.0 | 1.0–2.0 | 790 | $1,188 | $1.50 | 15d | 1 | 0.95mi |
| 3608 S Marsalis Ave Dallas, TX | 2.0 | 1.0 | 907 | $1,400 | $1.54 | 43d | 1 | 0.96mi |
| 3288 S Polk St Dallas, TX | 1.0–3.0 | 1.0 | 861 | $1,085 | $1.26 | 43d | 1 | 0.97mi |
| 3523 Fawn Valley Dr Dallas, TX | 1.0–2.0 | 1.0–1.5 | 796 | $1,200 | $1.51 | 15d | 1 | 0.99mi |
| 3828 Morning Springs Trl Dallas, TX | 3.0 | 2.0 | 1399 | $2,200 | $1.57 | 21d | 1 | 1.03mi |
| 1805 S Zang Blvd Dallas, TX | 1.0–3.0 | 1.0–2.0 | 940 | $1,471 | $1.56 | 7d | 1 | 1.10mi |
| 1715 Ramsey Ave Dallas, TX | 2.0 | 1.0 | 1092 | $1,750 | $1.60 | 24d | 1 | 1.14mi |
| 519 Heyser Dr Dallas, TX | 2.0 | 2.0 | 1300 | $2,300 | $1.77 | 24d | 1 | 1.18mi |
| 3423 E Perryton Dr Dallas, TX | 2.0 | 2.0 | 1277 | $1,650 | $1.29 | 43d | 1 | 1.21mi |
| 625 W Pentagon Parkway Cir Dallas, TX | 3.0 | 2.0 | 1371 | $2,150 | $1.57 | 7d | 1 | 1.22mi |
| 3633 Legendary Ln Dallas, TX | 1.0 | 1.0 | 780 | $974 | $1.25 | 43d | 1 | 1.27mi |
| 4117 S Marsalis Ave Dallas, TX | 3.0 | 2.0 | 1296 | $2,200 | $1.70 | 7d | 1 | 1.29mi |
| 3702 Legendary Ln Dallas, TX | 1.0–3.0 | 1.0–2.0 | 990 | $1,024 | $1.03 | 3d | 6 | 1.31mi |
| 1607 McAdams Ave Dallas, TX | 3.0 | 1.0 | 984 | $1,695 | $1.72 | 7d | 1 | 1.31mi |
| 1334 Marfa Ave Dallas, TX | 3.0 | 2.0 | 1100 | $1,475 | $1.34 | 43d | 1 | 1.35mi |
| 1415 Mountain Lake Rd Dallas, TX | 3.0 | 2.0 | 1190 | $2,200 | $1.85 | 43d | 1 | 1.39mi |
| 1124 Brunner Ave Unit 1018235P Dallas, TX | 2.0 | 2.0 | 1140 | $2,972 | $2.61 | 2d | 1 | 1.44mi |
| 1618 Marfa Ave Dallas, TX | 3.0 | 2.0 | 1100 | $1,900 | $1.73 | 43d | 1 | 1.49mi |
Listing history 8 events
-
2026-06-09days on market $155,000 Active 11 DOM
-
2026-06-08days on market $155,000 Active 10 DOM
-
2026-06-07days on market $155,000 Active 9 DOM
-
2026-06-04days on market $155,000 Active 6 DOM
-
2026-06-03days on market $155,000 Active 5 DOM
-
2026-06-02days on market $155,000 Active 4 DOM
-
2026-06-01days on market $155,000 Active 3 DOM
-
2026-05-31days on market $155,000 Active 2 DOM
ⓘ Source: listings_history table (triggers on properties + properties_extension) + one-shot
backfill from property_details.listing_events for pre-trigger history.
Tax reassessment forecast TX · Resets to sale price
- Current annual tax
- $4,327 · $361/mo
- Projected year-2 tax
- $4,327 · $361/mo
- Expected delta
- $0/yr ($0/mo · 0.0%)
ⓘ Screening estimate from a state-policy table — verify with the county assessor before closing.
Climate risk First Street
- Flood 1/10 Low FEMA zone X (unshaded) · 0% chance over 30 yrs
- Wildfire 1/10 Low
- Heat 7/10 Severe 7 d/yr ≥110°F today · 24 d/yr by 30 yrs out
- Wind 6/10 Major 27% chance of damaging wind over 30 yrs
- Air quality 2/10 Low 1 unhealthy d/yr today · 2 by 30 yrs out
Nearby sold comps map
Loading sold comps map…
Walkable amenities ~0.75 mi
Loading nearby amenities…
Taxation est. · year 1
- Rental income
- $19,569
- − Mortgage interest
- −$8,682
- − Property taxes
- −$4,327
- − Insurance
- −$775
- − Repairs & maintenance
- −$1,565
- − Management
- −$1,565
- − Depreciation
- −$4,509
- Taxable loss
- −$1,856
- Est. tax savings @ 24.0%
- +$445
- After-tax cash flow
- $1,049/yr
For passive investors: Depreciation is non-cash, so a rental often shows a tax loss while cash-flowing — sheltering income. Rental losses are passive: they offset passive income freely, and up to $25,000/yr can offset ordinary (W-2) income if you actively participate and your MAGI is under $100k (phasing out to $0 by $150k); unused losses carry forward. On sale, claimed depreciation is recaptured at up to 25%, and gains may owe capital-gains tax (a 1031 exchange can defer both). Figures are a year-1 estimate at your 24.0% rate — not tax advice; consult a CPA.
Schools (NCES district)
- District
- Dallas ISD
- NCES district ID
- 4816230
- Math proficiency
- 31% ▼ -16.00%
- Reading proficiency
- 36% ▼ -4.00%
- Median HH income
- $42,881
- Composite
- 28.41/100
- National rank
- #6763
- State rank
- #559 of 826 in TX
Livability — Dallas
- Score
- 81/100
- State rank
- #24
- US rank
- #1380
Category grades
Schools grade is shown separately in the Schools card above.
Census & demographics
- Census place
- Dallas, TX
- County
- Dallas County · 2,612,404 people
- City population
- 1,168,437
- Metro
- Dallas-Fort Worth-Arlington, TX
- Population (ZIP)
- 35,105
- Household income
- $51,919
- Rent vs Own
- Severe rent burden
- 1594.0
Population outlook (Dallas County) Hauer SSP2
- Today (2025)
- 2,979,839 people
- By 2030
- 3,191,823 · +7.1%
- By 2040
- 3,619,611 · +21.5%
- By 2050
- 4,026,915 · +35.1%
- By 2075
- 4,957,073 · +66.4%
- By 2100
- 5,508,725 · +84.9%
Race, ethnicity, and origin ACS 2023
- Neighborhood character
- Diverse neighborhood (Simpson 0.56)
- Race & ethnicity
- Hispanic / Latino 59% Black 29% Two or more races 19% White 9% Native American 1%
- Hispanic origin (detail)
- Mexican 53%
- Common ancestry
- Serbian 1% Slovak 1% Italian 1%
- Foreign-born
- 25% · Canada
- Languages at home
- 47% English-only · Spanish 51% Other Indo-European 1%
Political lean MEDSL · Dallas
- 2024 margin
- Strong D (+22.2) · D 60.2% · R 38.0% · Other 1.8%
- 2008→2024 swing
- +6.9pp toward D · 2008: 15.3pp · 2024: 22.2pp
- All cycles
- 2024: D+22.2 2020: D+31.6 2016: D+26.2 2012: D+15.4 2008: D+15.3
Not yet ingested
- Civics
- —
Market trends
- HPI YoY
- ▼ -285.86%
- Current HPI
- 328.3162
- Rent YoY
- ▲ 3.71%
- Metro
- Dallas-Fort Worth-Arlington, TX
- State GDP YoY
- ▲ 3.95%
- F500 in state
- 110
Industry mix (Fortune 500 HQ in TX)
| Industry | F500 HQs | Revenue |
|---|---|---|
| Energy | 16 | $1,198B |
|
||
| Technology | 5 | $198B |
|
||
| Engineering / Construction | 4 | $72B |
|
||
| Energy Services | 3 | $60B |
|
||
| Utilities | 3 | $41B |
|
||
| Healthcare | 2 | $330B |
|
||
Price history
3 events — show timeline
- 2026-05-29 Listed $155,000 NTREIS
- 2016-11-21 Sold (Public Records) — Public Records
- 1994-10-22 Sold (Public Records) — Public Records
Property tax history
+7.8%/yrLatest (2025): $4,327 · -0.4% YoY. Source: county tax records.
Cash-flow waterfall
monthlySold comps — $/sqft
last 12 mo · ≤1 miLoading sold comps…