2037 38th St SE #102 · Washington, DC
Flood risk 4/10 · Minor
- FEMA flood zone
- X (unshaded)
- Chance of flooding over 30 yrs
- 0.13%
- Est. flood insurance / yr
- $507 – $1,088
Fire risk 1/10 · Minimal
- Est. fire insurance / yr
- $631 – $1,173
Heat risk 7/10 · Major
- Hot days now (above 104°F)
- 7 days/yr
- Hot days in 30 yrs
- 16 days/yr
Wind risk 4/10 · Minor
- Chance of severe wind over 30 yrs
- 21.0%
Air-quality risk 4/10 · Minor
- Unhealthy air days now
- 4 days/yr
- Unhealthy air days in 30 yrs
- 5 days/yr
Risk factors via First Street. Map © Google.
Why this score? — see what drove the B grade
The composite is a weighted blend of 9 inputs, each scored 0–100. Each bar is that input's sub-score; the figure is the points it added to the 100-point composite (weight × sub-score).
- Cash flow +30.0/30.0
- 1% rule +10.0/10.0
- DSCR +10.0/10.0
- ARV discount +7.5/15.0
- Livability +3.7/5.0
- Schools +3.6/10.0
- Rent growth +3.5/5.0
- Condition / age +2.5/5.0
- Appreciation +0.0/10.0
$90,000
🖨 Deal sheet 📄 Offer letter ✓ Due diligence
Listing remarks MLS
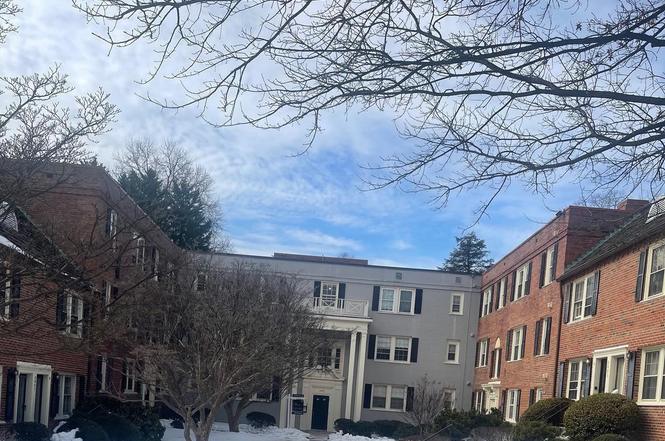
This condo is located in Hillcrest minutes to Capitol Hill and Downtown i
Key facts
- Efficient layout
- Conveniently located
- $339 HOA
Tags
Property features AI
Finance
- Other: Condominium ownership interest; Finished living area reported by assessor
- HOA & community: Monthly condo fee of $410; Condo fee covers common area maintenance, exterior building maintenance, sewer, snow removal, trash, and water; Community amenities include common grounds
Exterior
- Parking: On-street parking
- Utilities: Public water; Public sewer; Electric service for heating, cooling, and hot water
- Home design: Condominium unit in a garden-style building (1–4 floors); One story/unit entry level is 1; Unit/flat layout; Building name: Hillcrest; Pets allowed (cats and dogs)
- Construction: Brick construction; Above-grade and below-grade structures noted; Property in good condition
- Exterior features: Located in city limits; No tidal water
Interior
- Kitchen: Disposal; Refrigerator; Stove
- Bedrooms: One bedroom on the main/entry level
- Flooring: Carpet; Tile/brick
- Bathrooms: One full bathroom
- Heating & cooling: Forced air heating (electric); Central air conditioning (electric); Electric hot water
- Interior features: Traditional floor plan; Galley kitchen; Formal separate dining room; Entry-level bedroom; Tub/shower
- Laundry & utility: Washer/dryer hookup in unit
Neighborhood map
What this means for you Summary
Snapshot
- This is a 1-bed/1.0-bath condo listed at $90k.
Deal economics
- At list price, monthly cash flow is $399 ($5k/yr) — positive.
- The deal already cash-flows at list — no discount required.
- Meets the 1% rule at list price ($2k rent vs $90k).
- Recommended offer: $79k (12.0% below list) — sets the bar for market timing.
- Cap rate 11.6% vs local median 2.5% in Washington — top-decile yield for the area; either an underpriced asset or a hidden risk that comps aren't pricing in. Stress-test before assuming the spread holds.
Location & tenants
- Location reads 73/100 on livability (#1 in DC) — a middle-class / working-renter tenant base. Strengths: amenities A+, commute A+, employment A+; Watch: crime F, cost of living F.
- District Of Columbia Public Schools (urban): math 33% / reading 40% proficiency, ranked #8 of 32 in DC (top 25%) — families likely to look elsewhere, expect single-tenant / working-renter base with shorter leases; 65% free/reduced lunch — lower-income household profile, screen leases tightly.
- Market conditions: Rents rising (+3.9%/yr); 296 active listings in the ZIP; 40 comparable units currently listed for rent nearby; rentals at typical pace (median 21d on market — plan ~3-4 weeks tenant-placement turnaround); 1,737 units permitted in District of Columbia in 2024 (1,506 in 5+ unit buildings).
- This rent runs 38% of the median local income ($54k/yr) — at the standard rent-burdened threshold; future hikes will face affordability resistance.
Forward outlook
- Local home prices are declining (-3.0%/yr); year-one equity from $622 of loan paydown is wiped out by about $3k of value loss. Plan a longer hold.
- District of Columbia County population projected at +50% by 2050 — long-run rental-demand tailwind backs the buy-and-hold thesis.
- At projected returns (-3.0% appreciation + 3.9% rent growth), your $25k cash investment doubles in ~6 years — after that, you're playing with house money.
Negotiation context
- It's been on market 128 days — a 12% lower offer ($79k) is reasonable based on typical stale-listing flexibility.
- 8 sale attempts since 14y ago with the ask held roughly flat each time — persistent listings suggest the price (not the market) is what's stuck; bring a comps-based counter.
- Current owner paid $40k; list at $90k implies a 125% gain — meaningful room to come down on a strong offer.
Risks & watch-outs
- Watch-outs: built in 1940 — expect roof / HVAC / electrical / plumbing capex.
- Climate carrying-cost: extreme-heat days projected 7→16/yr by 2055 (HVAC capex compounding) — expect insurance premiums to compound above CPI over the hold.
Questions for the listing agent
- It's been on market 128 days. Have you received any prior offers? Is the seller open to a 12% concession, seller financing, or rate buy-down credit?
- Built in 1940 — when were the roof, HVAC, electrical panel, plumbing, and water heater last replaced?
- What does the HOA fee cover, when was the last increase, and are there any pending special assessments or reserve-fund shortfalls?
- Any open or pending special assessments — roof, HVAC, plumbing, elevator, façade? What's the per-unit balance and payoff schedule, and is the seller paying it off at close or rolling it to the buyer?
- Why hasn't it sold? Are there any deal-killer items the seller is aware of (foundation, flood, title, zoning, code violations)?
- Is there a deadline driving the sale (1031 exchange, divorce, estate, relocation)? That informs how much negotiation room exists.
- Crime grade is F in this area — have there been break-ins, vandalism, or insurance claims at this property in the last 3 years? What carrier currently insures it and at what premium?
- What's the average days-on-market for RENTAL listings here right now (not sales)? A rising rental-DOM trend means longer vacancies and softer asking-rent achievability than the comps imply.
- What's the recent tenant-quality profile in this submarket — average credit score on applications, eviction rate, late-payment / NSF rate, and stable-employment percentage? A property-management company in the area should have these aggregated.
- How much new apartment / multifamily construction is in the pipeline within 1–3 miles? Heavy new supply (>2% of stock underway) typically softens rents 12–24 months out; light construction supports rent growth.
Investment metrics
- 1% rule
- 1.89% ✓
- Cap rate
- 11.61%
- Cash-on-cash
- 18.99%
- DSCR
- 1.85
- GRM
- 4.4
CMA / ARV
No comps found within radius.
Projected returns pro-forma
-3.0% appreciation · 3.86% rent growth · sell at horizon
- IRR
- 12.3%
- Equity multiple
- 1.50×
- Total profit
- $12,523
- Equity at exit
- $13,419
- IRR
- 22.2%
- Equity multiple
- 3.01×
- Total profit
- $50,702
- Equity at exit
- $7,782
Cash invested: $25,200 (down + closing). Projections, not guarantees.
Landlord ↔ Tenant lean methodology
- Overall (CITY)
- 0 Strongly Tenant-Friendly
- State District of Columbia
- 12 Strongly Tenant-Friendly · D+43
- County
- — inherits STATE
- City Washington
- 0 Strongly Tenant-Friendly · D+43
ZIP-level market 20020
- Rents YoY
- 3.9%
- Active inventory
- 296
- Price-to-rent
- 4.4×
Monthly cashflow live
- Estimated rent
- $1,697 high interval (Pro) →
- Mortgage (P&I)
- −$472
- Tax from tax record
- −$93 /mo · $1,120/yr
- Insurance
- −$38
- HOA
- −$339
- Vacancy / Maint / Mgmt
- −$356
- Net cashflow
- $399
Break-even live
UW: 25.0% down · 7.5% · 30yr · 1.5% tax · 5.0% vac · 8.0% maint · 8.0% mgmt
Financing live
Cash to close
- Down payment
- $22,500
- Closing costs
- $2,700
- Reserves months
- —
- Total cash needed
- —
Loan-product check · same deal, 3 products live
Conventional
25% down · 7.5% · 30yr
- Down + closing
- —
- Monthly P&I
- —
- Monthly cashflow
- —
- DSCR
- —
- Eligible?
- —
Personal DTI + credit; lowest rate.
DSCR
20% down · 8.5% · 30yr
- Down + closing
- —
- Monthly P&I
- —
- Monthly cashflow
- —
- DSCR
- —
- Eligible?
- —
No personal income docs; deal must DSCR.
Hard money
10% down · 12.0% · 12mo
- Down + closing
- —
- Monthly P&I
- —
- Monthly cashflow
- —
- DSCR
- —
- Eligible?
- —
Short-term bridge; refi at stabilization.
Rent comps 40 comps
| Address | Beds | Baths | Sqft | Rent | $/sqft | DOM | Units | Dist |
|---|---|---|---|---|---|---|---|---|
| 2017 37th St SE #301 Washington, DC | 2.0 | 1.0 | 644 | $1,895 | $2.94 | 24d | 1 | 0.06mi |
| 2057 38th St SE #301 Washington, DC | 2.0 | 1.0 | 625 | $1,700 | $2.72 | 19d | 1 | 0.06mi |
| 3811 V St SE Washington, DC | 2.0 | 1.0 | 629 | $1,595 | $2.54 | 2d | 1 | 0.09mi |
| 3808 W St SE #101 Washington, DC | 2.0 | 1.0 | 623 | $2,200 | $3.53 | 24d | 1 | 0.09mi |
| 3812 W St SE #101 Washington, DC | 2.0 | 1.0 | 629 | $1,800 | $2.86 | 24d | 1 | 0.11mi |
| 2107 Fort Davis St SE #301 Washington, DC | 2.0 | 1.0 | 620 | $1,700 | $2.74 | 19d | 1 | 0.11mi |
| 2001 Fort Davis St SE #202 Washington, DC | 2.0 | 1.0 | 614 | $1,650 | $2.69 | 24d | 1 | 0.15mi |
| 2115 Suitland Ter SE Washington, DC | 2.0 | 1.0 | 637 | $1,695 | $2.66 | 24d | 1 | 0.22mi |
| 3923 Pennsylvania Ave SE #301 Washington, DC | 2.0 | 1.0 | 652 | $1,850 | $2.84 | 24d | 1 | 0.22mi |
| 2114 Suitland Ter SE Washington, DC | 2.0 | 1.0 | 650 | $1,800 | $2.77 | 24d | 1 | 0.23mi |
| 3956 Pennsylvania Ave SE #203 Washington, DC | 2.0 | 1.0 | 636 | $1,600 | $2.52 | 7d | 1 | 0.23mi |
| 3935 S St SE #304 Washington, DC | 2.0 | 1.0 | 735 | $2,500 | $3.40 | 24d | 1 | 0.26mi |
| 3901 Suitland Rd Suitland, MD | 1.0–2.0 | 1.0 | 816 | $1,335 | $1.64 | 3d | 10 | 0.32mi |
| 3930 Suitland Rd Suitland, MD | 1.0–2.0 | 1.0 | 772 | $1,240 | $1.61 | 2d | 29 | 0.37mi |
| 4113 Southern Ave SE Capitol Heights, MD | 3.0 | 1.0–1.5 | 816 | $1,559 | $1.91 | 1d | 45 | 0.50mi |
| 3101 Pennsylvania Ave SE Washington, DC | 1.0 | 1.0 | 665 | $1,195 | $1.80 | 3d | 1 | 0.67mi |
| 1721 29th St SE Unit 1 Washington, DC | 1.0 | 1.0 | 725 | $1,395 | $1.92 | 20d | 1 | 0.78mi |
| 4110 Suitland Rd Suitland, MD | 1.0–3.0 | 1.0–2.0 | 955 | $1,248 | $1.31 | 2d | 15 | 0.81mi |
| 2219 Town Center Dr SE Washington, DC | 1.0 | 1.0 | 668 | $2,045 | $3.06 | 5d | 5 | 0.82mi |
| 3001 Branch Ave Temple Hills, MD | 2.0 | 1.0 | 769 | $1,678 | $2.18 | 1d | 43 | 0.83mi |
| 2801 R St SE Unit 2 Washington, DC | 2.0 | 1.0 | 700 | $1,569 | $2.24 | 24d | 1 | 0.87mi |
| 2562 Naylor Rd SE Washington, DC | 1.0–2.0 | 1.0 | 790 | $1,535 | $1.94 | 3d | 21 | 0.88mi |
| 1527 28th St SE Washington, DC | 1.0 | 1.0 | 700 | $1,150 | $1.64 | 24d | 1 | 0.95mi |
| 3101 Naylor Rd SE Washington, DC | 1.0 | 1.0 | 764 | $1,325 | $1.73 | 24d | 2 | 0.97mi |
| 2847 Gainesville St SE Unit B2 Washington, DC | 2.0 | 1.0 | 710 | $1,700 | $2.39 | 24d | 1 | 0.97mi |
| 2607 Naylor Rd SE Washington, DC | 1.0 | 1.0 | 665 | $1,275 | $1.92 | 7d | 4 | 0.97mi |
| 2515 R St SE Washington, DC | 1.0–2.0 | 1.0 | 812 | $1,585 | $1.95 | 5d | 2 | 0.98mi |
| 3105 Naylor Rd SE Washington, DC | 1.0 | 1.0 | 750 | $1,350 | $1.80 | 12d | 1 | 0.98mi |
| 1560 27th St SE Washington, DC | 1.0 | 1.0 | 660 | $1,100 | $1.67 | 24d | 1 | 0.98mi |
| 3105 Naylor Rd SE #104 Washington, DC | 1.0 | 1.0 | 715 | $1,350 | $1.89 | 24d | 1 | 0.98mi |
| 3107 Naylor Rd SE #301 Washington, DC | 1.0 | 1.0 | 700 | $1,250 | $1.79 | 24d | 1 | 0.98mi |
| 3109 Naylor Rd SE Washington, DC | 2.0 | 1.0 | 655 | $1,904 | $2.91 | 7d | 1 | 0.98mi |
| 1550 27th St SE Washington, DC | 2.0 | 1.0 | 660 | $1,250 | $1.89 | 4d | 1 | 0.98mi |
| 1550 27th St SE Washington, DC | 1.0 | 1.0 | 550 | $1,100 | $2.00 | 24d | 1 | 0.98mi |
| 2439 25th St SE Washington, DC | 1.0 | 1.0 | 679 | $1,293 | $1.90 | 16d | 1 | 1.01mi |
| 4348 Southern Ave SE Washington, DC | 2.0 | 1.0 | 650 | $2,300 | $3.54 | 24d | 1 | 1.02mi |
| 4348 Southern Ave SE Unit Radiance Washington, DC | 2.0 | 1.0 | 550 | $2,200 | $4.00 | 19d | 1 | 1.02mi |
| 1501 27th St SE #406 Washington, DC | 1.0 | 1.0 | 598 | $1,350 | $2.26 | 14d | 1 | 1.04mi |
| 2419 Naylor Rd SE Washington, DC | — | 1.0 | 580 | $1,250 | $2.16 | 24d | 1 | 1.06mi |
| 2843 Minnesota Ave SE Unit 1 Washington, DC | 1.0 | 1.0 | 631 | $1,285 | $2.04 | 24d | 1 | 1.07mi |
HOA detail condo
- Monthly dues
- $339 · $4,068/yr
- Assessments
- None detected in remarks — confirm with the listing agent.
Listing history 33 events
-
2026-06-18days on market $90,000 Active 128 DOM
-
2026-06-17days on market $90,000 Active 127 DOM
-
2026-06-16days on market $90,000 Active 126 DOM
-
2026-06-15days on market $90,000 Active 125 DOM
-
2026-06-13days on market $90,000 Active 123 DOM
-
2026-06-09days on market $90,000 Active 119 DOM
-
2026-06-08days on market $90,000 Active 118 DOM
-
2026-06-07days on market $90,000 Active 117 DOM
-
2026-06-04days on market $90,000 Active 114 DOM
-
2026-06-03days on market $90,000 Active 113 DOM
-
2026-06-02days on market $90,000 Active 112 DOM
-
2026-06-01days on market $90,000 Active 111 DOM
-
2026-05-31days on market $90,000 Active 110 DOM
-
2026-03-19status Active
-
2026-03-18historical Active Under Contract
-
2026-02-09$90,000 Active
-
2013-09-04soldstatus $40,000
-
2013-08-30soldstatus $40,000 Sold 74-char remark
Show marketing remark (74 chars)
This condo is located in Hillcrest minutes to Capitol Hill and Downtown i
-
2013-08-30soldstatus $40,000 74-char remark
Show marketing remark (74 chars)
This condo is located in Hillcrest minutes to Capitol Hill and Downtown i
-
2013-07-18status Contract 74-char remark
Show marketing remark (74 chars)
This condo is located in Hillcrest minutes to Capitol Hill and Downtown i
-
2013-07-18historical 74-char remark
Show marketing remark (74 chars)
This condo is located in Hillcrest minutes to Capitol Hill and Downtown i
-
2013-07-09status Active 74-char remark
Show marketing remark (74 chars)
This condo is located in Hillcrest minutes to Capitol Hill and Downtown i
-
2013-06-23historical Expired 74-char remark
Show marketing remark (74 chars)
This condo is located in Hillcrest minutes to Capitol Hill and Downtown i
-
2013-05-29price $62,000 Active 74-char remark
Show marketing remark (74 chars)
This condo is located in Hillcrest minutes to Capitol Hill and Downtown i
-
2013-05-29status Active 74-char remark
Show marketing remark (74 chars)
This condo is located in Hillcrest minutes to Capitol Hill and Downtown i
-
2013-05-11status Contract 74-char remark
Show marketing remark (74 chars)
This condo is located in Hillcrest minutes to Capitol Hill and Downtown i
-
2013-01-29$74,900 Active 74-char remark
Show marketing remark (74 chars)
This condo is located in Hillcrest minutes to Capitol Hill and Downtown i
-
2013-01-29$62,000 74-char remark
Show marketing remark (74 chars)
This condo is located in Hillcrest minutes to Capitol Hill and Downtown i
-
2013-01-15historical Withdrawn
-
2013-01-14historical
-
2012-12-05Active
-
2012-12-04$75,000
-
1991-02-13soldstatus $50,000
ⓘ Source: listings_history table (triggers on properties + properties_extension) + one-shot
backfill from property_details.listing_events for pre-trigger history.
Tax reassessment forecast DC · Partial reset (capped growth)
- Current annual tax
- $1,120 · $93/mo
- Projected year-2 tax
- $1,120 · $93/mo
- Expected delta
- $0/yr ($0/mo · 0.0%)
ⓘ Screening estimate from a state-policy table — verify with the county assessor before closing.
Climate risk First Street
- Flood 4/10 Moderate FEMA zone X (unshaded) · 13% chance over 30 yrs
- Wildfire 1/10 Low
- Heat 7/10 Severe 7 d/yr ≥104°F today · 16 d/yr by 30 yrs out
- Wind 4/10 Moderate 21% chance of damaging wind over 30 yrs
- Air quality 4/10 Moderate 4 unhealthy d/yr today · 5 by 30 yrs out
Nearby sold comps map
Loading sold comps map…
Walkable amenities ~0.75 mi
Loading nearby amenities…
Taxation est. · year 1
- Rental income
- $20,365
- − Mortgage interest
- −$5,041
- − Property taxes
- −$1,120
- − Insurance
- −$450
- − Repairs & maintenance
- −$1,629
- − Management
- −$1,629
- − HOA
- −$4,068
- − Depreciation
- −$2,618
- Taxable income
- $3,809
- Est. tax owed @ 24.0%
- −$914
- After-tax cash flow
- $3,872/yr
For passive investors: Depreciation is non-cash, so a rental often shows a tax loss while cash-flowing — sheltering income. Rental losses are passive: they offset passive income freely, and up to $25,000/yr can offset ordinary (W-2) income if you actively participate and your MAGI is under $100k (phasing out to $0 by $150k); unused losses carry forward. On sale, claimed depreciation is recaptured at up to 25%, and gains may owe capital-gains tax (a 1031 exchange can defer both). Figures are a year-1 estimate at your 24.0% rate — not tax advice; consult a CPA.
Schools (NCES district)
- District
- District Of Columbia Public Schools
- NCES district ID
- 1100030
- Math proficiency
- 33% ▲ 3.00%
- Reading proficiency
- 40% ▲ 5.00%
- Median HH income
- $67,671
- Composite
- 35.84/100
- National rank
- #9606
- State rank
- #8 of 32 in DC
Livability — Washington
- Score
- 73/100
- State rank
- #1
- US rank
- #5327
Category grades
Schools grade is shown separately in the Schools card above.
Census & demographics
- Census place
- Washington, DC
- County
- District of Columbia · 671,873 people
- City population
- 671,873
- Metro
- Washington-Arlington-Alexandria, DC-VA-MD-WV
- Population (ZIP)
- 53,005
- Household income
- $54,032
- Rent vs Own
- Severe rent burden
- 5148.0
Population outlook (District of Columbia County) Hauer SSP2
- Today (2025)
- 821,926 people
- By 2030
- 899,517 · +9.4%
- By 2040
- 1,061,162 · +29.1%
- By 2050
- 1,231,493 · +49.8%
- By 2075
- 1,603,312 · +95.1%
- By 2100
- 1,847,141 · +124.7%
Race, ethnicity, and origin ACS 2023
- Neighborhood character
- Predominantly Black (90%)
- Race & ethnicity
- Black 90% Two or more races 3% Hispanic / Latino 3% White 3%
- Common ancestry
- Lithuanian 1%
- Foreign-born
- 3% · Canada
- Languages at home
- 95% English-only · Spanish 2% French/Haitian/Cajun 1%
Political lean MEDSL · District of Columbia
- 2024 margin
- Solid D (+86.1) · D 91.2% · R 5.1% · Other 3.8%
- 2008→2024 swing
- +0.1pp no change · 2008: 85.9pp · 2024: 86.1pp
- All cycles
- 2024: D+86.1 2020: D+86.8 2016: D+88.7 2012: D+84.2 2008: D+85.9
Not yet ingested
- Civics
- —
Market trends
- HPI YoY
- ▼ -415.44%
- Current HPI
- 306.5068
- Rent YoY
- ▲ 3.86%
- Metro
- Washington-Arlington-Alexandria, DC-VA-MD-WV
- State GDP YoY
- ▲ 1.33%
- F500 in state
- 6
Industry mix (Fortune 500 HQ in DC)
| Industry | F500 HQs | Revenue |
|---|---|---|
| Financial Services | 1 | $153B |
|
||
| Life Sciences / Industrials | 1 | $25B |
|
||
| Industrial Machinery | 1 | $8B |
|
||
Price history
+80.0% since first listed20 events — show timeline
- 2026-03-19 Relisted — BRIGHT MLS
- 2026-03-18 Contingent — BRIGHT MLS
- 2026-02-09 Listed $90,000 BRIGHT MLS
- 2013-09-04 Sold (Public Records) $40,000 Public Records
- 2013-08-30 Sold (MLS) $40,000 BRIGHT MLS
- 2013-08-30 Sold (MLS) $40,000 MRIS
- 2013-07-18 Pending — MRIS
- 2013-07-18 Listing Removed — BRIGHT MLS
- 2013-07-09 Relisted — MRIS
- 2013-06-23 Delisted — MRIS
- 2013-05-29 Relisted — MRIS
- 2013-05-29 Price Changed $62,000 MRIS
- 2013-05-11 Pending — MRIS
- 2013-01-29 Listed $74,900 MRIS
- 2013-01-29 Listed $62,000 BRIGHT MLS
- 2013-01-15 Delisted — MRIS
- 2013-01-14 Listing Removed — BRIGHT MLS
- 2012-12-05 Listed — MRIS
- 2012-12-04 Listed $75,000 BRIGHT MLS
- 1991-02-13 Sold (Public Records) $50,000 Public Records
Property tax history
+11.4%/yrLatest (2025): $1,120 · +3.2% YoY. Source: county tax records.
Cash-flow waterfall
monthlySold comps — $/sqft
last 12 mo · ≤1 miLoading sold comps…