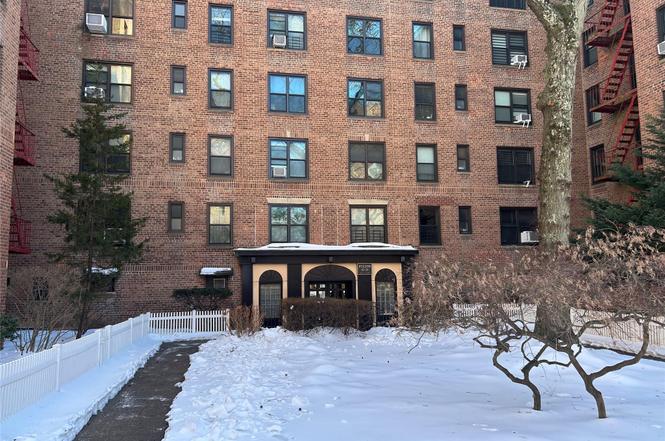
83-20 98 St Unit 5J · New York, NY
Flood risk No data
- FEMA flood zone
- —
- Chance of flooding over 30 yrs
- —
- Est. flood insurance / yr
- —
Fire risk No data
- Est. fire insurance / yr
- —
Heat risk No data
- Hot days now (above threshold)
- —
- Hot days in 30 yrs
- —
Wind risk No data
- Chance of severe wind over 30 yrs
- —
Air-quality risk No data
- Unhealthy air days now
- —
- Unhealthy air days in 30 yrs
- —
Risk factors via First Street. Map © Google.
Why this score? — see what drove the B- grade
The composite is a weighted blend of 9 inputs, each scored 0–100. Each bar is that input's sub-score; the figure is the points it added to the 100-point composite (weight × sub-score).
- Cash flow +28.3/30.0
- DSCR +10.0/10.0
- 1% rule +7.8/10.0
- ARV discount +7.5/15.0
- Schools +5.0/10.0
- Livability +3.8/5.0
- Rent growth +2.5/5.0
- Condition / age +2.5/5.0
- Appreciation +0.0/10.0
$199,000
🖨 Deal sheet 📄 Offer letter ✓ Due diligence
Listing remarks
Great Development In Queens , Surrounded On Three Sides By Forest Park. O Low Maintenance Includes All Utilities O Close To Golf, Tennis, Running Track, Cross Country Trails, Bicycle Trails O Near To Train, Buses, Schools . O 100% Owner Occupied WALL TO WALL CARPETING WITH PADDING IS MANDATORY! or sound proofing floor, Additional information:Features:Lr/Dr
Key facts
- Tennis
- Close to golf
- Running track
Tags
Property features AI
Exterior
- Parking: Has garage with 80 garage spaces; No carport; Parking features: Waitlist
- Utilities: Public sewer; Cable available; Electricity connected; Natural gas connected; Sewer connected; Public trash collection
- Home design: Stock cooperative; One-level unit; Entry level: 5
- Construction: Brick construction
- Exterior features: Brick construction; Not waterfront
Interior
- Kitchen: Gas oven; Refrigerator; Stainless steel appliances
- Bedrooms: Bedroom on the first floor
- Bathrooms: 1 full bathroom
- Heating & cooling: Gravity heating; Hot water heating; Wall/window air conditioning units
- Interior features: First-floor bedroom; First-floor full bathroom; Entrance foyer; No basement; Four total rooms; Six-story building
- Laundry & utility: Pets allowed: Cats OK
Neighborhood map
What this means for you Summary
Snapshot
- This is a 1-bed/1.0-bath condo listed at $199k.
Deal economics
- At list price, monthly cash flow is $637 ($8k/yr) — positive.
- The deal already cash-flows at list — no discount required.
- Meets the 1% rule at list price ($3k rent vs $199k).
- Recommended offer: $175k (12.0% below list) — sets the bar for market timing.
- Cap rate 10.1% vs local median 2.6% in New York — top-decile yield for the area; either an underpriced asset or a hidden risk that comps aren't pricing in. Stress-test before assuming the spread holds.
Location & tenants
- Location reads 75/100 on livability (#268 in NY, #4,188 nationally) — a middle-class / working-renter tenant base. Strengths: amenities A+, commute A+, health & safety A; Watch: crime F, cost of living F.
- Market conditions: 138 active listings in the ZIP; 24 comparable units currently listed for rent nearby; rentals at typical pace (median 25d on market — plan ~3-4 weeks tenant-placement turnaround); solid renter incomes; 5,302 units permitted in Queens County in 2024 (4,918 in 5+ unit buildings).
- This rent runs 34% of the median local income ($91k/yr) — at the standard rent-burdened threshold; future hikes will face affordability resistance.
Forward outlook
- Local home prices are declining (-3.0%/yr); year-one equity from $1k of loan paydown is wiped out by about $6k of value loss. Plan a longer hold.
- Queens County population projected at +16% by 2050 — long-run rental-demand tailwind backs the buy-and-hold thesis.
- At projected returns (-3.0% appreciation + 3.0% rent growth), your $56k cash investment doubles in ~9 years — after that, you're playing with house money.
Negotiation context
- It's been on market 135 days — a 12% lower offer ($175k) is reasonable based on typical stale-listing flexibility.
- 5 sale attempts with the ask held roughly flat each time — persistent listings suggest the price (not the market) is what's stuck; bring a comps-based counter.
Risks & watch-outs
- Watch-outs: built in 1952 — expect roof / HVAC / electrical / plumbing capex.
Questions for the listing agent
- It's been on market 135 days. Have you received any prior offers? Is the seller open to a 12% concession, seller financing, or rate buy-down credit?
- Built in 1952 — when were the roof, HVAC, electrical panel, plumbing, and water heater last replaced?
- Any open or pending special assessments — roof, HVAC, plumbing, elevator, façade? What's the per-unit balance and payoff schedule, and is the seller paying it off at close or rolling it to the buyer?
- Why hasn't it sold? Are there any deal-killer items the seller is aware of (foundation, flood, title, zoning, code violations)?
- Is there a deadline driving the sale (1031 exchange, divorce, estate, relocation)? That informs how much negotiation room exists.
- Schools are B-rated — typically a magnet for longer-tenancy family renters. What's the average tenant stay here, and is there a school-zone premium baked into asking?
- Crime grade is F in this area — have there been break-ins, vandalism, or insurance claims at this property in the last 3 years? What carrier currently insures it and at what premium?
- What's the average days-on-market for RENTAL listings here right now (not sales)? A rising rental-DOM trend means longer vacancies and softer asking-rent achievability than the comps imply.
- What's the recent tenant-quality profile in this submarket — average credit score on applications, eviction rate, late-payment / NSF rate, and stable-employment percentage? A property-management company in the area should have these aggregated.
- How much new apartment / multifamily construction is in the pipeline within 1–3 miles? Heavy new supply (>2% of stock underway) typically softens rents 12–24 months out; light construction supports rent growth.
Investment metrics
- 1% rule
- 1.28% ✓
- Cap rate
- 10.13%
- Cash-on-cash
- 13.71%
- DSCR
- 1.61
- GRM
- 6.5
CMA / ARV
No comps found within radius.
Projected returns pro-forma
-3.0% appreciation · 3.0% rent growth · sell at horizon
- IRR
- 3.9%
- Equity multiple
- 1.15×
- Total profit
- $8,343
- Equity at exit
- $29,672
- IRR
- 13.4%
- Equity multiple
- 2.07×
- Total profit
- $59,637
- Equity at exit
- $17,206
Cash invested: $55,720 (down + closing). Projections, not guarantees.
Landlord ↔ Tenant lean methodology
- Overall (CITY)
- 0 Strongly Tenant-Friendly
- State New York
- 15 Strongly Tenant-Friendly · D+10
- County
- — inherits STATE
- City New York
- 0 Strongly Tenant-Friendly · D+34
ZIP-level market 11421
- Active inventory
- 138
- Price-to-rent
- 6.5×
Monthly cashflow live
- Estimated rent
- $2,547 high interval (Pro) →
- Mortgage (P&I)
- −$1,044
- Tax est. 1.5%
- −$249 /mo · $2,985/yr
- Insurance
- −$83
- HOA
- −$0
- Vacancy / Maint / Mgmt
- −$535
- Net cashflow
- $637
Break-even live
UW: 25.0% down · 7.5% · 30yr · 1.5% tax · 5.0% vac · 8.0% maint · 8.0% mgmt
Financing live
Cash to close
- Down payment
- $49,750
- Closing costs
- $5,970
- Reserves months
- —
- Total cash needed
- —
Loan-product check · same deal, 3 products live
Conventional
25% down · 7.5% · 30yr
- Down + closing
- —
- Monthly P&I
- —
- Monthly cashflow
- —
- DSCR
- —
- Eligible?
- —
Personal DTI + credit; lowest rate.
DSCR
20% down · 8.5% · 30yr
- Down + closing
- —
- Monthly P&I
- —
- Monthly cashflow
- —
- DSCR
- —
- Eligible?
- —
No personal income docs; deal must DSCR.
Hard money
10% down · 12.0% · 12mo
- Down + closing
- —
- Monthly P&I
- —
- Monthly cashflow
- —
- DSCR
- —
- Eligible?
- —
Short-term bridge; refi at stabilization.
Rent comps 24 comps
| Address | Beds | Baths | Sqft | Rent | $/sqft | DOM | Units | Dist |
|---|---|---|---|---|---|---|---|---|
| 8456 98th St Woodhaven, NY | 1.0 | 1.0 | 1092 | $2,500 | $2.29 | 10d | 1 | 0.30mi |
| 8371 116th St Jamaica, NY | 1.0 | 1.0 | 688 | $2,725 | $3.96 | 5d | 2 | 0.91mi |
| 8371 116th St Unit 7C Richmond Hill, NY | 1.0 | 1.0 | 800 | $2,750 | $3.44 | 2d | 1 | 0.93mi |
| 8375 117th St Richmond Hill, NY | 1.0 | 1.0 | 650 | $2,695 | $4.15 | 24d | 1 | 0.96mi |
| 8375 117th St Unit 5E Richmond Hill, NY | 1.0 | 1.0 | 650 | $2,650 | $4.08 | 12d | 1 | 0.96mi |
| 8380 118th St Unit 2P Kew Gardens, NY | — | 1.0 | 550 | $1,900 | $3.45 | 13d | 1 | 0.98mi |
| 83-60 118th St Unit 4F Kew Gardens, NY | 2.0 | 1.0 | 800 | $2,500 | $3.12 | 24d | 1 | 1.01mi |
| 8383 118th St Kew Gardens, NY | 1.0–2.0 | 1.0–1.5 | 900 | $2,600 | $2.89 | 24d | 2 | 1.03mi |
| 83-83 118th St Unit 2E Kew Gardens, NY | 2.0 | 1.5 | 1000 | $3,200 | $3.20 | 14d | 1 | 1.03mi |
| 11624 Grosvenor Ln Unit 11D Richmond Hill, NY | 2.0 | 2.0 | 950 | $3,200 | $3.37 | 24d | 1 | 1.05mi |
| 12015 Jamaica Ave Unit 2 Jamaica, NY | 2.0 | 1.0 | 700 | $2,200 | $3.14 | 24d | 1 | 1.05mi |
| 78-68 84th St Unit 2 Flushing, NY | 2.0 | 1.0 | 800 | $3,500 | $4.38 | 24d | 1 | 1.08mi |
| 9915 Ascan Ave Forest Hills, NY | 2.0 | 1.0 | 600 | $2,700 | $4.50 | 24d | 1 | 1.11mi |
| 8321 Lefferts Blvd Kew Gardens, NY | — | 1.0 | 550 | $2,100 | $3.82 | 24d | 1 | 1.11mi |
| 91-19 75th St #1 Woodhaven, NY | 1.0 | 1.0 | 600 | $2,100 | $3.50 | 7d | 1 | 1.11mi |
| 91-04 75th St Unit 1 Jamaica, NY | 1.0 | 1.0 | 600 | $2,100 | $3.50 | 24d | 1 | 1.12mi |
| 9105 107th Ave Ozone Park, NY | 1.0 | 1.0 | 648 | $2,400 | $3.70 | 19d | 1 | 1.13mi |
| 122-08 Hillside Ave Unit 2 Jamaica, NY | 2.0 | 1.0 | 700 | $2,500 | $3.57 | 24d | 1 | 1.14mi |
| 9512 108th Ave Ozone Park, NY | 2.0 | 1.0 | 1000 | $2,800 | $2.80 | 11d | 1 | 1.19mi |
| 123-16 Hillside Ave Unit 1st Fl Jamaica, NY | 2.0 | 1.0 | 869 | $2,700 | $3.11 | 24d | 1 | 1.20mi |
| 124-14 Metropolitan Ave Unit 2F Kew Gardens, NY | 2.0 | 1.0 | 850 | $2,900 | $3.41 | 24d | 1 | 1.27mi |
| 123-08 95th Ave Unit 2 South Richmond Hill, NY | 2.0 | 1.5 | 1000 | $2,400 | $2.40 | 24d | 1 | 1.28mi |
| 8340 Austin St Unit 7N Kew Gardens, NY | — | 1.0 | 550 | $2,000 | $3.64 | 24d | 1 | 1.36mi |
| 150 Greenway Ter Forest Hills, NY | 1.0–2.0 | 1.0 | 937 | $3,825 | $4.08 | 20d | 2 | 1.49mi |
HOA detail condo
- Monthly dues
- $0 · $0/yr
- Assessments
- None detected in remarks — confirm with the listing agent.
Listing history 19 events
-
2026-06-18days on market $199,000 Active 135 DOM
-
2026-06-17days on market $199,000 Active 134 DOM
-
2026-06-15days on market $199,000 Active 132 DOM
-
2026-06-13days on market $199,000 Active 130 DOM
-
2026-06-10days on market $199,000 Active 126 DOM
-
2026-06-08days on market $199,000 Active 125 DOM
-
2026-06-04days on market $199,000 Active 121 DOM
-
2026-06-03days on market $199,000 Active 120 DOM
-
2026-06-01days on market $199,000 Active 118 DOM
-
2026-05-31days on market $199,000 Active 117 DOM
-
2026-02-03$199,000 Active
-
2026-01-01historical
-
2025-12-31status Active
-
2025-11-01status Pending
-
2025-09-09$198,000 Active
-
2025-09-01historical
-
2025-07-07status Active
-
2025-06-10status Pending
-
2025-03-31$199,000 Active
ⓘ Source: listings_history table (triggers on properties + properties_extension) + one-shot
backfill from property_details.listing_events for pre-trigger history.
Nearby sold comps map
Loading sold comps map…
Walkable amenities ~0.75 mi
Loading nearby amenities…
Taxation est. · year 1
- Rental income
- $30,561
- − Mortgage interest
- −$11,147
- − Property taxes
- −$2,985
- − Insurance
- −$995
- − Repairs & maintenance
- −$2,445
- − Management
- −$2,445
- − Depreciation
- −$5,789
- Taxable income
- $4,755
- Est. tax owed @ 24.0%
- −$1,141
- After-tax cash flow
- $6,499/yr
For passive investors: Depreciation is non-cash, so a rental often shows a tax loss while cash-flowing — sheltering income. Rental losses are passive: they offset passive income freely, and up to $25,000/yr can offset ordinary (W-2) income if you actively participate and your MAGI is under $100k (phasing out to $0 by $150k); unused losses carry forward. On sale, claimed depreciation is recaptured at up to 25%, and gains may owe capital-gains tax (a 1031 exchange can defer both). Figures are a year-1 estimate at your 24.0% rate — not tax advice; consult a CPA.
Schools (NCES district)
No district data.
Livability — New York
- Score
- 75/100
- State rank
- #268
- US rank
- #4188
Category grades
Schools grade is shown separately in the Schools card above.
Census & demographics
- Census place
- New York, NY
- County
- Queens County · 1,914,869 people
- City population
- 7,731,280
- Metro
- New York-Newark-Jersey City, NY-NJ-PA
- Population (ZIP)
- 40,612
- Household income
- $90,685
- Rent vs Own
- Severe rent burden
- 1540.0
Population outlook (Queens County) Hauer SSP2
- Today (2025)
- 2,546,320 people
- By 2030
- 2,643,059 · +3.8%
- By 2040
- 2,815,563 · +10.6%
- By 2050
- 2,944,423 · +15.6%
- By 2075
- 3,123,338 · +22.7%
- By 2100
- 3,098,688 · +21.7%
Race, ethnicity, and origin ACS 2023
- Neighborhood character
- Diverse neighborhood (Simpson 0.63)
- Race & ethnicity
- Hispanic / Latino 56% Two or more races 24% Asian 20% White 13% Black 4%
- Hispanic origin (detail)
- Mexican 6% Puerto Rican 9% Dominican 18%
- Common ancestry
- Romanian 2%
- Foreign-born
- 52% · Canada, China, Jamaica
- Languages at home
- 30% English-only · Spanish 46% Chinese 9% Other Indo-European 7%
Political lean MEDSL · Queens
- 2024 margin
- Strong D (+24.6) · D 62.3% · R 37.7%
- 2008→2024 swing
- -26.2pp toward R · 2008: 50.8pp · 2024: 24.6pp
- All cycles
- 2024: D+24.6 2020: D+45.2 2016: D+53.4 2012: D+58.5 2008: D+50.8
Not yet ingested
- Civics
- —
Market trends
- HPI YoY
- ▼ -409.05%
- Current HPI
- 298.1143
- Rent YoY
- —
- Metro
- New York-Newark-Jersey City, NY-NJ-PA
- State GDP YoY
- ▲ 2.60%
- F500 in state
- 92
Industry mix (Fortune 500 HQ in NY)
| Industry | F500 HQs | Revenue |
|---|---|---|
| Financial Services | 10 | $950B |
|
||
| Consumer Goods | 9 | $162B |
|
||
| Insurance | 4 | $225B |
|
||
| Telecommunications | 2 | $144B |
|
||
| Pharmaceuticals | 2 | $112B |
|
||
| Media / Entertainment | 2 | $69B |
|
||
Price history
+0.0% since first listed9 events — show timeline
- 2026-02-03 Listed $199,000 OneKey® MLS as Distributed by MLS Grid
- 2026-01-01 Listing Removed — OneKey® MLS as Distributed by MLS Grid
- 2025-12-31 Relisted — OneKey® MLS as Distributed by MLS Grid
- 2025-11-01 Pending — OneKey® MLS as Distributed by MLS Grid
- 2025-09-09 Listed $198,000 OneKey® MLS as Distributed by MLS Grid
- 2025-09-01 Listing Removed — OneKey® MLS as Distributed by MLS Grid
- 2025-07-07 Relisted — OneKey® MLS as Distributed by MLS Grid
- 2025-06-10 Pending — OneKey® MLS as Distributed by MLS Grid
- 2025-03-31 Listed $199,000 OneKey® MLS as Distributed by MLS Grid
Cash-flow waterfall
monthlySold comps — $/sqft
last 12 mo · ≤1 miLoading sold comps…