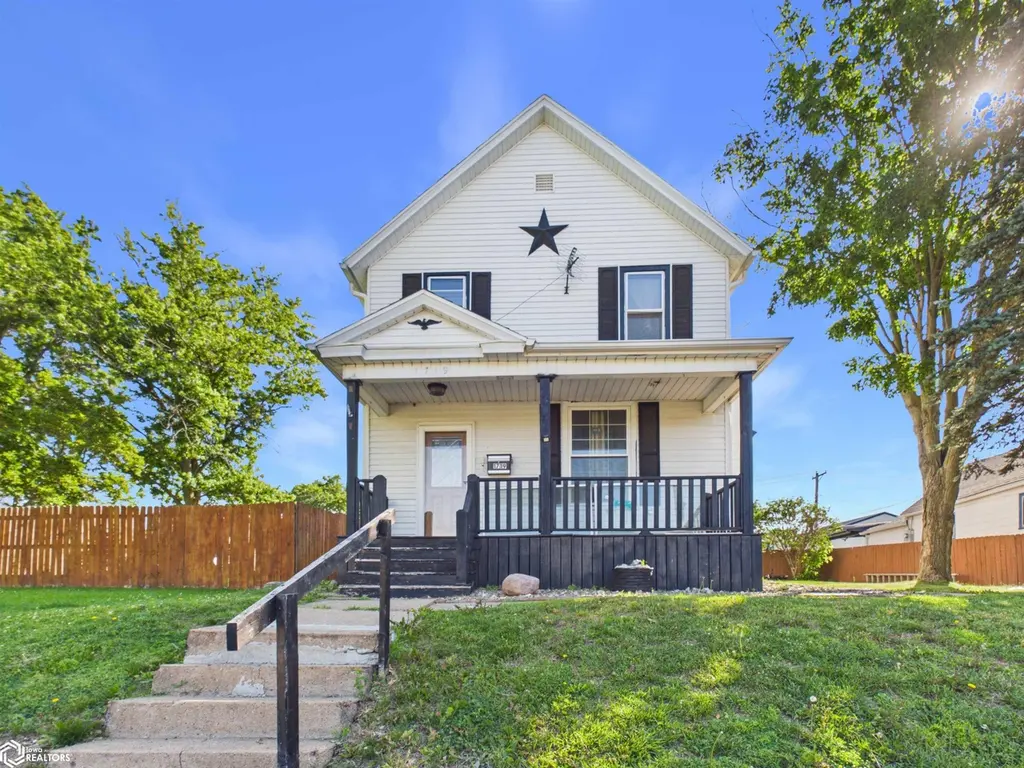
1719 Franklin St · Keokuk, IA
Flood risk 1/10 · Minimal
- FEMA flood zone
- X (unshaded)
- Chance of flooding over 30 yrs
- 0.0%
- Est. flood insurance / yr
- $473 – $860
Fire risk 1/10 · Minimal
- Est. fire insurance / yr
- $902 – $1,676
Heat risk 3/10 · Minor
- Hot days now (above 106°F)
- 7 days/yr
- Hot days in 30 yrs
- 16 days/yr
Wind risk 2/10 · Minimal
- Chance of severe wind over 30 yrs
- —
Air-quality risk 2/10 · Minimal
- Unhealthy air days now
- 0 days/yr
- Unhealthy air days in 30 yrs
- 1 days/yr
Risk factors via First Street. Map © Google.
Why this score? — see what drove the C- grade
The composite is a weighted blend of 9 inputs, each scored 0–100. Each bar is that input's sub-score; the figure is the points it added to the 100-point composite (weight × sub-score).
- ARV discount +15.0/15.0
- Cash flow +14.5/30.0
- 1% rule +4.5/10.0
- DSCR +4.4/10.0
- Schools +4.2/10.0
- Livability +3.9/5.0
- Rent growth +2.5/5.0
- Condition / age +2.5/5.0
- Appreciation +0.0/10.0
$109,900
🖨 Deal sheet (PDF) 📄 Offer letter ✓ Due diligence
Listing remarks MLS
Excellent location for this 2 story home with upgrades in kitchen and baths. Large livingroom, formal dining room, bedroom on main level with awesome barn doors. Very nice sized kitchen with room for large kitchen table. Lots of cabinets, stainless steel appliances and right off kitchen, a half bath with lots of storage. On main level also a mud room/laundry room. Upstairs are 2 bedrooms and a full bath. Nice back yard, patio area, two car garage and off street parking. Lots of new since 2017; roof, gutters, furnace, CA, vinyl siding, storm doors, vinyl windows. New steel beam in basement with life time house guarantee, new tankless water heater.
Key facts
- Newer roof
- Main level laundry
- 6,970 sq ft lot
Tags
Property features AI
Exterior
- Parking: Detached gravel garage with 1 garage space
- Utilities: Public water; Public sewer
- Home design: Two-story single-family home; Vinyl siding
- Construction: Vinyl siding construction
- Exterior features: Lot dimensions approximately 50 x 140 (0.16 acres)
Interior
- Bathrooms: 1 full bathroom; 1 half bathroom
- Heating & cooling: Central air conditioning; Forced air heating
- Interior features: Basement
Neighborhood map
What this means for you Summary
Snapshot
- This is a 3-bed/1.5-bath single-family listed at $110k.
Deal economics
- At list price, monthly cash flow is $24 ($289/yr) — positive.
- The deal already cash-flows at list — no discount required.
- To meet the 1% rule (rent ≥ 1% of price), the offer needs to be $104k (4.9% below list).
- Recommended offer: $104k (4.9% below list) — sets the bar for 1% rule.
- Cap rate 6.6% vs local median 8.2% in Keokuk — below-typical yield; the buyer is paying a premium for something (appreciation thesis, condition, location) that the cap rate doesn't capture.
Location & tenants
- Location reads 77/100 on livability (#166 in IA, #3,002 nationally) — a middle-class / working-renter tenant base. Strengths: cost of living A+, housing A+, health & safety A+; Watch: amenities C-, commute F, employment F.
- Keokuk Community School District (town): math 48% / reading 54% proficiency, ranked #282 of 289 in IA (top 98%) — acceptable for families but not a draw, mixed tenant base, ~2y average lease.
- Zoned schools: Hawthorne Elementary School (math 62% / reading 37%, grade D, #514 of 616 statewide, top 85%, 464 students, 68% FRL); Keokuk Middle School (math 45% / reading 48%, grade D+, #230 of 246 statewide, top 93%, 377 students, 60% FRL); Keokuk High School (math 48% / reading 63%, grade C, #287 of 336 statewide, top 86%, 598 students, 53% FRL).
- Market conditions: 74 active listings in the ZIP; 15 units permitted in Lee County in 2024 (0 in 5+ unit buildings).
Forward outlook
- Local home prices are declining (-3.0%/yr); year-one equity from $760 of loan paydown is wiped out by about $3k of value loss. Plan a longer hold.
- Lee County population projected at -15% by 2050 — secular population decline; favor cash flow + early exit over multi-decade hold.
Negotiation context
- It's been on market 17 days — a 2% lower offer ($108k) is reasonable based on typical stale-listing flexibility.
- 3 sale attempts since 11y ago with the ask held roughly flat each time — persistent listings suggest the price (not the market) is what's stuck; bring a comps-based counter.
- Current owner paid $87k; 26% above their basis — modest negotiation headroom, anchor on the comps not their cost.
Risks & watch-outs
- Watch-outs: built in 1898 — expect roof / HVAC / electrical / plumbing capex.
Questions for the listing agent
- Built in 1898 — when were the roof, HVAC, electrical panel, plumbing, and water heater last replaced?
- Is there a deadline driving the sale (1031 exchange, divorce, estate, relocation)? That informs how much negotiation room exists.
- What's the average days-on-market for RENTAL listings here right now (not sales)? A rising rental-DOM trend means longer vacancies and softer asking-rent achievability than the comps imply.
- What's the recent tenant-quality profile in this submarket — average credit score on applications, eviction rate, late-payment / NSF rate, and stable-employment percentage? A property-management company in the area should have these aggregated.
- How much new for-sale + rental construction is in the pipeline within 1–3 miles? Heavy new supply typically softens prices + rents 12–24 months out; constrained supply supports both.
Investment metrics
- 1% rule
- 0.95% ✗
- Cap rate
- 6.56%
- Cash-on-cash
- 0.94%
- DSCR
- 1.04
- GRM
- 8.8
CMA / ARV
- ARV (on-the-fly)
- $159,468
- Comps found
- 12
Show comp detail 12 sales within ~0.75 mi
| Address | Dist | Beds/Ba | Sqft | Sold | Price | $/sf | Match |
|---|---|---|---|---|---|---|---|
| 1616 High St | 0.25mi | 3/1.5 | 1,568 (-5%) | 6mo | $125,000 | $80 | 76 |
| 1322 Blondeau St | 0.46mi | 3/2.0 | 1,648 (+0%) | 1mo | $169,000 | $103 | 75 |
| 515 Hickory Ter | 0.53mi | 3/2.0 | 1,656 (+1%) | 5mo | $138,000 | $83 | 68 |
| 8 Crestview Dr | 0.37mi | 2/1.5 (-1) | 1,706 (+4%) | 4mo | $80,000 | $47 | 68 |
| 1818 Grand Ave | 0.39mi | 3/2.0 | 1,775 (+8%) | 2mo | $192,000 | $108 | 65 |
| 906 Morgan St | 0.60mi | 4/2.0 (+1) | 1,664 (+1%) | 5mo | $32,000 | $19 | 59 |
| 1014 Leighton St | 0.51mi | 3/1.5 | 1,490 (-9%) | 5mo | $99,500 | $67 | 56 |
| 2714 Windsor Hts | 0.56mi | 2/2.0 (-1) | 1,760 (+7%) | 1mo | $240,000 | $136 | 54 |
| 2210 Grand Ave | 0.50mi | 3/2.5 | 1,827 (+11%) | 1mo | $234,900 | $129 | 54 |
| 903 Blvd Rd | 0.53mi | 2/1.0 (-1) | 1,754 (+7%) | 6mo | $170,000 | $97 | 52 |
| 712 N 8th St | 0.66mi | 3/2.0 | 1,530 (-7%) | 5mo | $168,500 | $110 | 51 |
| 1002 Orleans Ave | 0.52mi | 3/2.5 | 1,856 (+13%) | 6mo | $133,000 | $72 | 45 |
Match score weights: distance 35% · size 25% · config 20% · recency 20%. Top-matched comps best support the ARV.
Projected returns pro-forma
-3.0% appreciation · 3.0% rent growth · sell at horizon
- IRR
- -14.8%
- Equity multiple
- 0.47×
- Total profit
- $-16,232
- Equity at exit
- $16,386
- IRR
- -6.0%
- Equity multiple
- 0.61×
- Total profit
- $-11,990
- Equity at exit
- $9,502
Cash invested: $30,772 (down + closing). Projections, not guarantees.
Landlord ↔ Tenant lean methodology
- Overall (STATE)
- 83 Strongly Landlord-Friendly
- State Iowa
- 83 Strongly Landlord-Friendly · R+6
- County
- — inherits STATE
- City
- — inherits STATE
ZIP-level market 52632
- Home prices YoY
- -25.5%
- Active inventory
- 74
- Price-to-rent
- 8.8×
Monthly cashflow live
- Estimated rent
- $1,045 medium interval (Pro) →
- Mortgage (P&I)
- −$576
- Tax from tax record
- −$179 /mo · $2,152/yr
- Insurance
- −$46
- HOA
- −$0
- Vacancy / Maint / Mgmt
- −$219
- Net cashflow
- $24
Break-even live
Sensitivity live
| Price | -10% $86 | -5% $55 | +0% $24 | +5% $-7 | +10% $-38 |
|---|---|---|---|---|---|
| Rent | -10% $-58 | -5% $-17 | +0% $24 | +5% $65 | +10% $107 |
| Rate | -1.0pp $79 | -0.5pp $52 | base $24 | +0.5pp $-4 | +1.0pp $-33 |
UW: 25.0% down · 7.5% · 30yr · 1.5% tax · 5.0% vac · 8.0% maint · 8.0% mgmt
Financing live
Cash to close
- Down payment
- $27,475
- Closing costs
- $3,297
- Reserves months
- —
- Total cash needed
- —
Loan-product check · same deal, 3 products live
Conventional
25% down · 7.5% · 30yr
- Down + closing
- —
- Monthly P&I
- —
- Monthly cashflow
- —
- DSCR
- —
- Eligible?
- —
Personal DTI + credit; lowest rate.
DSCR
20% down · 8.5% · 30yr
- Down + closing
- —
- Monthly P&I
- —
- Monthly cashflow
- —
- DSCR
- —
- Eligible?
- —
No personal income docs; deal must DSCR.
Hard money
10% down · 12.0% · 12mo
- Down + closing
- —
- Monthly P&I
- —
- Monthly cashflow
- —
- DSCR
- —
- Eligible?
- —
Short-term bridge; refi at stabilization.
Listing history 13 events
-
2026-06-21days on market $109,900 Active 17 DOM
-
2026-06-21days on market $109,900 Active 16 DOM
-
2026-06-18days on market $109,900 Active 14 DOM
-
2026-06-17days on market $109,900 Active 13 DOM
-
2026-06-16days on market $109,900 Active 12 DOM
-
2026-06-15days on market $109,900 Active 11 DOM
-
2026-06-13days on market $109,900 Active 9 DOM
-
2026-06-12days on market $109,900 Active 8 DOM
-
2026-06-09days on market $109,900 Active 5 DOM
-
2026-06-08days on market $109,900 Active 4 DOM
-
2026-06-07days on market $109,900 Active 3 DOM
-
2026-06-07remarks 699-char remark
-
2026-06-07$109,900 Active 2 DOM
ⓘ Source: listings_history table (triggers on properties + properties_extension) + one-shot
backfill from property_details.listing_events for pre-trigger history.
Tax reassessment forecast IA · Partial reset (capped growth)
- Current annual tax
- $2,152 · $179/mo
- Projected year-2 tax
- $2,152 · $179/mo
- Expected delta
- $0/yr ($0/mo · 0.0%)
ⓘ Screening estimate from a state-policy table — verify with the county assessor before closing.
Climate risk First Street
- Flood 1/10 Low FEMA zone X (unshaded) · 0% chance over 30 yrs
- Wildfire 1/10 Low
- Heat 3/10 Moderate 7 d/yr ≥106°F today · 16 d/yr by 30 yrs out
- Wind 2/10 Low
- Air quality 2/10 Low 0 unhealthy d/yr today · 1 by 30 yrs out
Nearby sold comps map
Loading sold comps map…
Walkable amenities ~0.75 mi
Loading nearby amenities…
Taxation est. · year 1
- Rental income
- $12,540
- − Mortgage interest
- −$6,156
- − Property taxes
- −$2,152
- − Insurance
- −$550
- − Repairs & maintenance
- −$1,003
- − Management
- −$1,003
- − Depreciation
- −$3,197
- Taxable loss
- −$1,521
- Est. tax savings @ 24.0%
- +$365
- After-tax cash flow
- $654/yr
For passive investors: Depreciation is non-cash, so a rental often shows a tax loss while cash-flowing — sheltering income. Rental losses are passive: they offset passive income freely, and up to $25,000/yr can offset ordinary (W-2) income if you actively participate and your MAGI is under $100k (phasing out to $0 by $150k); unused losses carry forward. On sale, claimed depreciation is recaptured at up to 25%, and gains may owe capital-gains tax (a 1031 exchange can defer both). Figures are a year-1 estimate at your 24.0% rate — not tax advice; consult a CPA.
Schools (NCES district)
- District
- Keokuk Community School District
- NCES district ID
- 1915630
- Math proficiency
- 48% ▼ -9.00%
- Reading proficiency
- 54% ▼ -2.00%
- Median HH income
- $36,973
- Composite
- 42.35/100
- National rank
- #3249
- State rank
- #282 of 289 in IA
Livability — Keokuk
- Score
- 77/100
- State rank
- #166
- US rank
- #3002
Category grades
Schools grade is shown separately in the Schools card above.
Census & demographics
- Census place
- Keokuk, IA
- Population (ZIP)
- 11,904
Population outlook (Lee County) Hauer SSP2
- Today (2025)
- 33,813 people
- By 2030
- 32,835 · -2.9%
- By 2040
- 30,690 · -9.2%
- By 2050
- 28,777 · -14.9%
- By 2075
- 25,568 · -24.4%
- By 2100
- 21,983 · -35.0%
Race, ethnicity, and origin ACS 2023
- Neighborhood character
- Predominantly White (91%)
- Race & ethnicity
- White 91% Two or more races 6% Hispanic / Latino 3% Black 3%
- Common ancestry
- Portuguese 3% Italian 2% Lithuanian 2%
- Foreign-born
- 1%
- Languages at home
- 99% English-only · Spanish 1%
Political lean MEDSL · Lee
- 2024 margin
- Strong R (+27.8) · D 35.0% · R 62.9% · Other 2.1%
- 2008→2024 swing
- -43.8pp toward R · 2008: 16.0pp · 2024: -27.8pp
- All cycles
- 2024: R+27.8 2020: R+19.3 2016: R+16.1 2012: D+16.0 2008: D+16.0
Not yet ingested
- Civics
- —
Market trends
- HPI YoY
- ▼ -41.80%
- Current HPI
- 122.2866
- Rent YoY
- —
- Metro
- —
- State GDP YoY
- ▲ 2.48%
- F500 in state
- 4
Industry mix (Fortune 500 HQ in IA)
| Industry | F500 HQs | Revenue |
|---|---|---|
| Financial Services | 1 | $16B |
|
||
| Retail / Convenience | 1 | $15B |
|
||
Price history
+41.8% since first listed7 events — show timeline
- 2026-06-04 Listed $109,900 IAR
- 2020-08-27 Sold (Public Records) $87,000 Public Records
- 2020-08-24 Sold (MLS) $87,000 IAR
- 2020-03-27 Listed $86,500 IAR
- 2015-08-12 Sold (Public Records) $77,600 Public Records
- 2015-06-26 Sold (MLS) $77,500 IAR
- 2015-04-10 Listed $77,500 IAR
Property tax history
+5.7%/yrLatest (2025): $2,152 · +5.5% YoY. Source: county tax records.
Cash-flow waterfall
monthlySold comps — $/sqft
last 12 mo · ≤1 miLoading sold comps…