116 Rio Dr · Youngsville, LA
Flood risk No data
- FEMA flood zone
- —
- Chance of flooding over 30 yrs
- —
- Est. flood insurance / yr
- —
Fire risk No data
- Est. fire insurance / yr
- —
Heat risk No data
- Hot days now (above threshold)
- —
- Hot days in 30 yrs
- —
Wind risk No data
- Chance of severe wind over 30 yrs
- —
Air-quality risk No data
- Unhealthy air days now
- —
- Unhealthy air days in 30 yrs
- —
Risk factors via First Street. Map © Google.
Why this score? — see what drove the D- grade
The composite is a weighted blend of 9 inputs, each scored 0–100. Each bar is that input's sub-score; the figure is the points it added to the 100-point composite (weight × sub-score).
- Cash flow +11.1/30.0
- ARV discount +7.3/15.0
- Livability +3.9/5.0
- Schools +3.6/10.0
- 1% rule +3.4/10.0
- DSCR +3.2/10.0
- Rent growth +2.9/5.0
- Condition / age +2.2/5.0
- Appreciation +0.0/10.0
$304,200
🖨 Deal sheet 📄 Offer letter ✓ Due diligence
Listing remarks
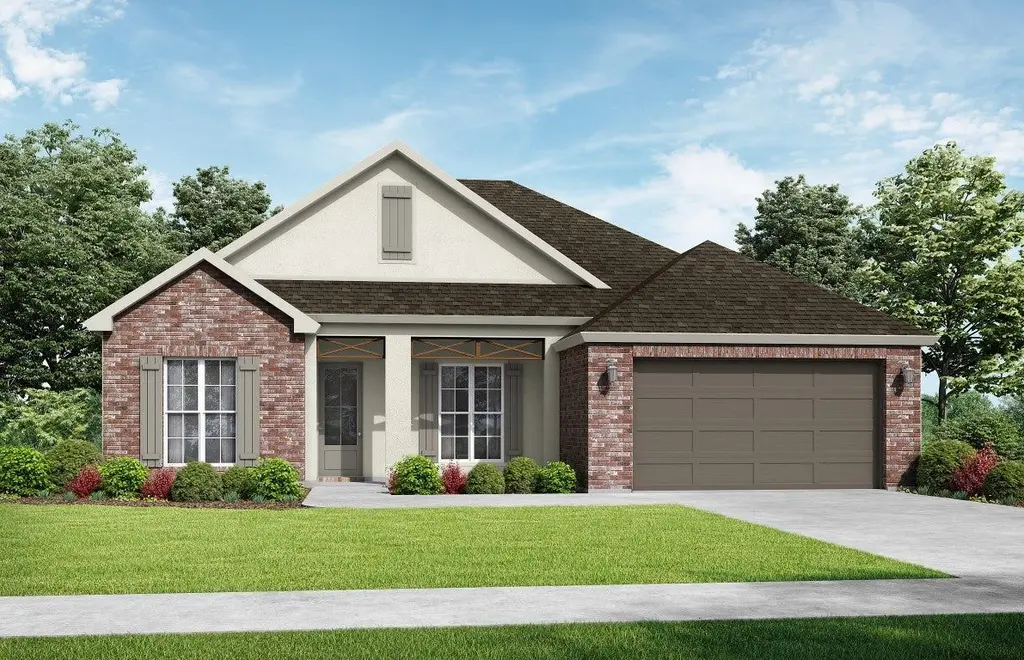
Set on a larger homesite, the Alder French offers the space and thoughtful design that make everyday living feel effortless. A welcoming foyer creates an inviting first impression, leading into an open layout where the dining, kitchen, and living areas flow seamlessly together. A striking beam detail defines the living space while maintaining an open feel, and the gas fireplace adds warmth and character as the focal point of the room. The private primary suite provides a relaxing retreat with a beautifully finished tiled shower featuring a built-in niche. Outside, generous green space and professional landscaping enhance the home's curb appeal. Blending comfort, functionality, and timeless
Key facts
- Striking beam detail
- Welcoming foyer
- Gas fireplace
Tags
Property features AI
Finance
- Other: Listing status: Active
- Financial info: List price $304,200
Exterior
- Parking: 2-car garage (2 total parking spaces)
- Home design: Single-family property (spec-built)
- Exterior features: Spec home — Alder plan; Address: 116 Rio Dr, Youngsville, LA 70592
Interior
- Bedrooms: 3 bedrooms
- Bathrooms: 2 full bathrooms
- Interior features: Open living area (1,719 total living area)
Neighborhood map
What this means for you Summary
Snapshot
- This is a 3-bed/2.0-bath single-family listed at $304k. Condition is rated fair.
Deal economics
- At list price, monthly cash flow is $-121 ($-1k/yr) — negative.
- To cash-flow at today's rent, offer at most $287k (5.8% below list).
- To meet the 1% rule (rent ≥ 1% of price), the offer needs to be $256k (15.9% below list).
- Recommended offer: $256k (15.9% below list) — sets the bar for 1% rule.
- Cap rate 5.8% vs local median 4.8% in Youngsville — meaningfully above typical; check what's discounted (condition, days-on-market, listing class) to confirm the premium yield is real.
Location & tenants
- Location reads 78/100 on livability (#8 in LA, #2,614 nationally) — a middle-class / working-renter tenant base. Strengths: schools A+, employment A+, housing A+; Watch: amenities F, commute F.
- Lafayette Parish (urban): math 38% / reading 46% proficiency, ranked #19 of 98 in LA (top 19%) — families likely to look elsewhere, expect single-tenant / working-renter base with shorter leases.
- Market conditions: Rents rising (+1.6%/yr); 675 active listings in the ZIP; 6 comparable units currently listed for rent nearby; rentals lingering (median 44d on market — plan ~5-8 weeks vacancy on turnover, expect pricing pressure); 50% of comp listings sitting > 30 days — soft ceiling on asking rent; solid renter incomes; 1,585 units permitted in Lafayette Parish in 2024 (10 in 5+ unit buildings).
- This rent runs 33% of the median local income ($93k/yr) — at the standard rent-burdened threshold; future hikes will face affordability resistance.
Forward outlook
- Local home prices are declining (-3.0%/yr); year-one equity from $2k of loan paydown is wiped out by about $9k of value loss. Plan a longer hold.
- Lafayette County population projected at +34% by 2050 — long-run rental-demand tailwind backs the buy-and-hold thesis.
Negotiation context
- Only 2 days on market — expect competitive offers; lowballing is unlikely to land.
Questions for the listing agent
- What do current leases actually rent for vs. the listed asking? Can we see a recent rent roll and the last 12 months of T-12 income?
- Have any recent inspections been done? Can we get a copy of the seller's disclosures and any deferred-maintenance estimates?
- What does the HOA fee cover, when was the last increase, and are there any pending special assessments or reserve-fund shortfalls?
- Is there a deadline driving the sale (1031 exchange, divorce, estate, relocation)? That informs how much negotiation room exists.
- Schools are A-rated — typically a magnet for longer-tenancy family renters. What's the average tenant stay here, and is there a school-zone premium baked into asking?
- The area grade is low — what's the realistic commute time and amenity access for the typical tenant pool here? Any planned neighborhood developments (good or bad) we should know about?
- What's the average days-on-market for RENTAL listings here right now (not sales)? A rising rental-DOM trend means longer vacancies and softer asking-rent achievability than the comps imply.
- What's the recent tenant-quality profile in this submarket — average credit score on applications, eviction rate, late-payment / NSF rate, and stable-employment percentage? A property-management company in the area should have these aggregated.
- How much new for-sale + rental construction is in the pipeline within 1–3 miles? Heavy new supply typically softens prices + rents 12–24 months out; constrained supply supports both.
Investment metrics
- 1% rule
- 0.84% ✗
- Cap rate
- 5.81%
- Cash-on-cash
- -1.71%
- DSCR
- 0.92
- GRM
- 9.9
CMA / ARV
- ARV (on-the-fly)
- $302,544
- Comps found
- 12
Show comp detail 12 sales within ~0.75 mi
| Address | Dist | Beds/Ba | Sqft | Sold | Price | $/sf | Match |
|---|---|---|---|---|---|---|---|
| 202 Central Village Way | 0.14mi | 3/2.0 | 1,719 (0%) | 2mo | $302,200 | $176 | 91 |
| 114 High Point Way | 0.15mi | 3/2.0 | 1,702 (-1%) | 1mo | $307,406 | $181 | 91 |
| 226 Central Village Way | 0.07mi | 3/2.0 | 1,767 (+3%) | 7mo | $311,500 | $176 | 87 |
| 200 Central Village Way | 0.16mi | 3/2.0 | 1,639 (-5%) | 0mo | $294,500 | $180 | 85 |
| 210 Central Village Way | 0.09mi | 3/2.5 | 1,843 (+7%) | 3mo | $317,000 | $172 | 79 |
| 100 Rio Dr | 0.19mi | 3/2.5 | 1,843 (+7%) | 1mo | $321,900 | $175 | 76 |
| 204 Central Village Way | 0.13mi | 4/2.0 (+1) | 1,874 (+9%) | 0mo | $318,600 | $170 | 73 |
| 202 San Sebastian Dr | 0.26mi | 3/2.0 | 1,570 (-9%) | 2mo | $299,000 | $190 | 72 |
| 210 San Sebastian Dr | 0.27mi | 3/2.0 | 1,597 (-7%) | 5mo | $302,000 | $189 | 71 |
| 203 Central Village Way | 0.16mi | 4/2.0 (+1) | 1,873 (+9%) | 2mo | $318,500 | $170 | 71 |
| 118 San Sebastian Dr | 0.24mi | 3/2.0 | 1,474 (-14%) | 2mo | $275,000 | $187 | 63 |
| 208 Caldwell Sugar Rd | 0.66mi | 4/2.0 (+1) | 1,563 (-9%) | 7mo | $239,000 | $153 | 43 |
Match score weights: distance 35% · size 25% · config 20% · recency 20%. Top-matched comps best support the ARV.
Projected returns pro-forma
-3.0% appreciation · 1.65% rent growth · sell at horizon
- IRR
- -20.7%
- Equity multiple
- 0.29×
- Total profit
- $-60,390
- Equity at exit
- $45,357
- IRR
- -17.2%
- Equity multiple
- 0.11×
- Total profit
- $-75,977
- Equity at exit
- $26,302
Cash invested: $85,176 (down + closing). Projections, not guarantees.
Landlord ↔ Tenant lean methodology
- Overall (STATE)
- 90 Strongly Landlord-Friendly
- State Louisiana
- 90 Strongly Landlord-Friendly · R+12
- County
- — inherits STATE
- City
- — inherits STATE
ZIP-level market 70592
- Home prices YoY
- -23.4%
- Rents YoY
- 1.6%
- Active inventory
- 675
- Price-to-rent
- 9.9×
Monthly cashflow live
- Estimated rent
- $2,558 high interval (Pro) →
- Mortgage (P&I)
- −$1,595
- Tax est. 1.5%
- −$380 /mo · $4,563/yr
- Insurance
- −$127
- HOA
- −$40
- Vacancy / Maint / Mgmt
- −$537
- Net cashflow
- $-121
Break-even live
UW: 25.0% down · 7.5% · 30yr · 1.5% tax · 5.0% vac · 8.0% maint · 8.0% mgmt
Financing live
Cash to close
- Down payment
- $76,050
- Closing costs
- $9,126
- Reserves months
- —
- Total cash needed
- —
Loan-product check · same deal, 3 products live
Conventional
25% down · 7.5% · 30yr
- Down + closing
- —
- Monthly P&I
- —
- Monthly cashflow
- —
- DSCR
- —
- Eligible?
- —
Personal DTI + credit; lowest rate.
DSCR
20% down · 8.5% · 30yr
- Down + closing
- —
- Monthly P&I
- —
- Monthly cashflow
- —
- DSCR
- —
- Eligible?
- —
No personal income docs; deal must DSCR.
Hard money
10% down · 12.0% · 12mo
- Down + closing
- —
- Monthly P&I
- —
- Monthly cashflow
- —
- DSCR
- —
- Eligible?
- —
Short-term bridge; refi at stabilization.
Rent comps 6 comps
| Address | Beds | Baths | Sqft | Rent | $/sqft | DOM | Units | Dist |
|---|---|---|---|---|---|---|---|---|
| 117 San Sebastian Dr Youngsville, LA | 4.0 | 3.0 | 2239 | $3,500 | $1.56 | 13d | 1 | 0.21mi |
| 305 San Sebastian Dr Youngsville, LA | 4.0 | 3.0 | 2128 | $2,800 | $1.32 | 43d | 1 | 0.22mi |
| 106 Royal Oak St Youngsville, LA | 3.0 | 2.0 | 1616 | $1,895 | $1.17 | 43d | 1 | 0.54mi |
| 111 Abbeywood Ct Youngsville, LA | 3.0 | 2.0 | 1616 | $1,800 | $1.11 | 21d | 1 | 0.67mi |
| 102 Border Ct Youngsville, LA | 4.0 | 2.0 | 1786 | $2,100 | $1.18 | 13d | 1 | 0.67mi |
| 110 Canton Ct Youngsville, LA | 3.0 | 2.0 | 1423 | $1,995 | $1.40 | 43d | 1 | 1.49mi |
HOA detail
- Monthly dues
- $40 · $480/yr
- Likely covers
- gaslandscaping
Listing history 13 events
-
2026-06-18days on market $304,200 Active 2 DOM
-
2026-06-17days on market $304,200 Active 1 DOM
-
2026-06-16days on market $304,200 Active 13 DOM
-
2026-06-15days on market $304,200 Active 12 DOM
-
2026-06-14days on market $304,200 Active 10 DOM
-
2026-06-13days on market $304,200 Active 9 DOM
-
2026-06-10days on market $304,200 Active 7 DOM
-
2026-06-09days on market $304,200 Active 6 DOM
-
2026-06-08days on market $304,200 Active 5 DOM
-
2026-06-07remarks 699-char remark
-
2026-06-07days on market $304,200 Active 4 DOM
-
2026-06-03remarks 4-char remark
-
2026-06-03$304,200 Active 1 DOM
ⓘ Source: listings_history table (triggers on properties + properties_extension) + one-shot
backfill from property_details.listing_events for pre-trigger history.
Nearby sold comps map
Loading sold comps map…
Walkable amenities ~0.75 mi
Loading nearby amenities…
Taxation est. · year 1
- Rental income
- $30,697
- − Mortgage interest
- −$17,040
- − Property taxes
- −$4,563
- − Insurance
- −$1,521
- − Repairs & maintenance
- −$2,456
- − Management
- −$2,456
- − HOA
- −$480
- − Depreciation
- −$8,849
- Taxable loss
- −$6,668
- Est. tax savings @ 24.0%
- +$1,600
- After-tax cash flow
- $144/yr
For passive investors: Depreciation is non-cash, so a rental often shows a tax loss while cash-flowing — sheltering income. Rental losses are passive: they offset passive income freely, and up to $25,000/yr can offset ordinary (W-2) income if you actively participate and your MAGI is under $100k (phasing out to $0 by $150k); unused losses carry forward. On sale, claimed depreciation is recaptured at up to 25%, and gains may owe capital-gains tax (a 1031 exchange can defer both). Figures are a year-1 estimate at your 24.0% rate — not tax advice; consult a CPA.
Condition & rehab AI · 3 photos
The home is in fair condition with good exterior and interior walls. Landscaping and painting would significantly enhance its curb appeal and value.
Value-add opportunities
- Both Landscaping — Enhanced landscaping can improve curb appeal and attract potential buyers or renters.
- Both Painting — Fresh paint can refresh the home's appearance and make it more appealing to buyers or renters.
- Both HVAC maintenance — Regular HVAC maintenance ensures the system is running efficiently and can prevent costly repairs.
Renovation cost estimate screening
Value-add ROI direction
- Both Landscaping — Enhanced landscaping can improve curb appeal and attract potential buyers or renters. ↑
- Both Painting — Fresh paint can refresh the home's appearance and make it more appealing to buyers or renters. ↑
- Both HVAC maintenance — Regular HVAC maintenance ensures the system is running efficiently and can prevent costly repairs. ↑
ⓘ Cost ranges are severity-bucket heuristics (US national rule-of-thumb). Get contractor quotes + a written scope before underwriting a rehab budget.
Schools (NCES district)
- District
- Lafayette Parish
- NCES district ID
- 2200870
- Math proficiency
- 38% ▼ -32.00%
- Reading proficiency
- 46% ▼ -24.00%
- Median HH income
- $50,238
- Composite
- 36.15/100
- National rank
- #4741
- State rank
- #19 of 98 in LA
Livability — Youngsville
- Score
- 78/100
- State rank
- #8
- US rank
- #2614
Category grades
Schools grade is shown separately in the Schools card above.
Census & demographics
- Census place
- Youngsville, LA
- County
- Lafayette Parish · 207,544 people
- City population
- 32,167
- Metro
- Lafayette, LA
- Population (ZIP)
- 32,167
- Household income
- $93,204
- Rent vs Own
- Severe rent burden
- 424.0
Population outlook (Lafayette County) Hauer SSP2
- Today (2025)
- 280,930 people
- By 2030
- 301,092 · +7.2%
- By 2040
- 339,456 · +20.8%
- By 2050
- 375,156 · +33.5%
- By 2075
- 451,672 · +60.8%
- By 2100
- 497,203 · +77.0%
Race, ethnicity, and origin ACS 2023
- Neighborhood character
- Predominantly White (82%)
- Race & ethnicity
- White 82% Black 10% Two or more races 5% Hispanic / Latino 4% Asian 1%
- Common ancestry
- Lithuanian 24% Romanian 3% Italian 1%
- Foreign-born
- 3% · Canada
- Languages at home
- 94% English-only · French/Haitian/Cajun 3% Spanish 2%
Political lean MEDSL · Lafayette
- 2024 margin
- Solid R (+31.4) · D 33.5% · R 64.8% · Other 1.7%
- 2008→2024 swing
- -0.1pp no change · 2008: -31.3pp · 2024: -31.4pp
- All cycles
- 2024: R+31.4 2020: R+28.7 2016: R+33.6 2012: R+33.7 2008: R+31.3
Not yet ingested
- Civics
- —
Market trends
- HPI YoY
- ▼ -41.24%
- Current HPI
- 135.2825
- Rent YoY
- ▲ 1.65%
- Metro
- Lafayette, LA
- State GDP YoY
- ▲ 3.29%
- F500 in state
- 10
Industry mix (Fortune 500 HQ in LA)
| Industry | F500 HQs | Revenue |
|---|---|---|
| Telecommunications | 2 | $23B |
|
||
| Utilities | 1 | $12B |
|
||
| Wholesale / Distribution | 1 | $5B |
|
||
| Advertising | 1 | $2B |
|
||
Cash-flow waterfall
monthlySold comps — $/sqft
last 12 mo · ≤1 miLoading sold comps…