10970 County Road 4020 · Mabank, TX
Flood risk 1/10 · Minimal
- FEMA flood zone
- X (unshaded)
- Chance of flooding over 30 yrs
- 0.0%
- Est. flood insurance / yr
- $507 – $1,088
Fire risk 3/10 · Minor
- Est. fire insurance / yr
- $1,222 – $2,270
Heat risk 7/10 · Major
- Hot days now (above 110°F)
- 7 days/yr
- Hot days in 30 yrs
- 27 days/yr
Wind risk 6/10 · Moderate
- Chance of severe wind over 30 yrs
- 69.0%
Air-quality risk 2/10 · Minimal
- Unhealthy air days now
- 0 days/yr
- Unhealthy air days in 30 yrs
- 1 days/yr
Risk factors via First Street. Map © Google.
Why this score? — see what drove the D grade
The composite is a weighted blend of 9 inputs, each scored 0–100. Each bar is that input's sub-score; the figure is the points it added to the 100-point composite (weight × sub-score).
- Cash flow +15.7/30.0
- ARV discount +7.5/15.0
- DSCR +4.8/10.0
- 1% rule +4.3/10.0
- Livability +3.5/5.0
- Schools +2.6/10.0
- Rent growth +2.5/5.0
- Condition / age +2.2/5.0
- Appreciation +0.0/10.0
$159,999
🖨 Deal sheet (PDF) 📄 Offer letter ✓ Due diligence
Listing remarks
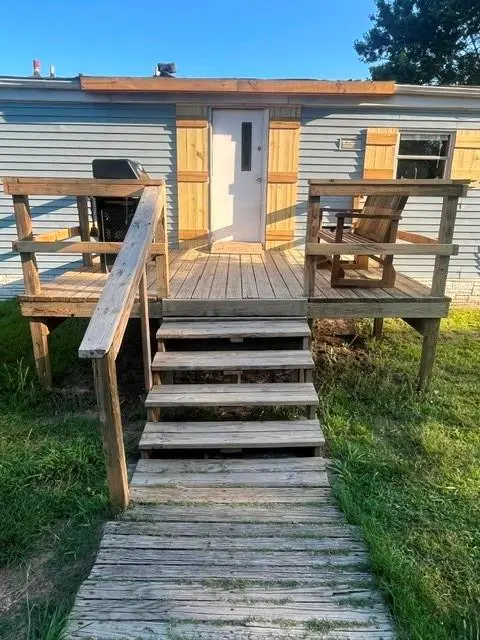
Enjoy the peace of country living with this 3-bedroom, 2-bath mobile home situated on a spacious almost 1-acre lot with an abundance of wildlife. Built in 1987, this home offers plenty of room both inside and out. In addition to the three bedrooms, you'll find a versatile bonus room that could easily serve as a 4th bedroom, home office, playroom, hobby space, or oversized pantry. The expansive acre of land provides endless opportunities for gardening, outdoor recreation, animals, or future improvements. This home is on a Water well. Whether you're looking for your first home, an investment property, or a quiet retreat away from the city, this property offers flexibility and potential at an
Key facts
- Water well
- Spacious lot
- Versatile bonus room
Tags
Property features AI
Finance
- Other: Possession at closing/funding; Listing status: Active
- Financial info: Listing terms: Cash or Conventional; Loan type treated as clear; No second mortgage indicated
- HOA & community: No association
Exterior
- Parking: Detached carport; Covered parking (2 covered spaces); 2 carport spaces; Driveway parking
- Utilities: Propane; Well water; Septic system; Cable available
- Home design: Mobile home (residential); One level; Preowned (built in 1987); Located in Lakeside Acres subdivision
- Construction: Built in 1987
- Exterior features: Chain link and wire fencing; Approximately 0.98-acre lot; Driveway with gravel
Interior
- Kitchen: Electric range
- Bedrooms: 3 bedrooms (primary bedroom on level 1)
- Flooring: Vinyl flooring; Wood flooring
- Bathrooms: 2 full bathrooms
- Heating & cooling: Propane heating; Window unit cooling
- Interior features: Cable TV available; Eat-in kitchen; One living area; One dining area; Room count: 2
- Laundry & utility: Propane heating (utility indicated); Well and septic service
Neighborhood map
What this means for you Summary
Snapshot
- This is a 3-bed/2.0-bath manufactured listed at $160k. Condition is rated fair.
Deal economics
- At list price, monthly cash flow is $71 ($854/yr) — positive.
- The deal already cash-flows at list — no discount required.
- To meet the 1% rule (rent ≥ 1% of price), the offer needs to be $149k (6.9% below list).
- Recommended offer: $149k (6.9% below list) — sets the bar for 1% rule.
- Cap rate 6.8% vs local median 3.1% in Mabank — top-decile yield for the area; either an underpriced asset or a hidden risk that comps aren't pricing in. Stress-test before assuming the spread holds.
Location & tenants
- Location reads 69/100 on livability (#446 in TX) — a middle-class / working-renter tenant base. Strengths: cost of living A+, housing A+, crime B+; Watch: amenities F, commute F, employment D-.
- Kemp ISD (rural): math 33% / reading 29% proficiency, ranked #605 of 826 in TX (top 73%) — families likely to look elsewhere, expect single-tenant / working-renter base with shorter leases.
- Zoned schools: Kemp Pri (503 students, 81% FRL); Kemp J H (math 28% / reading 26%, grade F, #1,177 of 1,662 statewide, top 72%, 401 students, 75% FRL); Kemp H S (math 32% / reading 37%, grade F, #963 of 1,632 statewide, top 61%, 543 students, 57% FRL) — zoned schools average 71% FRL vs 54% district-wide (16 pts higher); higher-poverty schools than district average — tighter screening recommended.
- Market conditions: 442 active listings in the ZIP; 3 comparable units currently listed for rent nearby; rentals at typical pace (median 26d on market — plan ~3-4 weeks tenant-placement turnaround); 1,747 units permitted in Kaufman County in 2024 (180 in 5+ unit buildings).
Forward outlook
- Local home prices are declining (-3.0%/yr); year-one equity from $1k of loan paydown is wiped out by about $5k of value loss. Plan a longer hold.
- Kaufman County population projected at +43% by 2050 — long-run rental-demand tailwind backs the buy-and-hold thesis.
Negotiation context
- It's been on market 20 days — a 2% lower offer ($158k) is reasonable based on typical stale-listing flexibility.
Risks & watch-outs
- Climate carrying-cost: major wind risk, 69% chance of damaging wind over 30y; extreme-heat days projected 7→27/yr by 2055 (HVAC capex compounding) — expect insurance premiums to compound above CPI over the hold.
Questions for the listing agent
- Have any recent inspections been done? Can we get a copy of the seller's disclosures and any deferred-maintenance estimates?
- Is there a deadline driving the sale (1031 exchange, divorce, estate, relocation)? That informs how much negotiation room exists.
- The area grade is low — what's the realistic commute time and amenity access for the typical tenant pool here? Any planned neighborhood developments (good or bad) we should know about?
- What's the average days-on-market for RENTAL listings here right now (not sales)? A rising rental-DOM trend means longer vacancies and softer asking-rent achievability than the comps imply.
- What's the recent tenant-quality profile in this submarket — average credit score on applications, eviction rate, late-payment / NSF rate, and stable-employment percentage? A property-management company in the area should have these aggregated.
- How much new for-sale + rental construction is in the pipeline within 1–3 miles? Heavy new supply typically softens prices + rents 12–24 months out; constrained supply supports both.
Investment metrics
- 1% rule
- 0.93% ✗
- Cap rate
- 6.83%
- Cash-on-cash
- 1.91%
- DSCR
- 1.08
- GRM
- 9.0
CMA / ARV
No comps found within radius.
Projected returns pro-forma
-3.0% appreciation · 3.0% rent growth · sell at horizon
- IRR
- -13.3%
- Equity multiple
- 0.52×
- Total profit
- $-21,371
- Equity at exit
- $23,856
- IRR
- -4.3%
- Equity multiple
- 0.72×
- Total profit
- $-12,682
- Equity at exit
- $13,834
Cash invested: $44,800 (down + closing). Projections, not guarantees.
Landlord ↔ Tenant lean methodology
- Overall (STATE)
- 87 Strongly Landlord-Friendly
- State Texas
- 87 Strongly Landlord-Friendly · R+5
- County
- — inherits STATE
- City
- — inherits STATE
ZIP-level market 75143
- Home prices YoY
- -11.4%
- Active inventory
- 442
- Price-to-rent
- 9.0×
Monthly cashflow live
- Estimated rent
- $1,490 medium interval (Pro) →
- Mortgage (P&I)
- −$839
- Tax est. 1.5%
- −$200 /mo · $2,400/yr
- Insurance
- −$67
- HOA
- −$0
- Vacancy / Maint / Mgmt
- −$313
- Net cashflow
- $71
Break-even live
Sensitivity live
| Price | -10% $182 | -5% $126 | +0% $71 | +5% $16 | +10% $-39 |
|---|---|---|---|---|---|
| Rent | -10% $-47 | -5% $12 | +0% $71 | +5% $130 | +10% $189 |
| Rate | -1.0pp $152 | -0.5pp $112 | base $71 | +0.5pp $30 | +1.0pp $-12 |
UW: 25.0% down · 7.5% · 30yr · 1.5% tax · 5.0% vac · 8.0% maint · 8.0% mgmt
Financing live
Cash to close
- Down payment
- $40,000
- Closing costs
- $4,800
- Reserves months
- —
- Total cash needed
- —
Loan-product check · same deal, 3 products live
Conventional
25% down · 7.5% · 30yr
- Down + closing
- —
- Monthly P&I
- —
- Monthly cashflow
- —
- DSCR
- —
- Eligible?
- —
Personal DTI + credit; lowest rate.
DSCR
20% down · 8.5% · 30yr
- Down + closing
- —
- Monthly P&I
- —
- Monthly cashflow
- —
- DSCR
- —
- Eligible?
- —
No personal income docs; deal must DSCR.
Hard money
10% down · 12.0% · 12mo
- Down + closing
- —
- Monthly P&I
- —
- Monthly cashflow
- —
- DSCR
- —
- Eligible?
- —
Short-term bridge; refi at stabilization.
Rent comps 3 comps
| Address | Beds | Baths | Sqft | Rent | $/sqft | DOM | Units | Dist |
|---|---|---|---|---|---|---|---|---|
| 100 Bridle Ct Kemp, TX | 3.0 | 2.5 | 1302 | $1,595 | $1.23 | 45d | 1 | 0.39mi |
| 212 Lasso Cir Mabank, TX | 2.0 | 2.0 | 1145 | $1,395 | $1.22 | 0d | 1 | 0.44mi |
| 214 Lasso Cir Kemp, TX | 2.0 | 2.0 | 1145 | $1,450 | $1.27 | 26d | 1 | 0.44mi |
Listing history 14 events
-
2026-06-21days on market $159,999 Active 20 DOM
-
2026-06-18days on market $159,999 Active 17 DOM
-
2026-06-17days on market $159,999 Active 16 DOM
-
2026-06-16days on market $159,999 Active 15 DOM
-
2026-06-15days on market $159,999 Active 14 DOM
-
2026-06-13days on market $159,999 Active 12 DOM
-
2026-06-13days on market $159,999 Active 11 DOM
-
2026-06-09days on market $159,999 Active 8 DOM
-
2026-06-08days on market $159,999 Active 7 DOM
-
2026-06-07days on market $159,999 Active 6 DOM
-
2026-06-04days on market $159,999 Active 3 DOM
-
2026-06-03days on market $159,999 Active 2 DOM
-
2026-06-02remarks 699-char remark
-
2026-06-02$159,999 Active 1 DOM
ⓘ Source: listings_history table (triggers on properties + properties_extension) + one-shot
backfill from property_details.listing_events for pre-trigger history.
Climate risk First Street
- Flood 1/10 Low FEMA zone X (unshaded) · 0% chance over 30 yrs
- Wildfire 3/10 Moderate
- Heat 7/10 Severe 7 d/yr ≥110°F today · 27 d/yr by 30 yrs out
- Wind 6/10 Major 69% chance of damaging wind over 30 yrs
- Air quality 2/10 Low 0 unhealthy d/yr today · 1 by 30 yrs out
Nearby sold comps map
Loading sold comps map…
Walkable amenities ~0.75 mi
Loading nearby amenities…
Taxation est. · year 1
- Rental income
- $17,877
- − Mortgage interest
- −$8,962
- − Property taxes
- −$2,400
- − Insurance
- −$800
- − Repairs & maintenance
- −$1,430
- − Management
- −$1,430
- − Depreciation
- −$4,655
- Taxable loss
- −$1,800
- Est. tax savings @ 24.0%
- +$432
- After-tax cash flow
- $1,286/yr
For passive investors: Depreciation is non-cash, so a rental often shows a tax loss while cash-flowing — sheltering income. Rental losses are passive: they offset passive income freely, and up to $25,000/yr can offset ordinary (W-2) income if you actively participate and your MAGI is under $100k (phasing out to $0 by $150k); unused losses carry forward. On sale, claimed depreciation is recaptured at up to 25%, and gains may owe capital-gains tax (a 1031 exchange can defer both). Figures are a year-1 estimate at your 24.0% rate — not tax advice; consult a CPA.
Condition & rehab AI · 12 photos
This 3-bedroom, 2-bath mobile home requires moderate repairs and maintenance to improve its condition and value. Key areas for attention include the kitchen and bathroom cabinets, HVAC system, and windows. Simple updates like painting and flooring replacement can significantly enhance its appeal and marketability.
Repairs flagged
- Minor kitchen cabinets — slight wear
- Minor bathroom cabinets — slight wear
- Moderate HVAC system — age and wear
Value-add opportunities
- Both paint interior walls — enhances appearance and value
- Both replace worn flooring — improves comfort and value
- Both repair/replace windows — increases natural light and value
Renovation cost estimate screening
| Repair item | Severity | Est. cost |
|---|---|---|
| kitchen cabinets · slight wear | Minor | $500–3,000 |
| bathroom cabinets · slight wear | Minor | $500–3,000 |
| HVAC system · age and wear | Moderate | $3,000–15,000 |
| Total estimated repair cost · 3 items | $4,000–21,000 |
Value-add ROI direction
- Both paint interior walls — enhances appearance and value ↑
- Both replace worn flooring — improves comfort and value ↑
- Both repair/replace windows — increases natural light and value ↑
ⓘ Cost ranges are severity-bucket heuristics (US national rule-of-thumb). Get contractor quotes + a written scope before underwriting a rehab budget.
Schools (NCES district)
- District
- Kemp ISD
- NCES district ID
- 4825320
- Math proficiency
- 33% ▼ -11.00%
- Reading proficiency
- 29% ▼ -5.00%
- Median HH income
- $42,788
- Composite
- 26.37/100
- National rank
- #7233
- State rank
- #605 of 826 in TX
Livability — Mabank
- Score
- 69/100
- State rank
- #446
- US rank
- #9068
Category grades
Schools grade is shown separately in the Schools card above.
Census & demographics
- Population (ZIP)
- 14,676
Population outlook (Kaufman County) Hauer SSP2
- Today (2025)
- 138,716 people
- By 2030
- 150,815 · +8.7%
- By 2040
- 174,877 · +26.1%
- By 2050
- 198,020 · +42.8%
- By 2075
- 251,908 · +81.6%
- By 2100
- 285,325 · +105.7%
Race, ethnicity, and origin ACS 2023
- Neighborhood character
- Predominantly White (80%)
- Race & ethnicity
- White 80% Hispanic / Latino 13% Two or more races 8% Black 2%
- Hispanic origin (detail)
- Mexican 13%
- Common ancestry
- Italian 2% Iranian 2% Lithuanian 1%
- Foreign-born
- 4% · Canada, China
- Languages at home
- 90% English-only · Spanish 9%
Political lean MEDSL · Kaufman
- 2024 margin
- Strong R (+27.9) · D 35.6% · R 63.5%
- 2008→2024 swing
- +7.9pp toward D · 2008: -35.8pp · 2024: -27.9pp
- All cycles
- 2024: R+27.9 2020: R+33.9 2016: R+47.0 2012: R+44.4 2008: R+35.8
Not yet ingested
- Civics
- —
Market trends
- HPI YoY
- ▼ -42.99%
- Current HPI
- 332.57
- Rent YoY
- —
- Metro
- —
- State GDP YoY
- ▲ 3.95%
- F500 in state
- 110
Industry mix (Fortune 500 HQ in TX)
| Industry | F500 HQs | Revenue |
|---|---|---|
| Energy | 16 | $1,198B |
|
||
| Technology | 5 | $198B |
|
||
| Engineering / Construction | 4 | $72B |
|
||
| Energy Services | 3 | $60B |
|
||
| Utilities | 3 | $41B |
|
||
| Healthcare | 2 | $330B |
|
||
Price history
1 event — show timeline
- 2026-06-01 Listed $159,999 NTREIS
Cash-flow waterfall
monthlySold comps — $/sqft
last 12 mo · ≤1 miLoading sold comps…