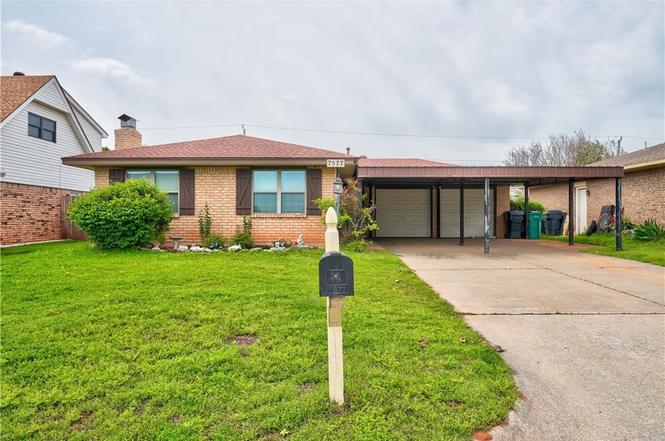
7577 S Embassy Ter · Oklahoma City, OK
Flood risk 1/10 · Minimal
- FEMA flood zone
- X (unshaded)
- Chance of flooding over 30 yrs
- 0.0%
- Est. flood insurance / yr
- $507 – $1,088
Fire risk 5/10 · Moderate
- Est. fire insurance / yr
- $2,463 – $4,575
Heat risk 5/10 · Moderate
- Hot days now (above 107°F)
- 7 days/yr
- Hot days in 30 yrs
- 19 days/yr
Wind risk 2/10 · Minimal
- Chance of severe wind over 30 yrs
- 4.0%
Air-quality risk 1/10 · Minimal
- Unhealthy air days now
- 0 days/yr
- Unhealthy air days in 30 yrs
- 0 days/yr
Risk factors via First Street. Map © Google.
Why this score? — see what drove the C- grade
The composite is a weighted blend of 9 inputs, each scored 0–100. Each bar is that input's sub-score; the figure is the points it added to the 100-point composite (weight × sub-score).
- Cash flow +22.0/30.0
- DSCR +7.1/10.0
- ARV discount +6.5/15.0
- 1% rule +5.1/10.0
- Livability +4.0/5.0
- Schools +3.1/10.0
- Rent growth +2.5/5.0
- Condition / age +2.5/5.0
- Appreciation +0.0/10.0
$165,000
🖨 Deal sheet 📄 Offer letter ✓ Due diligence
Listing remarks MLS
Entering for comps only. Sale processed prior to input to MLS.
Key facts
- 8,263 sq ft lot
- 2 garage spots
- Built 1966
Property features AI
Finance
- Other: Homestead not indicated; Located in Embassy West addition; Occupied; New listing; Living area reported as 1,063 (assessor)
- Financial info: Not assumable
- HOA & community: No mandatory association dues
Exterior
- Parking: 2-car garage
- Home design: Single family residence; One-level entry; Residential property
- Construction: Brick and frame construction; Architectural shingle roof; Slab foundation; Existing property
- Exterior features: Covered patio; Interior lot
Interior
- Bedrooms: 3 bedrooms
- Bathrooms: 1 full bathroom
- Heating & cooling: Central electric heating
- Interior features: Living area with one living area; Gas log fireplace
Neighborhood map
What this means for you Summary
Snapshot
- This is a 3-bed/1.0-bath single-family listed at $165k.
Deal economics
- At list price, monthly cash flow is $264 ($3k/yr) — positive.
- The deal already cash-flows at list — no discount required.
- Meets the 1% rule at list price ($2k rent vs $165k).
- Recommended offer: $145k (12.0% below list) — sets the bar for market timing.
- Cap rate 8.2% vs local median 3.7% in Oklahoma City — top-decile yield for the area; either an underpriced asset or a hidden risk that comps aren't pricing in. Stress-test before assuming the spread holds.
Location & tenants
- Location reads 80/100 on livability (#3 in OK, #1,635 nationally) — a professional / high-income tenant draw. Strengths: amenities A+, commute A+, cost of living A+; Watch: crime F.
- Mustang (suburban): math 35% / reading 33% proficiency, ranked #28 of 270 in OK (top 10%) — families likely to look elsewhere, expect single-tenant / working-renter base with shorter leases.
- Zoned schools: Prairie View Es (math 53% / reading 36%, grade F, #63 of 845 statewide, top 8%, 765 students, 0% FRL); Mustang Hs (math 28% / reading 39%, grade F, #65 of 447 statewide, top 14%, 3,756 students, 0% FRL) — zoned schools average 0% FRL vs 28% district-wide (28 pts lower); this property's tenant base skews higher-income than the district average.
- Market conditions: 9 active listings in the ZIP; 10 comparable units currently listed for rent nearby; rentals leasing fast (median 4d on market — plan ~1-2 weeks tenant-placement turnaround); 5,365 units permitted in Oklahoma County in 2024 (569 in 5+ unit buildings).
Forward outlook
- Local home prices are declining (-3.0%/yr); year-one equity from $1k of loan paydown is wiped out by about $5k of value loss. Plan a longer hold.
- Oklahoma County population projected at +41% by 2050 — long-run rental-demand tailwind backs the buy-and-hold thesis.
Negotiation context
- It's been on market 181 days — a 12% lower offer ($145k) is reasonable based on typical stale-listing flexibility.
- 2 sale attempts since 5y ago with the ask held roughly flat each time — persistent listings suggest the price (not the market) is what's stuck; bring a comps-based counter.
- Current owner paid $89k; list at $165k implies a 85% gain — meaningful room to come down on a strong offer.
Risks & watch-outs
- Climate carrying-cost: moderate wildfire risk; extreme-heat days projected 7→19/yr by 2055 (HVAC capex compounding) — expect insurance premiums to compound above CPI over the hold.
Questions for the listing agent
- It's been on market 181 days. Have you received any prior offers? Is the seller open to a 12% concession, seller financing, or rate buy-down credit?
- Built in 1966 — when were the roof, HVAC, electrical panel, plumbing, and water heater last replaced?
- Why hasn't it sold? Are there any deal-killer items the seller is aware of (foundation, flood, title, zoning, code violations)?
- Is there a deadline driving the sale (1031 exchange, divorce, estate, relocation)? That informs how much negotiation room exists.
- Schools are F-rated, which usually means shorter tenancies and higher turnover. Who's the typical renter profile here, and what's been the actual vacancy rate?
- Crime grade is F in this area — have there been break-ins, vandalism, or insurance claims at this property in the last 3 years? What carrier currently insures it and at what premium?
- What's the average days-on-market for RENTAL listings here right now (not sales)? A rising rental-DOM trend means longer vacancies and softer asking-rent achievability than the comps imply.
- What's the recent tenant-quality profile in this submarket — average credit score on applications, eviction rate, late-payment / NSF rate, and stable-employment percentage? A property-management company in the area should have these aggregated.
- How much new for-sale + rental construction is in the pipeline within 1–3 miles? Heavy new supply typically softens prices + rents 12–24 months out; constrained supply supports both.
Investment metrics
- 1% rule
- 1.01% ✓
- Cap rate
- 8.21%
- Cash-on-cash
- 6.86%
- DSCR
- 1.31
- GRM
- 8.3
CMA / ARV
- ARV (on-the-fly)
- $161,576
- Comps found
- 1
Show comp detail 1 sale within ~0.75 mi
| Address | Dist | Beds/Ba | Sqft | Sold | Price | $/sf | Match |
|---|---|---|---|---|---|---|---|
| 7569 S Embassy Ter | 0.02mi | 3/1.0 | 1,149 (+8%) | 6mo | $175,000 | $152 | 80 |
Match score weights: distance 35% · size 25% · config 20% · recency 20%. Top-matched comps best support the ARV.
Projected returns pro-forma
-3.0% appreciation · 3.0% rent growth · sell at horizon
- IRR
- -5.8%
- Equity multiple
- 0.78×
- Total profit
- $-9,957
- Equity at exit
- $24,602
- IRR
- 3.8%
- Equity multiple
- 1.28×
- Total profit
- $12,854
- Equity at exit
- $14,266
Cash invested: $46,200 (down + closing). Projections, not guarantees.
Landlord ↔ Tenant lean methodology
- Overall (STATE)
- 83 Strongly Landlord-Friendly
- State Oklahoma
- 83 Strongly Landlord-Friendly · R+20
- County
- — inherits STATE
- City
- — inherits STATE
ZIP-level market 73169
- Home prices YoY
- -11.2%
- Active inventory
- 9
- Price-to-rent
- 8.3×
Monthly cashflow live
- Estimated rent
- $1,663 high interval (Pro) →
- Mortgage (P&I)
- −$865
- Tax from tax record
- −$116 /mo · $1,394/yr
- Insurance
- −$69
- HOA
- −$0
- Vacancy / Maint / Mgmt
- −$349
- Net cashflow
- $264
Break-even live
UW: 25.0% down · 7.5% · 30yr · 1.5% tax · 5.0% vac · 8.0% maint · 8.0% mgmt
Financing live
Cash to close
- Down payment
- $41,250
- Closing costs
- $4,950
- Reserves months
- —
- Total cash needed
- —
Loan-product check · same deal, 3 products live
Conventional
25% down · 7.5% · 30yr
- Down + closing
- —
- Monthly P&I
- —
- Monthly cashflow
- —
- DSCR
- —
- Eligible?
- —
Personal DTI + credit; lowest rate.
DSCR
20% down · 8.5% · 30yr
- Down + closing
- —
- Monthly P&I
- —
- Monthly cashflow
- —
- DSCR
- —
- Eligible?
- —
No personal income docs; deal must DSCR.
Hard money
10% down · 12.0% · 12mo
- Down + closing
- —
- Monthly P&I
- —
- Monthly cashflow
- —
- DSCR
- —
- Eligible?
- —
Short-term bridge; refi at stabilization.
Rent comps 10 comps
| Address | Beds | Baths | Sqft | Rent | $/sqft | DOM | Units | Dist |
|---|---|---|---|---|---|---|---|---|
| 7901 S Council Rd Oklahoma City, OK | 2.0–3.0 | 2.0 | 1064 | $1,299 | $1.22 | 1d | 1 | 0.53mi |
| 7520 Redbud Villa Ct Oklahoma City, OK | 3.0 | 2.0 | 1269 | $1,600 | $1.26 | 23d | 1 | 0.54mi |
| 6509 Bent Wood Villas Dr Unit B Oklahoma City, OK | 2.0 | 2.0 | 1408 | $1,545 | $1.10 | 23d | 1 | 0.87mi |
| 5821 Goldfinger Rd Oklahoma City, OK | 2.0 | 1.5 | 1112 | $1,895 | $1.70 | 1d | 1 | 1.31mi |
| 5721 Campbell Creek Dr Oklahoma City, OK | 2.0 | 1.5 | 1112 | $1,895 | $1.70 | 1d | 1 | 1.37mi |
| 5712 Goldfinger Rd Oklahoma City, OK | 1.0–2.0 | 1.0–2.0 | 1116 | $2,095 | $1.88 | 1d | 1 | 1.37mi |
| 5700 Campbell Creek Dr Unit A Oklahoma City, OK | 2.0 | 1.5 | 1112 | $1,895 | $1.70 | 20d | 1 | 1.38mi |
| 5701 Goldfinger Rd Unit A Oklahoma City, OK | 2.0 | 2.0 | 1255 | $1,995 | $1.59 | 4d | 1 | 1.40mi |
| 8809 SW 55th St Unit B Oklahoma City, OK | 2.0 | 2.5 | 1246 | $1,595 | $1.28 | 23d | 1 | 1.43mi |
| 5632 Dunlin Rd Oklahoma City, OK | 3.0 | 2.0 | 1319 | $1,540 | $1.17 | 4d | 1 | 1.48mi |
Listing history 19 events
-
2026-06-18days on market $165,000 Active 181 DOM
-
2026-06-17days on market $165,000 Active 180 DOM
-
2026-06-16days on market $165,000 Active 179 DOM
-
2026-06-15days on market $165,000 Active 178 DOM
-
2026-06-13days on market $165,000 Active 176 DOM
-
2026-06-09days on market $165,000 Active 172 DOM
-
2026-06-08days on market $165,000 Active 171 DOM
-
2026-06-07days on market $165,000 Active 170 DOM
-
2026-06-05days on market $165,000 Active 167 DOM
-
2026-06-03days on market $165,000 Active 166 DOM
-
2026-06-02days on market $165,000 Active 165 DOM
-
2026-06-01days on market $165,000 Active 164 DOM
-
2026-05-31days on market $165,000 Active 163 DOM
-
2025-12-19$165,000 Active
-
2021-07-21soldstatus $89,000
-
2021-07-20soldstatus $89,000 Sold 63-char remark
Show marketing remark (63 chars)
Entering for comps only. Sale processed prior to input to MLS.
-
2021-05-29status Pending 63-char remark
Show marketing remark (63 chars)
Entering for comps only. Sale processed prior to input to MLS.
-
2021-05-29$93,000 Active 63-char remark
Show marketing remark (63 chars)
Entering for comps only. Sale processed prior to input to MLS.
-
1987-06-11soldstatus $42,500
ⓘ Source: listings_history table (triggers on properties + properties_extension) + one-shot
backfill from property_details.listing_events for pre-trigger history.
Tax reassessment forecast OK · Resets to sale price
- Current annual tax
- $1,394 · $116/mo
- Projected year-2 tax
- $1,485 · $124/mo
- Expected delta
- +$91/yr (+$8/mo · 6.6%)
ⓘ Screening estimate from a state-policy table — verify with the county assessor before closing.
Climate risk First Street
- Flood 1/10 Low FEMA zone X (unshaded) · 0% chance over 30 yrs
- Wildfire 5/10 Major
- Heat 5/10 Major 7 d/yr ≥107°F today · 19 d/yr by 30 yrs out
- Wind 2/10 Low 4% chance of damaging wind over 30 yrs
- Air quality 1/10 Low 0 unhealthy d/yr today · 0 by 30 yrs out
Nearby sold comps map
Loading sold comps map…
Walkable amenities ~0.75 mi
Loading nearby amenities…
Taxation est. · year 1
- Rental income
- $19,961
- − Mortgage interest
- −$9,243
- − Property taxes
- −$1,394
- − Insurance
- −$825
- − Repairs & maintenance
- −$1,597
- − Management
- −$1,597
- − Depreciation
- −$4,800
- Taxable income
- $506
- Est. tax owed @ 24.0%
- −$121
- After-tax cash flow
- $3,046/yr
For passive investors: Depreciation is non-cash, so a rental often shows a tax loss while cash-flowing — sheltering income. Rental losses are passive: they offset passive income freely, and up to $25,000/yr can offset ordinary (W-2) income if you actively participate and your MAGI is under $100k (phasing out to $0 by $150k); unused losses carry forward. On sale, claimed depreciation is recaptured at up to 25%, and gains may owe capital-gains tax (a 1031 exchange can defer both). Figures are a year-1 estimate at your 24.0% rate — not tax advice; consult a CPA.
Schools (NCES district)
- District
- Mustang
- NCES district ID
- 4021000
- Math proficiency
- 35% ▼ -10.00%
- Reading proficiency
- 33% ▼ -7.00%
- Median HH income
- $67,559
- Composite
- 31.21/100
- National rank
- #6038
- State rank
- #28 of 270 in OK
Livability — Oklahoma City
- Score
- 80/100
- State rank
- #3
- US rank
- #1635
Category grades
Schools grade is shown separately in the Schools card above.
Census & demographics
- Census place
- Oklahoma City, OK
- City population
- 498,656
- Population (ZIP)
- 3,432
Population outlook (Oklahoma County) Hauer SSP2
- Today (2025)
- 911,875 people
- By 2030
- 982,413 · +7.7%
- By 2040
- 1,130,468 · +24.0%
- By 2050
- 1,288,422 · +41.3%
- By 2075
- 1,711,482 · +87.7%
- By 2100
- 2,088,448 · +129.0%
Race, ethnicity, and origin ACS 2023
- Neighborhood character
- Diverse neighborhood (Simpson 0.61)
- Race & ethnicity
- White 59% Two or more races 26% Hispanic / Latino 18% Black 4% Asian 2% Native American 1%
- Hispanic origin (detail)
- Mexican 16% Puerto Rican 2%
- Common ancestry
- European 5% Lithuanian 3% Slovak 2%
- Foreign-born
- 6% · Canada, Vietnam
- Languages at home
- 88% English-only · Spanish 10% Vietnamese 3%
Political lean MEDSL · Oklahoma
- 2024 margin
- Toss-up / Even · D 48.0% · R 49.7% · Other 2.3%
- 2008→2024 swing
- +15.1pp toward D · 2008: -16.8pp · 2024: -1.7pp
- All cycles
- 2024: R+1.7 2020: R+1.1 2016: R+10.5 2012: R+16.7 2008: R+16.8
Not yet ingested
- Civics
- —
Market trends
- HPI YoY
- ▼ -31.93%
- Current HPI
- 253.6872
- Rent YoY
- —
- Metro
- —
- State GDP YoY
- ▲ 1.55%
- F500 in state
- 6
Industry mix (Fortune 500 HQ in OK)
| Industry | F500 HQs | Revenue |
|---|---|---|
| Energy | 3 | $48B |
|
||
Price history
+288.2% since first listed6 events — show timeline
- 2025-12-19 Listed $165,000 MLSOK
- 2021-07-21 Sold (Public Records) $89,000 Public Records
- 2021-07-20 Sold (MLS) $89,000 MLSOK
- 2021-05-29 Pending — MLSOK
- 2021-05-29 Listed $93,000 MLSOK
- 1987-06-11 Sold (Public Records) $42,500 Public Records
Property tax history
+4.8%/yrLatest (2025): $1,394 · +6.2% YoY. Source: county tax records.
Cash-flow waterfall
monthlySold comps — $/sqft
last 12 mo · ≤1 miLoading sold comps…