1527 W Homewood Ave · Jerome, IL
Flood risk 1/10 · Minimal
- FEMA flood zone
- X (unshaded)
- Chance of flooding over 30 yrs
- 0.0%
- Est. flood insurance / yr
- $473 – $860
Fire risk 1/10 · Minimal
- Est. fire insurance / yr
- $804 – $1,492
Heat risk 4/10 · Minor
- Hot days now (above 105°F)
- 7 days/yr
- Hot days in 30 yrs
- 20 days/yr
Wind risk 2/10 · Minimal
- Chance of severe wind over 30 yrs
- 1.0%
Air-quality risk 2/10 · Minimal
- Unhealthy air days now
- 1 days/yr
- Unhealthy air days in 30 yrs
- 2 days/yr
Risk factors via First Street. Map © Google.
Why this score? — see what drove the B grade
The composite is a weighted blend of 9 inputs, each scored 0–100. Each bar is that input's sub-score; the figure is the points it added to the 100-point composite (weight × sub-score).
- Cash flow +30.0/30.0
- 1% rule +10.0/10.0
- DSCR +10.0/10.0
- ARV discount +7.5/15.0
- Appreciation +5.0/10.0
- Livability +4.7/5.0
- Rent growth +2.5/5.0
- Condition / age +2.5/5.0
- Schools +1.7/10.0
$50,000
🖨 Deal sheet (PDF) 📄 Offer letter ✓ Due diligence
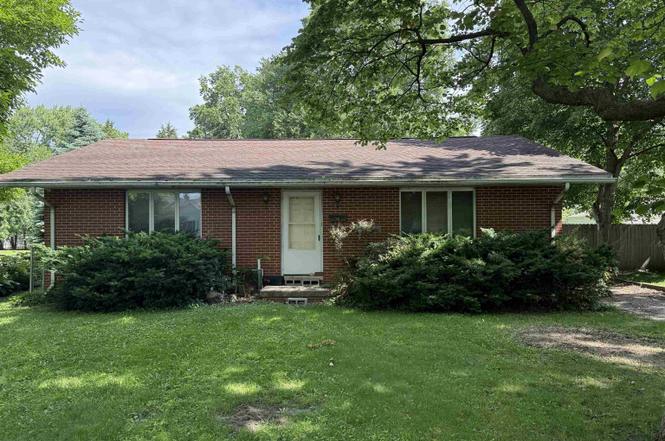
Listing remarks
All brick ranch home on a crawl. Fenced yard, patio.
Key facts
- 0.25 acre lot
- 2 garage spots
Property features AI
Exterior
- Parking: Attached 2-car garage; Gravel parking
- Utilities: Public water; Public sewer
- Home design: Single-family residence; Shingle roof
- Construction: Building area: 1607; Not new construction
- Exterior features: Fenced lot; Level lot; Paved road access
Interior
- Kitchen: Dishwasher
- Bedrooms: Two bedrooms (both on the main level) — primary approx. 15.03 x 11.09, second approx. 11.09 x 15.02; Egress windows in both bedrooms
- Flooring: Carpet in bedrooms, living room and family room; Vinyl in the kitchen
- Bathrooms: Two full bathrooms
- Heating & cooling: Hot water heating; Central air conditioning; Crawl space basement
- Interior features: Ceiling fan(s); Wood-burning fireplace in the family room
Neighborhood map
What this means for you Summary
Snapshot
- This is a 2-bed/2.0-bath single-family listed at $50k.
Deal economics
- At list price, monthly cash flow is $743 ($9k/yr) — positive.
- The deal already cash-flows at list — no discount required.
- Meets the 1% rule at list price ($1k rent vs $50k).
Location & tenants
- Location reads 93/100 on livability (#1 in IL, #17 nationally) — a professional / high-income tenant draw. Strengths: crime A+, amenities A+, commute A+; Watch: employment C-.
- Springfield SD 186 (urban): math 17% / reading 22% proficiency, ranked #438 of 620 in IL (top 71%) — low school quality limits family demand, transient renter base, plan for 1-2y turnover; 64% free/reduced lunch — lower-income household profile, screen leases tightly.
- Zoned schools: Lindsay School (math 17% / reading 22%, grade F, #1,054 of 2,056 statewide, top 54%, 423 students, 0% FRL); Benjamin Franklin Middle School (math 23% / reading 31%, grade F, #302 of 665 statewide, top 47%, 713 students, 0% FRL); Springfield Southeast High Sch (math 17% / reading 22%, grade F, #397 of 693 statewide, top 61%, 1,261 students, 0% FRL) — zoned schools average 0% FRL vs 64% district-wide (64 pts lower); this property's tenant base skews higher-income than the district average.
- Market conditions: 1 active listings in the ZIP; 4 comparable units currently listed for rent nearby; rentals at typical pace (median 23d on market — plan ~3-4 weeks tenant-placement turnaround); 225 units permitted in Sangamon County in 2024 (48 in 5+ unit buildings).
Forward outlook
- In year one you build about $2k of equity ($346 loan paydown + $2k appreciation (3.0% local appreciation)).
- Sangamon County population projected to shrink 9% by 2050 — rents likely to lag national; underwrite the cash flow, not the appreciation.
- At projected returns (3.0% appreciation + 3.0% rent growth), your $14k cash investment doubles in ~2 years — after that, you're playing with house money.
Negotiation context
- Only 1 days on market — expect competitive offers; lowballing is unlikely to land.
Questions for the listing agent
- Is there a deadline driving the sale (1031 exchange, divorce, estate, relocation)? That informs how much negotiation room exists.
- Schools are B-rated — typically a magnet for longer-tenancy family renters. What's the average tenant stay here, and is there a school-zone premium baked into asking?
- What's the average days-on-market for RENTAL listings here right now (not sales)? A rising rental-DOM trend means longer vacancies and softer asking-rent achievability than the comps imply.
- What's the recent tenant-quality profile in this submarket — average credit score on applications, eviction rate, late-payment / NSF rate, and stable-employment percentage? A property-management company in the area should have these aggregated.
- How much new for-sale + rental construction is in the pipeline within 1–3 miles? Heavy new supply typically softens prices + rents 12–24 months out; constrained supply supports both.
Investment metrics
- 1% rule
- 2.76% ✓
- Cap rate
- 24.12%
- Cash-on-cash
- 63.67%
- DSCR
- 3.83
- GRM
- 3.0
CMA / ARV
- ARV (on-the-fly)
- $183,198
- Comps found
- 12
Show comp detail 12 sales within ~0.75 mi
| Address | Dist | Beds/Ba | Sqft | Sold | Price | $/sf | Match |
|---|---|---|---|---|---|---|---|
| 1510 W Glenn Ave | 0.08mi | 3/2.0 (+1) | 1,562 (-3%) | 1mo | $316,500 | $203 | 86 |
| 2817 S Park Ave | 0.28mi | 3/1.5 (+1) | 1,598 (-1%) | 1mo | $182,500 | $114 | 78 |
| 2905 Park Ave | 0.29mi | 2/1.0 | 1,590 (-1%) | 4mo | $165,000 | $104 | 77 |
| 1668 Homewood Ave | 0.22mi | 3/2.0 (+1) | 1,535 (-4%) | 1mo | $141,000 | $92 | 77 |
| 1534 W Jerome Ave | 0.26mi | 3/2.0 (+1) | 1,596 (-1%) | 9mo | $192,000 | $120 | 74 |
| 1640 W Glenn Ave | 0.17mi | 2/1.0 | 1,706 (+6%) | 9mo | $196,000 | $115 | 70 |
| 2732 S Welch Ave | 0.33mi | 3/1.0 (+1) | 1,677 (+4%) | 2mo | $165,000 | $98 | 67 |
| 1705 Reed Ave | 0.26mi | 2/2.0 | 1,800 (+12%) | 2mo | $177,000 | $98 | 66 |
| 1900 Brentwood Dr | 0.48mi | 3/2.0 (+1) | 1,504 (-6%) | 9mo | $142,000 | $94 | 55 |
| 2425 S State St | 0.72mi | 3/1.5 (+1) | 1,510 (-6%) | 3mo | $170,000 | $113 | 47 |
| 58 Andover Dr | 0.75mi | 3/2.0 (+1) | 1,680 (+4%) | 7mo | $219,900 | $131 | 47 |
| 20 Longbow Ln | 0.74mi | 3/1.5 (+1) | 1,459 (-9%) | 7mo | $200,000 | $137 | 37 |
Match score weights: distance 35% · size 25% · config 20% · recency 20%. Top-matched comps best support the ARV.
Projected returns pro-forma
3.0% appreciation · 3.0% rent growth · sell at horizon
- IRR
- 68.5%
- Equity multiple
- 4.81×
- Total profit
- $53,354
- Equity at exit
- $22,482
- IRR
- 68.0%
- Equity multiple
- 9.83×
- Total profit
- $123,669
- Equity at exit
- $34,648
Cash invested: $14,000 (down + closing). Projections, not guarantees.
Landlord ↔ Tenant lean methodology
- Overall (STATE)
- 43 Moderately Tenant-Leaning
- State Illinois
- 43 Moderately Tenant-Leaning · D+7
- County
- — inherits STATE
- City
- — inherits STATE
ZIP-level market 62704-4849
- Active inventory
- 1
- Price-to-rent
- 3.0×
Monthly cashflow live
- Estimated rent
- $1,378 medium interval (Pro) →
- Mortgage (P&I)
- −$262
- Tax est. 1.5%
- −$62 /mo · $750/yr
- Insurance
- −$21
- HOA
- −$0
- Vacancy / Maint / Mgmt
- −$289
- Net cashflow
- $743
Break-even live
Sensitivity live
| Price | -10% $777 | -5% $760 | +0% $743 | +5% $726 | +10% $708 |
|---|---|---|---|---|---|
| Rent | -10% $634 | -5% $688 | +0% $743 | +5% $797 | +10% $852 |
| Rate | -1.0pp $768 | -0.5pp $756 | base $743 | +0.5pp $730 | +1.0pp $717 |
UW: 25.0% down · 7.5% · 30yr · 1.5% tax · 5.0% vac · 8.0% maint · 8.0% mgmt
Financing live
Cash to close
- Down payment
- $12,500
- Closing costs
- $1,500
- Reserves months
- —
- Total cash needed
- —
Loan-product check · same deal, 3 products live
Conventional
25% down · 7.5% · 30yr
- Down + closing
- —
- Monthly P&I
- —
- Monthly cashflow
- —
- DSCR
- —
- Eligible?
- —
Personal DTI + credit; lowest rate.
DSCR
20% down · 8.5% · 30yr
- Down + closing
- —
- Monthly P&I
- —
- Monthly cashflow
- —
- DSCR
- —
- Eligible?
- —
No personal income docs; deal must DSCR.
Hard money
10% down · 12.0% · 12mo
- Down + closing
- —
- Monthly P&I
- —
- Monthly cashflow
- —
- DSCR
- —
- Eligible?
- —
Short-term bridge; refi at stabilization.
Rent comps 4 comps
| Address | Beds | Baths | Sqft | Rent | $/sqft | DOM | Units | Dist |
|---|---|---|---|---|---|---|---|---|
| 1729 W Iles Ave Springfield, IL | 3.0 | 1.0 | 1162 | $1,500 | $1.29 | 22d | 1 | 0.28mi |
| 1666 Seven Pines Rd Springfield, IL | 1.0–4.0 | 1.0–1.5 | 1025 | $1,167 | $1.14 | 22d | 1 | 0.65mi |
| 9 Candlelight Dr Springfield, IL | 1.0–3.0 | 1.0–2.0 | 980 | $1,256 | $1.28 | 22d | 20 | 0.81mi |
| 2300 Lombard Ave Unit 2300 Lombard Springfield, IL | 2.0 | 1.0 | 1100 | $1,350 | $1.23 | 22d | 1 | 1.10mi |
Listing history 2 events
-
2026-06-15remarks 52-char remark
-
2026-06-15$50,000 Pending 1 DOM
ⓘ Source: listings_history table (triggers on properties + properties_extension) + one-shot
backfill from property_details.listing_events for pre-trigger history.
Climate risk First Street
- Flood 1/10 Low FEMA zone X (unshaded) · 0% chance over 30 yrs
- Wildfire 1/10 Low
- Heat 4/10 Moderate 7 d/yr ≥105°F today · 20 d/yr by 30 yrs out
- Wind 2/10 Low 100% chance of damaging wind over 30 yrs
- Air quality 2/10 Low 1 unhealthy d/yr today · 2 by 30 yrs out
Nearby sold comps map
Loading sold comps map…
Walkable amenities ~0.75 mi
Loading nearby amenities…
Taxation est. · year 1
- Rental income
- $16,532
- − Mortgage interest
- −$2,801
- − Property taxes
- −$750
- − Insurance
- −$250
- − Repairs & maintenance
- −$1,323
- − Management
- −$1,323
- − Depreciation
- −$1,455
- Taxable income
- $8,631
- Est. tax owed @ 24.0%
- −$2,072
- After-tax cash flow
- $6,842/yr
For passive investors: Depreciation is non-cash, so a rental often shows a tax loss while cash-flowing — sheltering income. Rental losses are passive: they offset passive income freely, and up to $25,000/yr can offset ordinary (W-2) income if you actively participate and your MAGI is under $100k (phasing out to $0 by $150k); unused losses carry forward. On sale, claimed depreciation is recaptured at up to 25%, and gains may owe capital-gains tax (a 1031 exchange can defer both). Figures are a year-1 estimate at your 24.0% rate — not tax advice; consult a CPA.
Schools (NCES district)
- District
- Springfield SD 186
- NCES district ID
- 1737080
- Math proficiency
- 17% ▼ -7.00%
- Reading proficiency
- 22% ▼ -5.00%
- Median HH income
- $43,744
- Composite
- 16.89/100
- National rank
- #9142
- State rank
- #438 of 620 in IL
Livability — Jerome
- Score
- 93/100
- State rank
- #1
- US rank
- #17
Category grades
Schools grade is shown separately in the Schools card above.
Census & demographics
- Census place
- Jerome, IL
Population outlook (Sangamon County) Hauer SSP2
- Today (2025)
- 198,317 people
- By 2030
- 196,127 · -1.1%
- By 2040
- 188,664 · -4.9%
- By 2050
- 179,624 · -9.4%
- By 2075
- 155,027 · -21.8%
- By 2100
- 122,588 · -38.2%
Not yet ingested
- Political lean
- —
- Race & ethnicity
- —
- Common origin
- —
- Civics
- —
Market trends
- HPI YoY
- —
- Current HPI
- —
- Rent YoY
- —
- Metro
- —
- State GDP YoY
- ▲ 1.59%
- F500 in state
- 60
Industry mix (Fortune 500 HQ in IL)
| Industry | F500 HQs | Revenue |
|---|---|---|
| Insurance | 4 | $201B |
|
||
| Consumer Goods | 4 | $87B |
|
||
| Industrial Machinery | 3 | $64B |
|
||
| Healthcare | 2 | $55B |
|
||
| Retail / Pharmacy | 1 | $148B |
|
||
| Agriculture / Food | 1 | $86B |
|
||
Price history
2 events — show timeline
- 2026-06-15 Pending — RMLSA as Distributed by MLS Grid
- 2026-06-15 Listed $50,000 RMLSA as Distributed by MLS Grid
Property tax history
+3.8%/yrLatest (2025): $3,211 · +5.1% YoY. Source: county tax records.
Cash-flow waterfall
monthlySold comps — $/sqft
last 12 mo · ≤1 miLoading sold comps…