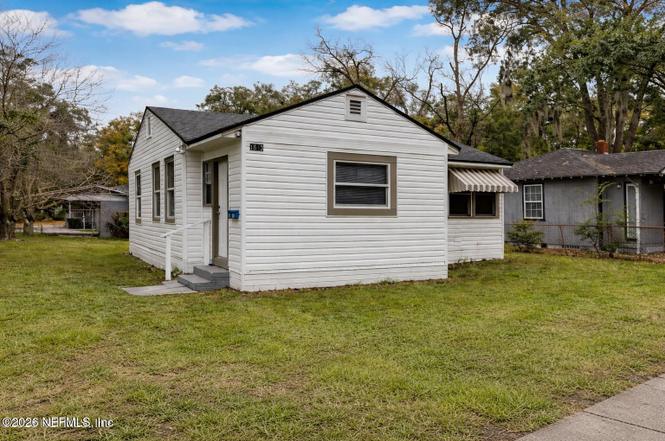
1643 W 34th St · Jacksonville, FL
Flood risk 1/10 · Minimal
- FEMA flood zone
- X (unshaded)
- Chance of flooding over 30 yrs
- 0.0%
- Est. flood insurance / yr
- $507 – $1,088
Fire risk 1/10 · Minimal
- Est. fire insurance / yr
- $947 – $1,759
Heat risk 8/10 · Major
- Hot days now (above 107°F)
- 6 days/yr
- Hot days in 30 yrs
- 18 days/yr
Wind risk 9/10 · Severe
- Chance of severe wind over 30 yrs
- 99.0%
Air-quality risk 4/10 · Minor
- Unhealthy air days now
- 6 days/yr
- Unhealthy air days in 30 yrs
- 6 days/yr
Risk factors via First Street. Map © Google.
Why this score? — see what drove the B grade
The composite is a weighted blend of 9 inputs, each scored 0–100. Each bar is that input's sub-score; the figure is the points it added to the 100-point composite (weight × sub-score).
- Cash flow +28.2/30.0
- ARV discount +12.3/15.0
- DSCR +10.0/10.0
- 1% rule +8.3/10.0
- Livability +4.2/5.0
- Schools +3.9/10.0
- Rent growth +3.0/5.0
- Condition / age +2.5/5.0
- Appreciation +0.0/10.0
$80,000
🖨 Deal sheet (PDF) 📄 Offer letter ✓ Due diligence
Listing remarks MLS
All offers must include proof of funds and binder deposit. SOLD ''as is'', seller makes no representation of warranties. Seller has no knowledge of lead paint or latent defects. Great investment opportunity. REMAX Brokerage sign is missing from front of property. Property owned by same seller, buy all three! MLS 576882, 576883, 576884
Key facts
- 2019 roof
- 4,791 sq ft lot
- Built 1939
Tags
Property features AI
Finance
- HOA & community: Not a senior community
Exterior
- Parking: Off-street parking; On-street parking
- Utilities: Public sewer; Electricity connected; Sewer connected; Water connected
- Home design: Single family residence; One level; Entry level: 1
- Construction: Frame construction with vinyl siding; Shingle roof
- Exterior features: Asphalt city street frontage
Interior
- Kitchen: No appliances included
- Bedrooms: 2 bedrooms
- Flooring: Vinyl flooring
- Bathrooms: 1 full bathroom
- Heating & cooling: Central heating (electric); Central air conditioning (electric)
- Interior features: Eat-in kitchen; Primary bathroom with tub and shower
- Laundry & utility: In-unit laundry with washer hookup and electric dryer hookup
Neighborhood map
What this means for you Summary
Snapshot
- This is a 2-bed/1.0-bath single-family listed at $80k.
Deal economics
- At list price, monthly cash flow is $254 ($3k/yr) — positive.
- The deal already cash-flows at list — no discount required.
- Meets the 1% rule at list price ($1k rent vs $80k).
- Recommended offer: $70k (12.0% below list) — sets the bar for market timing.
- Cap rate 10.1% vs local median 3.9% in Jacksonville — top-decile yield for the area; either an underpriced asset or a hidden risk that comps aren't pricing in. Stress-test before assuming the spread holds.
Location & tenants
- Location reads 83/100 on livability (#50 in FL, #911 nationally) — a professional / high-income tenant draw. Strengths: amenities A+, commute A+, housing A+.
- Duval (urban): math 46% / reading 45% proficiency, ranked #48 of 73 in FL (top 66%) — families likely to look elsewhere, expect single-tenant / working-renter base with shorter leases.
- Zoned schools: Grasp Academy (math 18% / reading 14%, grade F, #2,130 of 2,144 statewide, top 99%, 271 students, 52% FRL); Joseph Stilwell Middle School (math 31% / reading 33%, grade F, #448 of 571 statewide, top 79%, 612 students, 68% FRL); William M. Raines High School (math 14% / reading 13%, grade F, #616 of 667 statewide, top 92%, 1,217 students, 78% FRL) — zoned schools average 66% FRL vs 49% district-wide (17 pts higher); higher-poverty schools than district average — tighter screening recommended.
- Zoned-school proficiency averages 20% at this address vs 46% district-wide (-25 pts) — the specific schools serving this property underperform the Duval average; the district grade overstates school quality for this exact location.
- Market conditions: Rents rising (+1.8%/yr); 399 active listings in the ZIP; 40 comparable units currently listed for rent nearby; rentals at typical pace (median 26d on market — plan ~3-4 weeks tenant-placement turnaround); lower-income renter base — watch delinquency; 6,503 units permitted in Duval County in 2024 (1,131 in 5+ unit buildings).
Forward outlook
- Local home prices are declining (-3.0%/yr); year-one equity from $553 of loan paydown is wiped out by about $2k of value loss. Plan a longer hold.
- Duval County population projected at +19% by 2050 — long-run rental-demand tailwind backs the buy-and-hold thesis.
- At projected returns (-3.0% appreciation + 1.8% rent growth), your $22k cash investment doubles in ~10 years — after that, you're playing with house money.
Negotiation context
- It's been on market 128 days — a 12% lower offer ($70k) is reasonable based on typical stale-listing flexibility.
- 3 sale attempts since 19y ago; this cycle's ask has dropped $19k (19%) from the opening price — seller is motivated, your offer sets the floor, not the list.
Risks & watch-outs
- Watch-outs: built in 1939 — expect roof / HVAC / electrical / plumbing capex.
- Climate carrying-cost: severe wind risk, 99% chance of damaging wind over 30y; extreme-heat days projected 6→18/yr by 2055 (HVAC capex compounding) — expect insurance premiums to compound above CPI over the hold.
Questions for the listing agent
- It's been on market 128 days. Have you received any prior offers? Is the seller open to a 12% concession, seller financing, or rate buy-down credit?
- Built in 1939 — when were the roof, HVAC, electrical panel, plumbing, and water heater last replaced?
- Why hasn't it sold? Are there any deal-killer items the seller is aware of (foundation, flood, title, zoning, code violations)?
- Is there a deadline driving the sale (1031 exchange, divorce, estate, relocation)? That informs how much negotiation room exists.
- Schools are B-rated — typically a magnet for longer-tenancy family renters. What's the average tenant stay here, and is there a school-zone premium baked into asking?
- What's the average days-on-market for RENTAL listings here right now (not sales)? A rising rental-DOM trend means longer vacancies and softer asking-rent achievability than the comps imply.
- What's the recent tenant-quality profile in this submarket — average credit score on applications, eviction rate, late-payment / NSF rate, and stable-employment percentage? A property-management company in the area should have these aggregated.
- How much new for-sale + rental construction is in the pipeline within 1–3 miles? Heavy new supply typically softens prices + rents 12–24 months out; constrained supply supports both.
Investment metrics
- 1% rule
- 1.33% ✓
- Cap rate
- 10.11%
- Cash-on-cash
- 13.63%
- DSCR
- 1.61
- GRM
- 6.3
CMA / ARV
- ARV (on-the-fly)
- $89,500
- Comps found
- 12
Show comp detail 12 sales within ~0.75 mi
| Address | Dist | Beds/Ba | Sqft | Sold | Price | $/sf | Match |
|---|---|---|---|---|---|---|---|
| 4318 Bessie Cir W | 0.31mi | 3/1.0 (+1) | 864 (-4%) | 5mo | $117,200 | $136 | 71 |
| 1717 W 29th St | 0.25mi | 2/1.0 | 802 (-10%) | 4mo | $42,000 | $52 | 68 |
| 5298 Golfbrook Dr | 0.51mi | 2/1.0 | 875 (-2%) | 8mo | $116,500 | $133 | 66 |
| 1810 W 24th St | 0.53mi | 2/1.0 | 871 (-3%) | 7mo | $100,000 | $115 | 65 |
| 1751 W 20th St | 0.68mi | 2/1.0 | 880 (-2%) | 2mo | $27,500 | $31 | 64 |
| 4022 Spires Ave | 0.32mi | 3/1.0 (+1) | 828 (-8%) | 7mo | $83,000 | $100 | 62 |
| 1323 W 30th St | 0.47mi | 3/1.0 (+1) | 962 (+8%) | 1mo | $115,000 | $120 | 60 |
| 1413 25th St W | 0.55mi | 2/2.0 | 818 (-9%) | 8mo | $196,100 | $240 | 50 |
| 1204 W 29th St | 0.67mi | 3/1.0 (+1) | 960 (+7%) | 2mo | $50,000 | $52 | 50 |
| 2117 W 41st St | 0.74mi | 3/1.0 (+1) | 960 (+7%) | 3mo | $19,000 | $20 | 46 |
| 2058 W 40th St | 0.66mi | 3/1.0 (+1) | 1,010 (+13%) | 1mo | $71,000 | $70 | 42 |
| 2050 W 40th St | 0.65mi | 3/1.0 (+1) | 1,010 (+13%) | 3mo | $79,500 | $79 | 41 |
Match score weights: distance 35% · size 25% · config 20% · recency 20%. Top-matched comps best support the ARV.
Projected returns pro-forma
-3.0% appreciation · 1.81% rent growth · sell at horizon
- IRR
- 2.4%
- Equity multiple
- 1.09×
- Total profit
- $2,017
- Equity at exit
- $11,928
- IRR
- 10.7%
- Equity multiple
- 1.79×
- Total profit
- $17,727
- Equity at exit
- $6,917
Cash invested: $22,400 (down + closing). Projections, not guarantees.
Landlord ↔ Tenant lean methodology
- Overall (STATE)
- 87 Strongly Landlord-Friendly
- State Florida
- 87 Strongly Landlord-Friendly · R+3
- County
- — inherits STATE
- City
- — inherits STATE
ZIP-level market 32209
- Home prices YoY
- -22.1%
- Rents YoY
- 1.8%
- Active inventory
- 399
- Price-to-rent
- 6.3×
Monthly cashflow live
- Estimated rent
- $1,063 high interval (Pro) →
- Mortgage (P&I)
- −$420
- Tax from tax record
- −$133 /mo · $1,593/yr
- Insurance
- −$33
- HOA
- −$0
- Vacancy / Maint / Mgmt
- −$223
- Net cashflow
- $254
Break-even live
Sensitivity live
| Price | -10% $300 | -5% $277 | +0% $254 | +5% $232 | +10% $209 |
|---|---|---|---|---|---|
| Rent | -10% $170 | -5% $212 | +0% $254 | +5% $296 | +10% $338 |
| Rate | -1.0pp $295 | -0.5pp $275 | base $254 | +0.5pp $234 | +1.0pp $213 |
UW: 25.0% down · 7.5% · 30yr · 1.5% tax · 5.0% vac · 8.0% maint · 8.0% mgmt
Financing live
Cash to close
- Down payment
- $20,000
- Closing costs
- $2,400
- Reserves months
- —
- Total cash needed
- —
Loan-product check · same deal, 3 products live
Conventional
25% down · 7.5% · 30yr
- Down + closing
- —
- Monthly P&I
- —
- Monthly cashflow
- —
- DSCR
- —
- Eligible?
- —
Personal DTI + credit; lowest rate.
DSCR
20% down · 8.5% · 30yr
- Down + closing
- —
- Monthly P&I
- —
- Monthly cashflow
- —
- DSCR
- —
- Eligible?
- —
No personal income docs; deal must DSCR.
Hard money
10% down · 12.0% · 12mo
- Down + closing
- —
- Monthly P&I
- —
- Monthly cashflow
- —
- DSCR
- —
- Eligible?
- —
Short-term bridge; refi at stabilization.
Rent comps 40 comps
| Address | Beds | Baths | Sqft | Rent | $/sqft | DOM | Units | Dist |
|---|---|---|---|---|---|---|---|---|
| 1653 W 35th St Jacksonville, FL | 2.0 | 1.0 | 800 | $825 | $1.03 | 25d | 1 | 0.03mi |
| 1551 W 33rd St #2 Jacksonville, FL | 2.0 | 1.0 | 842 | $795 | $0.94 | 22d | 1 | 0.15mi |
| 1584 W 31st St Unit 3 Jacksonville, FL | 2.0 | 1.0 | 832 | $900 | $1.08 | 25d | 1 | 0.20mi |
| 1599 W 30th St Unit B Jacksonville, FL | 2.0 | 1.0 | 780 | $1,150 | $1.47 | 16d | 1 | 0.21mi |
| 4813 Moncrief Rd Jacksonville, FL | 2.0–3.0 | 1.0 | 755 | $870 | $1.15 | 4d | 8 | 0.26mi |
| 1839 W 30th St Jacksonville, FL | 3.0 | 1.0 | 828 | $1,050 | $1.27 | 25d | 1 | 0.30mi |
| 1737 W 28th St Jacksonville, FL | 3.0 | 1.0 | 1105 | $700 | $0.63 | 25d | 1 | 0.32mi |
| 1636 W 28th St Jacksonville, FL | 3.0 | 2.0 | 912 | $1,375 | $1.51 | 25d | 1 | 0.32mi |
| 4114 Moncrief Rd Unit 2 Jacksonville, FL | 2.0 | 1.0 | 821 | $1,050 | $1.28 | 25d | 1 | 0.33mi |
| 4114 Moncrief Rd Jacksonville, FL | 2.0 | 1.0 | 821 | $975 | $1.19 | 9d | 1 | 0.33mi |
| 1556 W 28th St Jacksonville, FL | 2.0 | 1.0 | 682 | $875 | $1.28 | 12d | 1 | 0.35mi |
| 1863 W 29th St Jacksonville, FL | 3.0 | 2.0 | 956 | $1,190 | $1.24 | 23d | 1 | 0.35mi |
| 5350 Dodge Rd Jacksonville, FL | 3.0 | 1.0 | 1000 | $1,500 | $1.50 | 25d | 1 | 0.38mi |
| 1417 W 31st St Jacksonville, FL | 3.0 | 1.0 | 880 | $1,100 | $1.25 | 3d | 1 | 0.38mi |
| 1625 W 26th St Unit 2 Jacksonville, FL | 2.0 | 1.0 | 750 | $800 | $1.07 | 25d | 1 | 0.40mi |
| 1625 W 26th St Jacksonville, FL | 2.0 | 1.0 | 750 | $800 | $1.07 | 3d | 1 | 0.40mi |
| 1625 W 26th St Unit 4 Jacksonville, FL | 2.0 | 1.0 | 750 | $900 | $1.20 | 25d | 1 | 0.40mi |
| 5352 Dodge Rd Jacksonville, FL | 3.0 | 2.0 | 1050 | $1,261 | $1.20 | 25d | 1 | 0.40mi |
| 1830 W 27th St Jacksonville, FL | 3.0 | 2.0 | 952 | $1,375 | $1.44 | 25d | 1 | 0.43mi |
| 1803 W 44th St Unit 1803 Jacksonville, FL | 2.0 | 1.0 | 750 | $950 | $1.27 | 9d | 1 | 0.43mi |
| 1823 W 44th St Jacksonville, FL | 3.0 | 2.0 | 1066 | $1,500 | $1.41 | 25d | 1 | 0.44mi |
| 1842 W 26th St Jacksonville, FL | 3.0 | 2.0 | 933 | $1,200 | $1.29 | 25d | 1 | 0.48mi |
| 1316 W 31st St Jacksonville, FL | 2.0 | 1.0 | 906 | $998 | $1.10 | 25d | 1 | 0.48mi |
| 1437 W 26th St Jacksonville, FL | 2.0 | 1.0 | 644 | $650 | $1.01 | 25d | 1 | 0.50mi |
| 1645 W 23rd St Unit 2 Jacksonville, FL | 3.0 | 1.0 | 912 | $1,275 | $1.40 | 25d | 1 | 0.54mi |
| 1363 W 24th St Jacksonville, FL | 2.0 | 1.0 | 660 | $995 | $1.51 | 6d | 1 | 0.62mi |
| 1959 W 45th St Jacksonville, FL | 2.0 | 1.0 | 895 | $1,245 | $1.39 | 15d | 1 | 0.62mi |
| 1526 W 22nd St Jacksonville, FL | 2.0 | 1.0 | 624 | $900 | $1.44 | 18d | 1 | 0.63mi |
| 1593 W 21st St Jacksonville, FL | 2.0 | 1.0 | 805 | $922 | $1.15 | 25d | 1 | 0.64mi |
| 2050 W 40th St Jacksonville, FL | 3.0 | 1.0 | 1010 | $1,350 | $1.34 | 18d | 1 | 0.65mi |
| 1196 W 30th St Jacksonville, FL | 2.0 | 1.0 | 875 | $880 | $1.01 | 19d | 1 | 0.67mi |
| 1968 W 23rd St Unit Main Jacksonville, FL | 3.0 | 2.0 | 1106 | $1,400 | $1.27 | 23d | 1 | 0.67mi |
| 1220 W 28th St Jacksonville, FL | 3.0 | 1.0 | 1122 | $1,299 | $1.16 | 25d | 1 | 0.67mi |
| 1204 W 29th St Jacksonville, FL | 1.0 | 3.0 | 960 | $1,295 | $1.35 | 16d | 1 | 0.67mi |
| 1536 W 45th St Jacksonville, FL | 2.0 | 1.0 | 800 | $1,050 | $1.31 | 25d | 1 | 0.67mi |
| 1971 W 22nd St Jacksonville, FL | 3.0 | 1.0 | 1094 | $1,095 | $1.00 | 9d | 1 | 0.68mi |
| 1201 W 27th St Jacksonville, FL | 3.0 | 2.0 | 1120 | $1,145 | $1.02 | 25d | 1 | 0.70mi |
| 5736 Teeler Ave Jacksonville, FL | 3.0 | 1.0 | 852 | $1,000 | $1.17 | 25d | 1 | 0.73mi |
| 1173 W 27th St Jacksonville, FL | 3.0 | 1.0 | 1080 | $1,145 | $1.06 | 15d | 1 | 0.75mi |
| 1359 W 20th St Jacksonville, FL | 2.0 | 1.0 | 901 | $1,134 | $1.26 | 19d | 1 | 0.78mi |
Listing history 27 events
-
2026-06-21days on market $80,000 Active 128 DOM
-
2026-06-18days on market $80,000 Active 125 DOM
-
2026-06-17days on market $80,000 Active 124 DOM
-
2026-06-16days on market $80,000 Active 123 DOM
-
2026-06-15pricedays on market $80,000 Active 122 DOM
-
2026-06-10days on market $82,500 Active 116 DOM
-
2026-06-08days on market $82,500 Active 115 DOM
-
2026-06-07days on market $82,500 Active 114 DOM
-
2026-06-03days on market $82,500 Active 110 DOM
-
2026-06-02days on market $82,500 Active 109 DOM
-
2026-06-01days on market $82,500 Active 108 DOM
-
2026-05-31days on market $82,500 Active 107 DOM
-
2026-05-14price $82,500
-
2026-05-06price $85,000
-
2026-04-23price $87,500
-
2026-04-15price $90,000
-
2026-04-08price $92,500
-
2026-03-27price $94,000
-
2026-03-19price $95,000
-
2026-03-12price $97,500
-
2026-02-13$99,000 Active
-
2025-10-10soldstatus $338,200
-
2012-03-28historical 337-char remark
Show marketing remark (337 chars)
All offers must include proof of funds and binder deposit. SOLD ''as is'', seller makes no representation of warranties. Seller has no knowledge of lead paint or latent defects. Great investment opportunity. REMAX Brokerage sign is missing from front of property. Property owned by same seller, buy all three! MLS 576882, 576883, 576884
-
2011-04-12$15,000 337-char remark
Show marketing remark (337 chars)
All offers must include proof of funds and binder deposit. SOLD ''as is'', seller makes no representation of warranties. Seller has no knowledge of lead paint or latent defects. Great investment opportunity. REMAX Brokerage sign is missing from front of property. Property owned by same seller, buy all three! MLS 576882, 576883, 576884
-
2008-03-04historical 127-char remark
Show marketing remark (127 chars)
BEING SOLD AS IS. SELLER IS UNAWARE OF ANY DEFECTS, LEAD BASED PAINT OR PAINT HAZARDS ON THE PROPERTY THAT SHOULD BE DISCLOSED.
-
2008-02-15soldstatus $12,500 127-char remark
Show marketing remark (127 chars)
BEING SOLD AS IS. SELLER IS UNAWARE OF ANY DEFECTS, LEAD BASED PAINT OR PAINT HAZARDS ON THE PROPERTY THAT SHOULD BE DISCLOSED.
-
2007-11-15$17,499 127-char remark
Show marketing remark (127 chars)
BEING SOLD AS IS. SELLER IS UNAWARE OF ANY DEFECTS, LEAD BASED PAINT OR PAINT HAZARDS ON THE PROPERTY THAT SHOULD BE DISCLOSED.
ⓘ Source: listings_history table (triggers on properties + properties_extension) + one-shot
backfill from property_details.listing_events for pre-trigger history.
Tax reassessment forecast FL · Resets to sale price
- Current annual tax
- $1,593 · $133/mo
- Projected year-2 tax
- $1,593 · $133/mo
- Expected delta
- $0/yr ($0/mo · 0.0%)
ⓘ Screening estimate from a state-policy table — verify with the county assessor before closing.
Climate risk First Street
- Flood 1/10 Low FEMA zone X (unshaded) · 0% chance over 30 yrs
- Wildfire 1/10 Low
- Heat 8/10 Severe 6 d/yr ≥107°F today · 18 d/yr by 30 yrs out
- Wind 9/10 Extreme 99% chance of damaging wind over 30 yrs
- Air quality 4/10 Moderate 6 unhealthy d/yr today · 6 by 30 yrs out
Nearby sold comps map
Loading sold comps map…
Walkable amenities ~0.75 mi
Loading nearby amenities…
Taxation est. · year 1
- Rental income
- $12,759
- − Mortgage interest
- −$4,481
- − Property taxes
- −$1,593
- − Insurance
- −$400
- − Repairs & maintenance
- −$1,021
- − Management
- −$1,021
- − Depreciation
- −$2,327
- Taxable income
- $1,917
- Est. tax owed @ 24.0%
- −$460
- After-tax cash flow
- $2,593/yr
For passive investors: Depreciation is non-cash, so a rental often shows a tax loss while cash-flowing — sheltering income. Rental losses are passive: they offset passive income freely, and up to $25,000/yr can offset ordinary (W-2) income if you actively participate and your MAGI is under $100k (phasing out to $0 by $150k); unused losses carry forward. On sale, claimed depreciation is recaptured at up to 25%, and gains may owe capital-gains tax (a 1031 exchange can defer both). Figures are a year-1 estimate at your 24.0% rate — not tax advice; consult a CPA.
Schools (NCES district)
- District
- Duval
- NCES district ID
- 1200480
- Math proficiency
- 46% ▼ -11.00%
- Reading proficiency
- 45% ▼ -4.00%
- Median HH income
- $48,987
- Composite
- 38.97/100
- National rank
- #4076
- State rank
- #48 of 73 in FL
Livability — Jacksonville
- Score
- 83/100
- State rank
- #50
- US rank
- #911
Category grades
Schools grade is shown separately in the Schools card above.
Census & demographics
- Census place
- Jacksonville, FL
- County
- Duval County · 1,015,274 people
- City population
- 979,034
- Metro
- Jacksonville, FL
- Population (ZIP)
- 34,657
- Household income
- $30,514
- Rent vs Own
- Severe rent burden
- 2921.0
Population outlook (Duval County) Hauer SSP2
- Today (2025)
- 1,013,010 people
- By 2030
- 1,059,228 · +4.6%
- By 2040
- 1,141,439 · +12.7%
- By 2050
- 1,205,258 · +19.0%
- By 2075
- 1,324,282 · +30.7%
- By 2100
- 1,319,620 · +30.3%
Race, ethnicity, and origin ACS 2023
- Neighborhood character
- Predominantly Black (88%)
- Race & ethnicity
- Black 88% White 5% Hispanic / Latino 5% Two or more races 2%
- Hispanic origin (detail)
- Puerto Rican 3%
- Common ancestry
- Hispanic 1% Romanian 1%
- Foreign-born
- 3% · Canada
- Languages at home
- 95% English-only · Spanish 4% French/Haitian/Cajun 1%
Political lean MEDSL · Duval
- 2024 margin
- Toss-up / Even · D 48.7% · R 50.1% · Other 1.2%
- 2008→2024 swing
- +0.4pp no change · 2008: -1.9pp · 2024: -1.5pp
- All cycles
- 2024: R+1.5 2020: D+3.8 2016: R+1.5 2012: R+3.6 2008: R+1.9
Not yet ingested
- Civics
- —
Market trends
- HPI YoY
- ▼ -53.92%
- Current HPI
- 189.5977
- Rent YoY
- ▲ 1.81%
- Metro
- Jacksonville, FL
- State GDP YoY
- ▲ 3.28%
- F500 in state
- 36
Industry mix (Fortune 500 HQ in FL)
| Industry | F500 HQs | Revenue |
|---|---|---|
| Industrial Technology | 2 | $29B |
|
||
| Insurance | 2 | $17B |
|
||
| Retail | 1 | $60B |
|
||
| Technology Distribution | 1 | $58B |
|
||
| Homebuilding | 1 | $35B |
|
||
| Technology Manufacturing | 1 | $35B |
|
||
Price history
+371.5% since first listed15 events — show timeline
- 2026-05-14 Price Changed $82,500 realMLS
- 2026-05-06 Price Changed $85,000 realMLS
- 2026-04-23 Price Changed $87,500 realMLS
- 2026-04-15 Price Changed $90,000 realMLS
- 2026-04-08 Price Changed $92,500 realMLS
- 2026-03-27 Price Changed $94,000 realMLS
- 2026-03-19 Price Changed $95,000 realMLS
- 2026-03-12 Price Changed $97,500 realMLS
- 2026-02-13 Listed $99,000 realMLS
- 2025-10-10 Sold (Public Records) $338,200 Public Records
- 2012-03-28 Listing Removed — realMLS
- 2011-04-12 Listed $15,000 realMLS
- 2008-03-04 Listing Removed — realMLS
- 2008-02-15 Sold (MLS) $12,500 realMLS
- 2007-11-15 Listed $17,499 realMLS
Property tax history
+11.0%/yrLatest (2025): $1,593 · +20.5% YoY. Source: county tax records.
Cash-flow waterfall
monthlySold comps — $/sqft
last 12 mo · ≤1 miLoading sold comps…