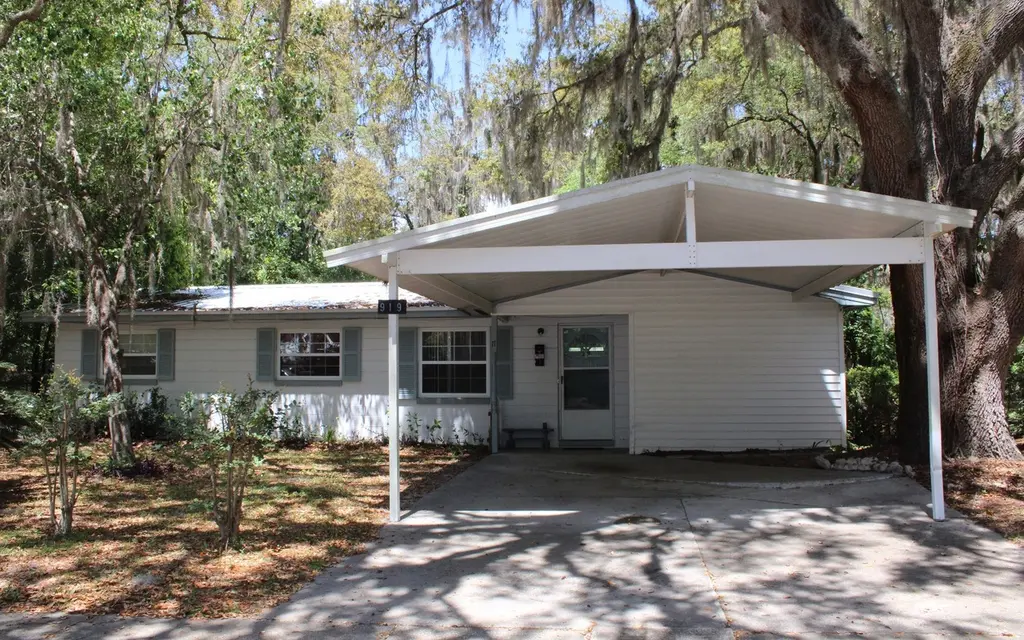
919 NW Indian Shore Dr · Lake City, FL
Flood risk 1/10 · Minimal
- FEMA flood zone
- X (unshaded)
- Chance of flooding over 30 yrs
- 0.0%
- Est. flood insurance / yr
- $507 – $1,088
Fire risk 6/10 · Moderate
- Est. fire insurance / yr
- $947 – $1,759
Heat risk 8/10 · Major
- Hot days now (above 107°F)
- 7 days/yr
- Hot days in 30 yrs
- 20 days/yr
Wind risk 9/10 · Severe
- Chance of severe wind over 30 yrs
- 99.0%
Air-quality risk 5/10 · Moderate
- Unhealthy air days now
- 9 days/yr
- Unhealthy air days in 30 yrs
- 10 days/yr
Risk factors via First Street. Map © Google.
Why this score? — see what drove the C grade
The composite is a weighted blend of 9 inputs, each scored 0–100. Each bar is that input's sub-score; the figure is the points it added to the 100-point composite (weight × sub-score).
- Cash flow +16.2/30.0
- ARV discount +12.4/15.0
- Appreciation +10.0/10.0
- DSCR +5.0/10.0
- Schools +4.5/10.0
- Livability +3.7/5.0
- 1% rule +3.2/10.0
- Rent growth +2.5/5.0
- Condition / age +2.5/5.0
$188,000
🖨 Deal sheet (PDF) 📄 Offer letter ✓ Due diligence
Listing remarks
Charming 3-bedroom 2-bathroom home located within the Lake City, City Limits. A few recent upgrades include a new water heater in 2023, new metal roof in 2022, AC unit approx. 2019, within the past year a new sliding glass door was installed, and the primary bathroom shower was remodeled. In 2014 new PVC plumbing was installed from the house to the city hookup. Spacious room off of the kitchen, can be used for a pantry or extra storage. Covered back porch overlooking the fully fenced backyard full of fruit trees. Large garage/workshop for additional storage.
Key facts
- New metal roof
- New water heater
- New pvc plumbing
Tags
Property features AI
Finance
- Other: Lot approximately 80 x 125 (about 0.229 acres); Zoning: RSF-2
Exterior
- Home design: Single-story residential home
- Construction: Block construction; Slab foundation; Metal roof; Built on one story
- Exterior features: Wood fencing; Workshop on property
Interior
- Kitchen: Dishwasher; Electric cooktop; Refrigerator
- Bedrooms: 2 bedrooms
- Flooring: Carpet; Vinyl
- Bathrooms: 2 full bathrooms
- Heating & cooling: Central heating (electric); Central air; Ceiling fan(s)
- Interior features: Ceiling fans; Central air; Central electric heating
- Laundry & utility: Washer; Dryer
Neighborhood map
What this means for you Summary
Snapshot
- This is a 3-bed/2.0-bath single-family listed at $188k.
Deal economics
- At list price, monthly cash flow is $100 ($1k/yr) — positive.
- The deal already cash-flows at list — no discount required.
- To meet the 1% rule (rent ≥ 1% of price), the offer needs to be $154k (18.3% below list).
- Recommended offer: $154k (18.3% below list) — sets the bar for 1% rule.
- Cap rate 6.9% vs local median 3.8% in Lake City — top-decile yield for the area; either an underpriced asset or a hidden risk that comps aren't pricing in. Stress-test before assuming the spread holds.
Location & tenants
- Location reads 73/100 on livability (#304 in FL) — a middle-class / working-renter tenant base. Strengths: cost of living A+, housing A+, health & safety A+; Watch: amenities C-, commute F, employment F.
- Columbia (town): math 53% / reading 54% proficiency, ranked #25 of 73 in FL (top 34%) — acceptable for families but not a draw, mixed tenant base, ~2y average lease.
- Zoned schools: Summers Elementary School (math 59% / reading 55%, grade C+, #781 of 2,144 statewide, top 38%, 517 students, 76% FRL); Columbia High School (math 28% / reading 45%, grade F, #351 of 667 statewide, top 54%, 1,737 students, 50% FRL).
- Market conditions: 144 active listings in the ZIP; 178 units permitted in Columbia County in 2024 (0 in 5+ unit buildings).
- This rent runs 30% of the median local income ($61k/yr) — at the standard rent-burdened threshold; future hikes will face affordability resistance.
Forward outlook
- In year one you build about $20k of equity ($1k loan paydown + $19k appreciation (10.0% local appreciation)).
- Columbia County population projected to shrink 7% by 2050 — rents likely to lag national; underwrite the cash flow, not the appreciation.
- At projected returns (10.0% appreciation + 3.0% rent growth), your $53k cash investment doubles in ~3 years — after that, you're playing with house money.
- By year 2, paydown + projected appreciation supports a ~$32k cash-out refi (75% LTV) — recoverable capital for the next deal without selling this one.
Negotiation context
- It's been on market 66 days — a 6% lower offer ($177k) is reasonable based on typical stale-listing flexibility.
- Current owner paid $81k; list at $188k implies a 132% gain — meaningful room to come down on a strong offer.
Risks & watch-outs
- Climate carrying-cost: severe wind risk, 99% chance of damaging wind over 30y; major wildfire risk; extreme-heat days projected 7→20/yr by 2055 (HVAC capex compounding) — expect insurance premiums to compound above CPI over the hold.
Questions for the listing agent
- It's been on market 66 days. Have you received any prior offers? Is the seller open to a 18% concession, seller financing, or rate buy-down credit?
- Built in 1963 — when were the roof, HVAC, electrical panel, plumbing, and water heater last replaced?
- Why hasn't it sold? Are there any deal-killer items the seller is aware of (foundation, flood, title, zoning, code violations)?
- Is there a deadline driving the sale (1031 exchange, divorce, estate, relocation)? That informs how much negotiation room exists.
- Schools are B-rated — typically a magnet for longer-tenancy family renters. What's the average tenant stay here, and is there a school-zone premium baked into asking?
- What's the average days-on-market for RENTAL listings here right now (not sales)? A rising rental-DOM trend means longer vacancies and softer asking-rent achievability than the comps imply.
- What's the recent tenant-quality profile in this submarket — average credit score on applications, eviction rate, late-payment / NSF rate, and stable-employment percentage? A property-management company in the area should have these aggregated.
- How much new for-sale + rental construction is in the pipeline within 1–3 miles? Heavy new supply typically softens prices + rents 12–24 months out; constrained supply supports both.
Investment metrics
- 1% rule
- 0.82% ✗
- Cap rate
- 6.93%
- Cash-on-cash
- 2.28%
- DSCR
- 1.10
- GRM
- 10.2
CMA / ARV
- ARV (on-the-fly)
- $211,071
- Comps found
- 8
Show comp detail 8 sales within ~0.75 mi
| Address | Dist | Beds/Ba | Sqft | Sold | Price | $/sf | Match |
|---|---|---|---|---|---|---|---|
| 848 NW Highlands Loop | 0.11mi | 3/2.0 | 1,256 (-4%) | 19mo | $202,500 | $161 | 72 |
| 1126 NW Ashley St | 0.16mi | 3/2.0 | 1,450 (+11%) | 4mo | $194,000 | $134 | 72 |
| 723 NW Palm Dr | 0.63mi | 3/2.0 | 1,330 (+1%) | 1mo | $234,500 | $176 | 67 |
| 664 NW Ridgewood Ave | 0.24mi | 3/2.0 | 1,400 (+7%) | 14mo | $279,900 | $200 | 66 |
| 1268 NW Ashley St | 0.09mi | 3/2.0 | 1,163 (-11%) | 14mo | $205,000 | $176 | 65 |
| 606 NW Palm Dr | 0.54mi | 3/2.0 | 1,457 (+11%) | 2mo | $207,750 | $143 | 54 |
| 343 NW Willow Ter | 0.49mi | 3/2.0 | 1,442 (+10%) | 23mo | $189,900 | $132 | 41 |
| 822 NW Springdale Gln | 0.66mi | 4/2.0 (+1) | 1,404 (+7%) | 16mo | $205,000 | $146 | 39 |
Match score weights: distance 35% · size 25% · config 20% · recency 20%. Top-matched comps best support the ARV.
Projected returns pro-forma
10.0% appreciation · 3.0% rent growth · sell at horizon
- IRR
- 25.9%
- Equity multiple
- 3.06×
- Total profit
- $108,658
- Equity at exit
- $169,365
- IRR
- 22.7%
- Equity multiple
- 6.98×
- Total profit
- $314,798
- Equity at exit
- $365,243
Cash invested: $52,640 (down + closing). Projections, not guarantees.
Landlord ↔ Tenant lean methodology
- Overall (STATE)
- 87 Strongly Landlord-Friendly
- State Florida
- 87 Strongly Landlord-Friendly · R+3
- County
- — inherits STATE
- City
- — inherits STATE
ZIP-level market 32055
- Home prices YoY
- 24.1%
- Active inventory
- 144
- Price-to-rent
- 10.2×
Monthly cashflow live
- Estimated rent
- $1,536 medium interval (Pro) →
- Mortgage (P&I)
- −$986
- Tax from tax record
- −$49 /mo · $590/yr
- Insurance
- −$78
- HOA
- −$0
- Vacancy / Maint / Mgmt
- −$323
- Net cashflow
- $100
Break-even live
Sensitivity live
| Price | -10% $206 | -5% $153 | +0% $100 | +5% $47 | +10% $-7 |
|---|---|---|---|---|---|
| Rent | -10% $-21 | -5% $39 | +0% $100 | +5% $161 | +10% $221 |
| Rate | -1.0pp $195 | -0.5pp $148 | base $100 | +0.5pp $51 | +1.0pp $2 |
UW: 25.0% down · 7.5% · 30yr · 1.5% tax · 5.0% vac · 8.0% maint · 8.0% mgmt
Financing live
Cash to close
- Down payment
- $47,000
- Closing costs
- $5,640
- Reserves months
- —
- Total cash needed
- —
Loan-product check · same deal, 3 products live
Conventional
25% down · 7.5% · 30yr
- Down + closing
- —
- Monthly P&I
- —
- Monthly cashflow
- —
- DSCR
- —
- Eligible?
- —
Personal DTI + credit; lowest rate.
DSCR
20% down · 8.5% · 30yr
- Down + closing
- —
- Monthly P&I
- —
- Monthly cashflow
- —
- DSCR
- —
- Eligible?
- —
No personal income docs; deal must DSCR.
Hard money
10% down · 12.0% · 12mo
- Down + closing
- —
- Monthly P&I
- —
- Monthly cashflow
- —
- DSCR
- —
- Eligible?
- —
Short-term bridge; refi at stabilization.
Listing history 22 events
-
2026-06-21days on market $188,000 Active 66 DOM
-
2026-06-19days on market $188,000 Active 64 DOM
-
2026-06-18days on market $188,000 Active 63 DOM
-
2026-06-17days on market $188,000 Active 62 DOM
-
2026-06-16days on market $188,000 Active 61 DOM
-
2026-06-15days on market $188,000 Active 60 DOM
-
2026-06-14days on market $188,000 Active 58 DOM
-
2026-06-12days on market $188,000 Active 57 DOM
-
2026-06-09days on market $188,000 Active 54 DOM
-
2026-06-08days on market $188,000 Active 53 DOM
-
2026-06-07days on market $188,000 Active 52 DOM
-
2026-06-05days on market $188,000 Active 49 DOM
-
2026-06-03days on market $188,000 Active 48 DOM
-
2026-06-02days on market $188,000 Active 47 DOM
-
2026-06-01days on market $188,000 Active 46 DOM
-
2026-05-31days on market $188,000 Active 45 DOM
-
2026-05-30days on market $188,000 Active 44 DOM
-
2026-05-11price $188,000
-
2026-04-16$199,900 Active
-
2004-08-30soldstatus $81,000
-
1993-08-01soldstatus $54,500
-
1991-10-01soldstatus $42,000
ⓘ Source: listings_history table (triggers on properties + properties_extension) + one-shot
backfill from property_details.listing_events for pre-trigger history.
Tax reassessment forecast FL · Resets to sale price
- Current annual tax
- $590 · $49/mo
- Projected year-2 tax
- $1,560 · $130/mo
- Expected delta
- +$970/yr (+$81/mo · 164.5%)
ⓘ Screening estimate from a state-policy table — verify with the county assessor before closing.
Climate risk First Street
- Flood 1/10 Low FEMA zone X (unshaded) · 0% chance over 30 yrs
- Wildfire 6/10 Major
- Heat 8/10 Severe 7 d/yr ≥107°F today · 20 d/yr by 30 yrs out
- Wind 9/10 Extreme 99% chance of damaging wind over 30 yrs
- Air quality 5/10 Major 9 unhealthy d/yr today · 10 by 30 yrs out
Nearby sold comps map
Loading sold comps map…
Walkable amenities ~0.75 mi
Loading nearby amenities…
Taxation est. · year 1
- Rental income
- $18,429
- − Mortgage interest
- −$10,531
- − Property taxes
- −$590
- − Insurance
- −$940
- − Repairs & maintenance
- −$1,474
- − Management
- −$1,474
- − Depreciation
- −$5,469
- Taxable loss
- −$2,050
- Est. tax savings @ 24.0%
- +$492
- After-tax cash flow
- $1,690/yr
For passive investors: Depreciation is non-cash, so a rental often shows a tax loss while cash-flowing — sheltering income. Rental losses are passive: they offset passive income freely, and up to $25,000/yr can offset ordinary (W-2) income if you actively participate and your MAGI is under $100k (phasing out to $0 by $150k); unused losses carry forward. On sale, claimed depreciation is recaptured at up to 25%, and gains may owe capital-gains tax (a 1031 exchange can defer both). Figures are a year-1 estimate at your 24.0% rate — not tax advice; consult a CPA.
Schools (NCES district)
- District
- Columbia
- NCES district ID
- 1200360
- Math proficiency
- 53% ▼ -10.00%
- Reading proficiency
- 54% ▼ -3.00%
- Median HH income
- $40,053
- Composite
- 44.74/100
- National rank
- #2750
- State rank
- #25 of 73 in FL
Livability — Lake City
- Score
- 73/100
- State rank
- #304
- US rank
- #5154
Category grades
Schools grade is shown separately in the Schools card above.
Census & demographics
- Census place
- Lake City, FL
- County
- Columbia County · 40,507 people
- City population
- 40,507
- Metro
- Lake City, FL
- Population (ZIP)
- 17,559
- Household income
- $61,111
- Rent vs Own
- Severe rent burden
- 391.0
Population outlook (Columbia County) Hauer SSP2
- Today (2025)
- 68,129 people
- By 2030
- 67,501 · -0.9%
- By 2040
- 65,465 · -3.9%
- By 2050
- 63,058 · -7.4%
- By 2075
- 56,291 · -17.4%
- By 2100
- 45,243 · -33.6%
Race, ethnicity, and origin ACS 2023
- Neighborhood character
- Majority White (61%)
- Race & ethnicity
- White 61% Black 29% Two or more races 5% Hispanic / Latino 4%
- Common ancestry
- Romanian 2% Iranian 2% Lithuanian 1%
- Foreign-born
- 3% · Canada
- Languages at home
- 96% English-only · Spanish 2%
Political lean MEDSL · Columbia
- 2024 margin
- Solid R (+50.2) · D 24.6% · R 74.7%
- 2008→2024 swing
- -16.4pp toward R · 2008: -33.8pp · 2024: -50.2pp
- All cycles
- 2024: R+50.2 2020: R+45.2 2016: R+44.5 2012: R+36.7 2008: R+33.8
Not yet ingested
- Civics
- —
Market trends
- HPI YoY
- ▲ 67.79%
- Current HPI
- 348.8923
- Rent YoY
- —
- Metro
- Lake City, FL
- State GDP YoY
- ▲ 3.28%
- F500 in state
- 36
Industry mix (Fortune 500 HQ in FL)
| Industry | F500 HQs | Revenue |
|---|---|---|
| Industrial Technology | 2 | $29B |
|
||
| Insurance | 2 | $17B |
|
||
| Retail | 1 | $60B |
|
||
| Technology Distribution | 1 | $58B |
|
||
| Homebuilding | 1 | $35B |
|
||
| Technology Manufacturing | 1 | $35B |
|
||
Price history
+347.6% since first listed5 events — show timeline
- 2026-05-11 Price Changed $188,000 NFMLS
- 2026-04-16 Listed $199,900 NFMLS
- 2004-08-30 Sold (Public Records) $81,000 Public Records
- 1993-08-01 Sold (Public Records) $54,500 Public Records
- 1991-10-01 Sold (Public Records) $42,000 Public Records
Property tax history
+1.3%/yrLatest (2025): $590 · +114.6% YoY. Source: county tax records.
Cash-flow waterfall
monthlySold comps — $/sqft
last 12 mo · ≤1 miLoading sold comps…