 Triplex
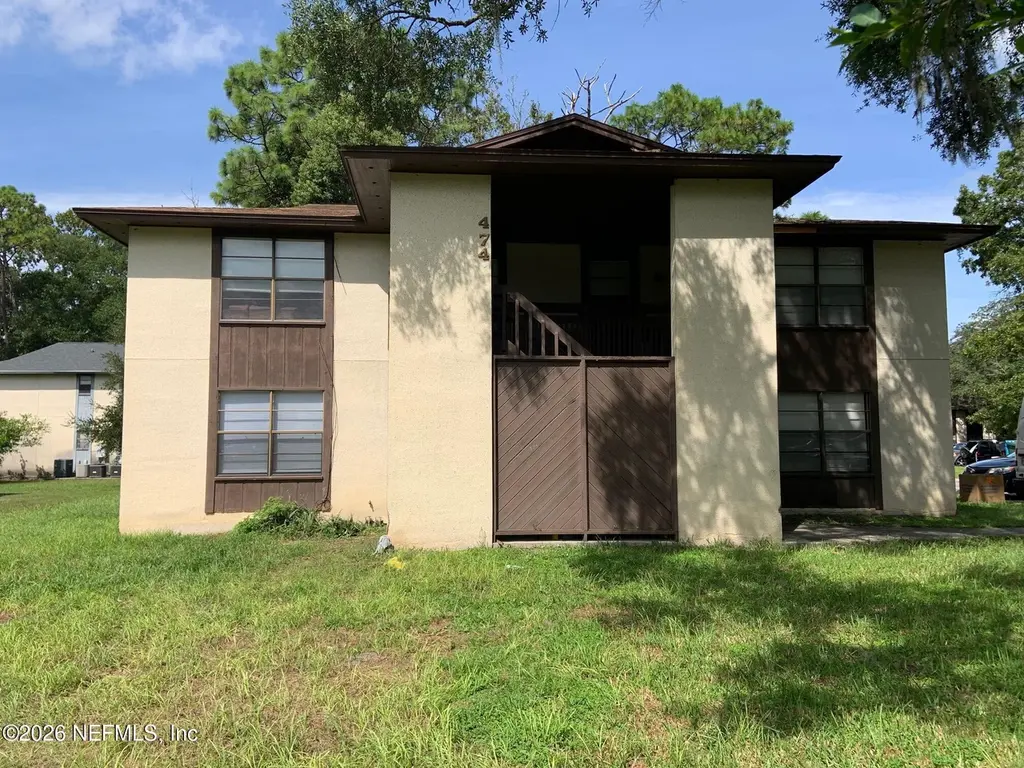
471 Lombard St · Bellair-Meadowbrook Terrace, FL
Flood risk 1/10 · Minimal
- FEMA flood zone
- X (unshaded)
- Chance of flooding over 30 yrs
- 0.0%
- Est. flood insurance / yr
- $507 – $1,088
Fire risk 4/10 · Minor
- Est. fire insurance / yr
- $947 – $1,759
Heat risk 9/10 · Severe
- Hot days now (above 107°F)
- 7 days/yr
- Hot days in 30 yrs
- 20 days/yr
Wind risk 10/10 · Severe
- Chance of severe wind over 30 yrs
- 99.0%
Air-quality risk 3/10 · Minor
- Unhealthy air days now
- 3 days/yr
- Unhealthy air days in 30 yrs
- 3 days/yr
Risk factors via First Street. Map © Google.
Why this score? — see what drove the D grade
The composite is a weighted blend of 9 inputs, each scored 0–100. Each bar is that input's sub-score; the figure is the points it added to the 100-point composite (weight × sub-score).
- Cash flow +14.2/30.0
- ARV discount +7.6/15.0
- Schools +5.1/10.0
- DSCR +4.3/10.0
- 1% rule +3.8/10.0
- Livability +2.5/5.0
- Condition / age +2.5/5.0
- Rent growth +2.3/5.0
- Appreciation +0.0/10.0
$485,000
🖨 Deal sheet (PDF) 📄 Offer letter ✓ Due diligence
Multi-family units
County records classify this as Multi-Family (2-4 Unit). Listing-text estimate: 3 units. confirmed
Listing remarks
Fully occupied, performing quad in Orange Park. This property is located in a community of individually owned quads and one of the best multifamily locations to be an owner in NE Florida. The building is well maintained with ample parking for the residents. The property is ideally located near restaurants, retail, the Orange Park Mall and the highway. Tenant occupied. DO NOT DISTURB THE TENANTS
Key facts
- Ample parking
- Well maintained
- 0.31 acre lot
Tags
Property features AI
Finance
- Financial info: Owner pays grounds care, sewer, taxes, trash collection, and water
Exterior
- Parking: Off-street parking; Parking lot
- Utilities: Public sewer; Electricity connected
- Home design: Quadruplex; Two levels; One building
- Construction: Stucco and wood siding exterior
- Exterior features: City street frontage; Asphalt road surface; Lot features: Other
Interior
- Kitchen: Dishwasher; Electric oven; Electric range; Refrigerator
- Bedrooms: Total of 8 bedrooms
- Flooring: Laminate; Tile; Wood
- Bathrooms: 4 full bathrooms; 4 half bathrooms
- Heating & cooling: Central heating; Central air conditioning
- Interior features: Multi-family investment property with four units; Two-story building
- Laundry & utility: In-unit washer hookup; In-unit electric dryer hookup
Neighborhood map
What this means for you Summary
Snapshot
- This is a 3 × 3-bed/?-bath units multifamily listed at $485k.
Deal economics
- At list price, monthly cash flow is $76 ($909/yr) — positive. Per door: $25/mo.
- The deal already cash-flows at list — no discount required.
- To meet the 1% rule (rent ≥ 1% of price), the offer needs to be $429k (11.6% below list).
- Recommended offer: $429k (11.6% below list) — sets the bar for 1% rule.
- Cap rate 6.5% vs local median 4.3% in Bellair-Meadowbrook Terrace — top-decile yield for the area; either an underpriced asset or a hidden risk that comps aren't pricing in. Stress-test before assuming the spread holds.
Location & tenants
- Location reads: area grade D — affects rentability + tenant quality, not the cash-flow math above.
- Clay (suburban): math 58% / reading 59% proficiency, ranked #14 of 73 in FL (top 19%) — acceptable for families but not a draw, mixed tenant base, ~2y average lease.
- Zoned schools: S Bryan Jennings Elementary School (math 46% / reading 44%, grade D-, #1,271 of 2,144 statewide, top 60%, 495 students, 100% FRL); Orange Park Junior High School (math 38% / reading 45%, grade F, #348 of 571 statewide, top 62%, 744 students, 100% FRL); Orange Park High School (math 30% / reading 47%, grade F, #321 of 667 statewide, top 49%, 1,810 students, 100% FRL) — zoned schools average 100% FRL vs 35% district-wide (65 pts higher); higher-poverty schools than district average — tighter screening recommended.
- Zoned-school proficiency averages 42% at this address vs 58% district-wide (-17 pts) — the specific schools serving this property underperform the Clay average; the district grade overstates school quality for this exact location.
- Market conditions: Rents soft (-0.9%/yr); 260 active listings in the ZIP; solid renter incomes; 1,876 units permitted in Clay County in 2024 (14 in 5+ unit buildings).
- At $4,287/mo this rent would consume 67% of the median local household income ($76k/yr) (locally 1544% of renters already pay >50% of income on rent) — very limited rent-growth headroom before tenants either downsize or default.
Forward outlook
- Local home prices are declining (-3.0%/yr); year-one equity from $3k of loan paydown is wiped out by about $15k of value loss. Plan a longer hold.
- Clay County population projected at +19% by 2050 — long-run rental-demand tailwind backs the buy-and-hold thesis.
Negotiation context
- It's been on market 37 days — a 3% lower offer ($470k) is reasonable based on typical stale-listing flexibility.
- 2 sale attempts since 6y ago with the ask held roughly flat each time — persistent listings suggest the price (not the market) is what's stuck; bring a comps-based counter.
- Current owner paid $335k; 45% above their basis — modest negotiation headroom, anchor on the comps not their cost.
Risks & watch-outs
- Climate carrying-cost: severe wind risk, 99% chance of damaging wind over 30y; extreme-heat days projected 7→20/yr by 2055 (HVAC capex compounding) — expect insurance premiums to compound above CPI over the hold.
Questions for the listing agent
- It's been on market 37 days. Have you received any prior offers? Is the seller open to a 12% concession, seller financing, or rate buy-down credit?
- Can we see the unit-by-unit rent roll, current vacancy, and any below-market leases? What's the average tenancy length?
- What capital expenditures (roof, boiler, parking lot, exteriors) have been made in the last 5 years, and what's planned in the next 2?
- Is there a deadline driving the sale (1031 exchange, divorce, estate, relocation)? That informs how much negotiation room exists.
- The area grade is low — what's the realistic commute time and amenity access for the typical tenant pool here? Any planned neighborhood developments (good or bad) we should know about?
- What's the average days-on-market for RENTAL listings here right now (not sales)? A rising rental-DOM trend means longer vacancies and softer asking-rent achievability than the comps imply.
- What's the recent tenant-quality profile in this submarket — average credit score on applications, eviction rate, late-payment / NSF rate, and stable-employment percentage? A property-management company in the area should have these aggregated.
- How much new apartment / multifamily construction is in the pipeline within 1–3 miles? Heavy new supply (>2% of stock underway) typically softens rents 12–24 months out; light construction supports rent growth.
Investment metrics
- 1% rule
- 0.88% ✗
- Cap rate
- 6.48%
- Cash-on-cash
- 0.67%
- DSCR
- 1.03
- GRM
- 9.4
CMA / ARV
- ARV (on-the-fly)
- $486,552
- Comps found
- 8
Show comp detail 8 sales within ~0.75 mi
| Address | Dist | Beds/Ba | Sqft | Sold | Price | $/sf | Match |
|---|---|---|---|---|---|---|---|
| 467 Bentwood Ln | 0.05mi | 8/6.0 (-1) | 3,686 (0%) | 10mo | $485,000 | $132 | 84 |
| 467 Crabapple Ct | 0.10mi | 8/6.0 (-1) | 3,686 (0%) | 8mo | $475,000 | $129 | 83 |
| 458 Bentwood Ln | 0.13mi | 8/6.0 (-1) | 3,686 (0%) | 12mo | $485,000 | $132 | 79 |
| 457 Bentwood Ln | 0.12mi | 8/— (-1) | 3,686 (0%) | 13mo | $485,000 | $132 | 78 |
| 466 Lombard St | 0.08mi | 8/6.0 (-1) | 3,686 (0%) | 18mo | $485,000 | $132 | 77 |
| 459 Bentwood Ln | 0.10mi | 8/— (-1) | 3,686 (0%) | 20mo | $485,000 | $132 | 74 |
| 475 Crabapple Ct | 0.12mi | 8/6.0 (-1) | 3,686 (0%) | 21mo | $485,000 | $132 | 72 |
| 459 Crabapple Ct | 0.14mi | 8/6.0 (-1) | 3,686 (0%) | 21mo | $475,000 | $129 | 71 |
Match score weights: distance 35% · size 25% · config 20% · recency 20%. Top-matched comps best support the ARV.
Projected returns pro-forma
-3.0% appreciation · 0.0% rent growth · sell at horizon
- IRR
- -18.6%
- Equity multiple
- 0.36×
- Total profit
- $-86,289
- Equity at exit
- $72,315
- IRR
- -18.5%
- Equity multiple
- 0.14×
- Total profit
- $-117,316
- Equity at exit
- $41,934
Cash invested: $135,800 (down + closing). Projections, not guarantees.
Landlord ↔ Tenant lean methodology
- Overall (STATE)
- 87 Strongly Landlord-Friendly
- State Florida
- 87 Strongly Landlord-Friendly · R+3
- County
- — inherits STATE
- City
- — inherits STATE
ZIP-level market 32073
- Rents YoY
- -0.9%
- Active inventory
- 260
- Price-to-rent
- 28.3×
Monthly cashflow live
- Estimated rent
- $4,287 high interval (Pro) →
- Mortgage (P&I)
- −$2,543
- Tax from tax record
- −$565 /mo · $6,786/yr
- Insurance
- −$202
- HOA
- −$0
- Vacancy / Maint / Mgmt
- −$900
- Net cashflow
- $76
Break-even live
Sensitivity live
| Price | -10% $350 | -5% $213 | +0% $76 | +5% $-61 | +10% $-199 |
|---|---|---|---|---|---|
| Rent | -10% $-263 | -5% $-94 | +0% $76 | +5% $245 | +10% $414 |
| Rate | -1.0pp $320 | -0.5pp $199 | base $76 | +0.5pp $-50 | +1.0pp $-178 |
3-unit breakdown (identical units grouped — click to expand)
| Units | Beds | Baths | Est. rent |
|---|---|---|---|
| 3× units | 3 | — | $4,287 |
| #1 | 3 | — | $1,429 |
| #2 | 3 | — | $1,429 |
| #3 | 3 | — | $1,429 |
| Total (3 units) | $4,287 | ||
UW: 25.0% down · 7.5% · 30yr · 1.5% tax · 5.0% vac · 8.0% maint · 8.0% mgmt
Financing live
Cash to close
- Down payment
- $121,250
- Closing costs
- $14,550
- Reserves months
- —
- Total cash needed
- —
Loan-product check · same deal, 3 products live
Conventional
25% down · 7.5% · 30yr
- Down + closing
- —
- Monthly P&I
- —
- Monthly cashflow
- —
- DSCR
- —
- Eligible?
- —
Personal DTI + credit; lowest rate.
DSCR
20% down · 8.5% · 30yr
- Down + closing
- —
- Monthly P&I
- —
- Monthly cashflow
- —
- DSCR
- —
- Eligible?
- —
No personal income docs; deal must DSCR.
Hard money
10% down · 12.0% · 12mo
- Down + closing
- —
- Monthly P&I
- —
- Monthly cashflow
- —
- DSCR
- —
- Eligible?
- —
Short-term bridge; refi at stabilization.
Listing history 24 events
-
2026-06-21days on market $485,000 Active 37 DOM
-
2026-06-18days on market $485,000 Active 34 DOM
-
2026-06-17days on market $485,000 Active 33 DOM
-
2026-06-16days on market $485,000 Active 32 DOM
-
2026-06-15days on market $485,000 Active 31 DOM
-
2026-06-13days on market $485,000 Active 29 DOM
-
2026-06-13days on market $485,000 Active 28 DOM
-
2026-06-09days on market $485,000 Active 25 DOM
-
2026-06-08days on market $485,000 Active 24 DOM
-
2026-06-07days on market $485,000 Active 23 DOM
-
2026-06-03days on market $485,000 Active 19 DOM
-
2026-06-02days on market $485,000 Active 18 DOM
-
2026-06-01days on market $485,000 Active 17 DOM
-
2026-05-31days on market $485,000 Active 16 DOM
-
2026-05-14$485,000 Active
-
2022-02-03price $1,000
-
2020-12-08soldstatus $335,000
-
2020-11-30soldstatus $335,000 Sold
-
2020-11-09$340,000
-
2020-11-09historical
-
2018-12-13soldstatus $240,000
-
2000-12-05soldstatus $124,000
-
1991-09-12soldstatus $85,000
-
1989-10-24soldstatus $104,252
ⓘ Source: listings_history table (triggers on properties + properties_extension) + one-shot
backfill from property_details.listing_events for pre-trigger history.
Tax reassessment forecast FL · Resets to sale price
- Current annual tax
- $6,786 · $565/mo
- Projected year-2 tax
- $6,786 · $565/mo
- Expected delta
- $0/yr ($0/mo · 0.0%)
ⓘ Screening estimate from a state-policy table — verify with the county assessor before closing.
Climate risk First Street
- Flood 1/10 Low FEMA zone X (unshaded) · 0% chance over 30 yrs
- Wildfire 4/10 Moderate
- Heat 9/10 Extreme 7 d/yr ≥107°F today · 20 d/yr by 30 yrs out
- Wind 10/10 Extreme 99% chance of damaging wind over 30 yrs
- Air quality 3/10 Moderate 3 unhealthy d/yr today · 3 by 30 yrs out
Nearby sold comps map
Loading sold comps map…
Walkable amenities ~0.75 mi
Loading nearby amenities…
Taxation est. · year 1
- Rental income
- $51,444
- − Mortgage interest
- −$27,168
- − Property taxes
- −$6,786
- − Insurance
- −$2,425
- − Repairs & maintenance
- −$4,116
- − Management
- −$4,116
- − Depreciation
- −$14,109
- Taxable loss
- −$7,274
- Est. tax savings @ 24.0%
- +$1,746
- After-tax cash flow
- $2,655/yr
For passive investors: Depreciation is non-cash, so a rental often shows a tax loss while cash-flowing — sheltering income. Rental losses are passive: they offset passive income freely, and up to $25,000/yr can offset ordinary (W-2) income if you actively participate and your MAGI is under $100k (phasing out to $0 by $150k); unused losses carry forward. On sale, claimed depreciation is recaptured at up to 25%, and gains may owe capital-gains tax (a 1031 exchange can defer both). Figures are a year-1 estimate at your 24.0% rate — not tax advice; consult a CPA.
Schools (NCES district)
- District
- Clay
- NCES district ID
- 1200300
- Math proficiency
- 58% ▼ -8.00%
- Reading proficiency
- 59% ▼ -3.00%
- Median HH income
- $59,379
- Composite
- 50.73/100
- National rank
- #1815
- State rank
- #14 of 73 in FL
Livability — Bellair-Meadowbrook Terrace
No livability data for this city. (Only ~50 U.S. cities are tracked.)
Census & demographics
- Census place
- Bellair-Meadowbrook Terrace, FL
- County
- Clay County · 208,450 people
- City population
- 42,825
- Metro
- Jacksonville, FL
- Population (ZIP)
- 43,561
- Household income
- $76,455
- Rent vs Own
- Severe rent burden
- 1544.0
Population outlook (Clay County) Hauer SSP2
- Today (2025)
- 230,495 people
- By 2030
- 242,427 · +5.2%
- By 2040
- 262,244 · +13.8%
- By 2050
- 275,148 · +19.4%
- By 2075
- 295,397 · +28.2%
- By 2100
- 287,592 · +24.8%
Race, ethnicity, and origin ACS 2023
- Neighborhood character
- Diverse neighborhood (Simpson 0.59)
- Race & ethnicity
- White 60% Black 18% Hispanic / Latino 12% Two or more races 10% Asian 5%
- Hispanic origin (detail)
- Mexican 1% Puerto Rican 5% Cuban 2%
- Common ancestry
- Slovak 4% Italian 2% Lithuanian 2%
- Foreign-born
- 7% · Canada, Vietnam, Jamaica
- Languages at home
- 88% English-only · Spanish 8% Tagalog/Filipino 1% French/Haitian/Cajun 1%
Political lean MEDSL · Clay
- 2024 margin
- Solid R (+39.3) · D 29.9% · R 69.2%
- 2008→2024 swing
- +3.6pp toward D · 2008: -42.8pp · 2024: -39.3pp
- All cycles
- 2024: R+39.3 2020: R+37.1 2016: R+44.3 2012: R+45.8 2008: R+42.8
Not yet ingested
- Civics
- —
Market trends
- HPI YoY
- ▼ -188.76%
- Current HPI
- 289.8735
- Rent YoY
- ▼ -0.87%
- Metro
- Jacksonville, FL
- State GDP YoY
- ▲ 3.28%
- F500 in state
- 36
Industry mix (Fortune 500 HQ in FL)
| Industry | F500 HQs | Revenue |
|---|---|---|
| Industrial Technology | 2 | $29B |
|
||
| Insurance | 2 | $17B |
|
||
| Retail | 1 | $60B |
|
||
| Technology Distribution | 1 | $58B |
|
||
| Homebuilding | 1 | $35B |
|
||
| Technology Manufacturing | 1 | $35B |
|
||
Price history
+365.2% since first listed10 events — show timeline
- 2026-05-14 Listed $485,000 realMLS
- 2022-02-03 Price Changed $1,000 RENT.
- 2020-12-08 Sold (Public Records) $335,000 Public Records
- 2020-11-30 Sold (MLS) $335,000 realMLS
- 2020-11-09 Listing Removed — realMLS
- 2020-11-09 Listed $340,000 realMLS
- 2018-12-13 Sold (Public Records) $240,000 Public Records
- 2000-12-05 Sold (Public Records) $124,000 Public Records
- 1991-09-12 Sold (Public Records) $85,000 Public Records
- 1989-10-24 Sold (Public Records) $104,252 Public Records
Property tax history
+12.3%/yrLatest (2025): $6,786 · +8.1% YoY. Source: county tax records.
Cash-flow waterfall
monthlySold comps — $/sqft
last 12 mo · ≤1 miLoading sold comps…