807 Irma St SE · Wilson, NC
Flood risk 1/10 · Minimal
- FEMA flood zone
- X (unshaded)
- Chance of flooding over 30 yrs
- 0.0%
- Est. flood insurance / yr
- $507 – $1,088
Fire risk 2/10 · Minimal
- Est. fire insurance / yr
- $906 – $1,684
Heat risk 7/10 · Major
- Hot days now (above 107°F)
- 7 days/yr
- Hot days in 30 yrs
- 16 days/yr
Wind risk 7/10 · Major
- Chance of severe wind over 30 yrs
- 78.0%
Air-quality risk 2/10 · Minimal
- Unhealthy air days now
- 2 days/yr
- Unhealthy air days in 30 yrs
- 2 days/yr
Risk factors via First Street. Map © Google.
Why this score? — see what drove the B grade
The composite is a weighted blend of 9 inputs, each scored 0–100. Each bar is that input's sub-score; the figure is the points it added to the 100-point composite (weight × sub-score).
- Cash flow +30.0/30.0
- 1% rule +10.0/10.0
- DSCR +10.0/10.0
- ARV discount +7.5/15.0
- Rent growth +4.3/5.0
- Schools +3.3/10.0
- Livability +3.2/5.0
- Condition / age +2.5/5.0
- Appreciation +0.0/10.0
$50,000
🖨 Deal sheet 📄 Offer letter ✓ Due diligence
Listing remarks MLS
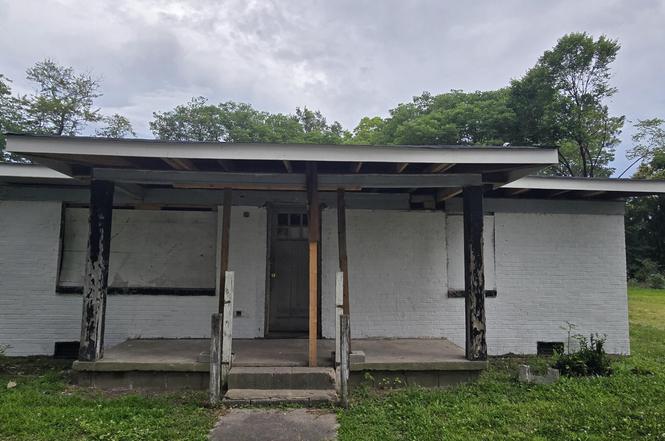
Investment opportunity! Two bedroom single family home in need of renovations is waiting for you to bring it back to life! Location is convenient to Historic Downtown Wilson, and Hwy 301/795.
Key facts
- Initial renovations
- New roof
- 5,227 sq ft lot
Tags
Property features AI
Finance
- Other: Lot size approximately 0.12 acres; Living area about 928; Located in Wilson County; public maintained road
- HOA & community: No association
Exterior
- Parking: 2 open parking spaces
- Utilities: Public water; Public sewer
- Home design: Single-story house
- Construction: Brick veneer exterior; Other foundation
- Exterior features: Shingle roof
Interior
- Bedrooms: 2 bedrooms
- Flooring: Other
- Bathrooms: 1 full bathroom
- Heating & cooling: Heating present (type: other); No central cooling
- Interior features: Crawl space basement; Other flooring
Neighborhood map
What this means for you Summary
Snapshot
- This is a 2-bed/1.0-bath single-family listed at $50k.
Deal economics
- At list price, monthly cash flow is $587 ($7k/yr) — positive.
- The deal already cash-flows at list — no discount required.
- Meets the 1% rule at list price ($1k rent vs $50k).
- Recommended offer: $44k (12.0% below list) — sets the bar for market timing.
- Cap rate 20.4% vs local median 3.4% in Wilson — top-decile yield for the area; either an underpriced asset or a hidden risk that comps aren't pricing in. Stress-test before assuming the spread holds.
Location & tenants
- Location reads 64/100 on livability (#374 in NC) — a middle-class / working-renter tenant base. Strengths: cost of living A+, housing A+, health & safety A; Watch: crime F, amenities F, commute F.
- Wilson County Schools (rural): math 38% / reading 40% proficiency, ranked #119 of 178 in NC (top 67%) — families likely to look elsewhere, expect single-tenant / working-renter base with shorter leases.
- Zoned schools: Charles H Darden Middle (math 17% / reading 25%, grade F, #424 of 475 statewide, top 90%, 441 students, 99% FRL); Beddingfield High (math 57% / reading 32%, grade F, #352 of 535 statewide, top 68%, 682 students, 98% FRL) — zoned schools average 99% FRL vs 58% district-wide (41 pts higher); higher-poverty schools than district average — tighter screening recommended.
- Market conditions: Rents rising fast (+7.0%/yr); 261 active listings in the ZIP; lower-income renter base — watch delinquency; 580 units permitted in Wilson County in 2024 (168 in 5+ unit buildings).
Forward outlook
- Local home prices are declining (-3.0%/yr); year-one equity from $346 of loan paydown is wiped out by about $2k of value loss. Plan a longer hold.
- Wilson County population projected to shrink 5% by 2050 — rents likely to lag national; underwrite the cash flow, not the appreciation.
- At projected returns (-3.0% appreciation + 7.0% rent growth), your $14k cash investment doubles in ~3 years — after that, you're playing with house money.
Negotiation context
- It's been on market 275 days — a 12% lower offer ($44k) is reasonable based on typical stale-listing flexibility.
- 4 sale attempts since 2y ago; this cycle's ask has dropped $35k (41%) from the opening price — seller is motivated, your offer sets the floor, not the list.
- Current owner paid $32k; list at $50k implies a 56% gain — meaningful room to come down on a strong offer.
Risks & watch-outs
- Watch-outs: built in 1950 — expect roof / HVAC / electrical / plumbing capex.
- Climate carrying-cost: major wind risk, 78% chance of damaging wind over 30y; extreme-heat days projected 7→16/yr by 2055 (HVAC capex compounding) — expect insurance premiums to compound above CPI over the hold.
Questions for the listing agent
- It's been on market 275 days. Have you received any prior offers? Is the seller open to a 12% concession, seller financing, or rate buy-down credit?
- Built in 1950 — when were the roof, HVAC, electrical panel, plumbing, and water heater last replaced?
- Why hasn't it sold? Are there any deal-killer items the seller is aware of (foundation, flood, title, zoning, code violations)?
- Is there a deadline driving the sale (1031 exchange, divorce, estate, relocation)? That informs how much negotiation room exists.
- Schools are F-rated, which usually means shorter tenancies and higher turnover. Who's the typical renter profile here, and what's been the actual vacancy rate?
- Crime grade is F in this area — have there been break-ins, vandalism, or insurance claims at this property in the last 3 years? What carrier currently insures it and at what premium?
- What's the average days-on-market for RENTAL listings here right now (not sales)? A rising rental-DOM trend means longer vacancies and softer asking-rent achievability than the comps imply.
- What's the recent tenant-quality profile in this submarket — average credit score on applications, eviction rate, late-payment / NSF rate, and stable-employment percentage? A property-management company in the area should have these aggregated.
- How much new for-sale + rental construction is in the pipeline within 1–3 miles? Heavy new supply typically softens prices + rents 12–24 months out; constrained supply supports both.
Investment metrics
- 1% rule
- 2.33% ✓
- Cap rate
- 20.38%
- Cash-on-cash
- 50.32%
- DSCR
- 3.24
- GRM
- 3.6
CMA / ARV
- ARV (on-the-fly)
- $141,056
- Comps found
- 12
Show comp detail 12 sales within ~0.75 mi
| Address | Dist | Beds/Ba | Sqft | Sold | Price | $/sf | Match |
|---|---|---|---|---|---|---|---|
| 304 Reid St E | 0.71mi | 2/1.0 | 915 (-1%) | 2mo | $117,000 | $128 | 63 |
| 1805 Ruffleleaf Cir | 0.54mi | 3/1.0 (+1) | 960 (+3%) | 8mo | $165,000 | $172 | 57 |
| 1845 E Trail Dr SE | 0.45mi | 2/2.0 | 888 (-4%) | 16mo | $180,750 | $204 | 54 |
| 1310 Washington St E | 0.65mi | 3/1.0 (+1) | 951 (+2%) | 8mo | $145,000 | $152 | 54 |
| 1803 Ruffleleaf Cir | 0.53mi | 3/1.0 (+1) | 960 (+3%) | 13mo | $145,000 | $151 | 54 |
| 912 Atlantic St E | 0.69mi | 2/1.0 | 869 (-6%) | 7mo | $35,000 | $40 | 51 |
| 1006 Washington St E | 0.70mi | 3/1.0 (+1) | 967 (+4%) | 7mo | $107,000 | $111 | 50 |
| 400 Minchew St SE | 0.33mi | 3/1.0 (+1) | 1,066 (+15%) | 10mo | $184,000 | $173 | 47 |
| 1319 Carolina St E | 0.73mi | 3/1.0 (+1) | 1,016 (+10%) | 1mo | $140,000 | $138 | 45 |
| 1321 Nash St E | 0.58mi | 3/1.5 (+1) | 1,040 (+12%) | 6mo | $207,000 | $199 | 40 |
| 1201 Atlantic St E | 0.64mi | 3/1.0 (+1) | 1,054 (+14%) | 7mo | $62,000 | $59 | 37 |
| 105 East St SE | 0.63mi | 3/2.0 (+1) | 1,021 (+10%) | 14mo | $175,000 | $171 | 34 |
Match score weights: distance 35% · size 25% · config 20% · recency 20%. Top-matched comps best support the ARV.
Projected returns pro-forma
-3.0% appreciation · 7.01% rent growth · sell at horizon
- IRR
- 52.5%
- Equity multiple
- 3.44×
- Total profit
- $34,177
- Equity at exit
- $7,455
- IRR
- 59.3%
- Equity multiple
- 8.12×
- Total profit
- $99,695
- Equity at exit
- $4,323
Cash invested: $14,000 (down + closing). Projections, not guarantees.
Landlord ↔ Tenant lean methodology
- Overall (STATE)
- 85 Strongly Landlord-Friendly
- State North Carolina
- 85 Strongly Landlord-Friendly · R+3
- County
- — inherits STATE
- City
- — inherits STATE
ZIP-level market 27893
- Rents YoY
- 7.0%
- Active inventory
- 261
- Price-to-rent
- 3.6×
Monthly cashflow live
- Estimated rent
- $1,163 medium interval (Pro) →
- Mortgage (P&I)
- −$262
- Tax from tax record
- −$48 /mo · $581/yr
- Insurance
- −$21
- HOA
- −$0
- Vacancy / Maint / Mgmt
- −$244
- Net cashflow
- $587
Break-even live
UW: 25.0% down · 7.5% · 30yr · 1.5% tax · 5.0% vac · 8.0% maint · 8.0% mgmt
Financing live
Cash to close
- Down payment
- $12,500
- Closing costs
- $1,500
- Reserves months
- —
- Total cash needed
- —
Loan-product check · same deal, 3 products live
Conventional
25% down · 7.5% · 30yr
- Down + closing
- —
- Monthly P&I
- —
- Monthly cashflow
- —
- DSCR
- —
- Eligible?
- —
Personal DTI + credit; lowest rate.
DSCR
20% down · 8.5% · 30yr
- Down + closing
- —
- Monthly P&I
- —
- Monthly cashflow
- —
- DSCR
- —
- Eligible?
- —
No personal income docs; deal must DSCR.
Hard money
10% down · 12.0% · 12mo
- Down + closing
- —
- Monthly P&I
- —
- Monthly cashflow
- —
- DSCR
- —
- Eligible?
- —
Short-term bridge; refi at stabilization.
Listing history 21 events
-
2026-06-15statusdays on market $50,000 Pending 275 DOM
-
2026-06-05days on market $50,000 Active 345 DOM
-
2026-06-03days on market $50,000 Active 344 DOM
-
2026-06-02days on market $50,000 Active 343 DOM
-
2026-06-01days on market $50,000 Active 342 DOM
-
2026-05-31days on market $50,000 Active 341 DOM
-
2026-05-30days on market $50,000 Active 340 DOM
-
2026-04-20price $50,000
-
2026-03-31price $59,000
-
2026-03-26status Active
-
2026-03-14status Pending
-
2026-01-22price $60,000
-
2025-08-29status Active
-
2025-08-27status Pending
-
2025-07-23price $67,000
-
2025-06-27price $70,000
-
2025-06-26price $80,000
-
2025-06-10$85,000 Active
-
2024-12-02soldstatus $32,000 Closed 193-char remark
Show marketing remark (193 chars)
Investment opportunity! Two bedroom single family home in need of renovations is waiting for you to bring it back to life! Location is convenient to Historic Downtown Wilson, and Hwy 301/795.
-
2024-11-19status Pending 193-char remark
Show marketing remark (193 chars)
Investment opportunity! Two bedroom single family home in need of renovations is waiting for you to bring it back to life! Location is convenient to Historic Downtown Wilson, and Hwy 301/795.
-
2024-11-13$30,000 Active 193-char remark
Show marketing remark (193 chars)
Investment opportunity! Two bedroom single family home in need of renovations is waiting for you to bring it back to life! Location is convenient to Historic Downtown Wilson, and Hwy 301/795.
ⓘ Source: listings_history table (triggers on properties + properties_extension) + one-shot
backfill from property_details.listing_events for pre-trigger history.
Tax reassessment forecast NC · Resets to sale price
- Current annual tax
- $581 · $48/mo
- Projected year-2 tax
- $581 · $48/mo
- Expected delta
- $0/yr ($0/mo · 0.0%)
ⓘ Screening estimate from a state-policy table — verify with the county assessor before closing.
Climate risk First Street
- Flood 1/10 Low FEMA zone X (unshaded) · 0% chance over 30 yrs
- Wildfire 2/10 Low
- Heat 7/10 Severe 7 d/yr ≥107°F today · 16 d/yr by 30 yrs out
- Wind 7/10 Severe 78% chance of damaging wind over 30 yrs
- Air quality 2/10 Low 2 unhealthy d/yr today · 2 by 30 yrs out
Nearby sold comps map
Loading sold comps map…
Walkable amenities ~0.75 mi
Loading nearby amenities…
Taxation est. · year 1
- Rental income
- $13,952
- − Mortgage interest
- −$2,801
- − Property taxes
- −$581
- − Insurance
- −$250
- − Repairs & maintenance
- −$1,116
- − Management
- −$1,116
- − Depreciation
- −$1,455
- Taxable income
- $6,633
- Est. tax owed @ 24.0%
- −$1,592
- After-tax cash flow
- $5,453/yr
For passive investors: Depreciation is non-cash, so a rental often shows a tax loss while cash-flowing — sheltering income. Rental losses are passive: they offset passive income freely, and up to $25,000/yr can offset ordinary (W-2) income if you actively participate and your MAGI is under $100k (phasing out to $0 by $150k); unused losses carry forward. On sale, claimed depreciation is recaptured at up to 25%, and gains may owe capital-gains tax (a 1031 exchange can defer both). Figures are a year-1 estimate at your 24.0% rate — not tax advice; consult a CPA.
Schools (NCES district)
- District
- Wilson County Schools
- NCES district ID
- 3705020
- Math proficiency
- 38% ▲ 2.00%
- Reading proficiency
- 40% ▼ -1.00%
- Median HH income
- $39,342
- Composite
- 32.64/100
- National rank
- #5665
- State rank
- #119 of 178 in NC
Livability — Wilson
- Score
- 64/100
- State rank
- #374
- US rank
- #14674
Category grades
Schools grade is shown separately in the Schools card above.
Census & demographics
- Census place
- Wilson, NC
- County
- Wilson County · 57,967 people
- City population
- 57,967
- Metro
- Wilson, NC
- Population (ZIP)
- 38,512
- Household income
- $42,810
- Rent vs Own
- Severe rent burden
- 2175.0
Population outlook (Wilson County) Hauer SSP2
- Today (2025)
- 82,765 people
- By 2030
- 82,492 · -0.3%
- By 2040
- 81,054 · -2.1%
- By 2050
- 78,610 · -5.0%
- By 2075
- 71,865 · -13.2%
- By 2100
- 62,792 · -24.1%
Race, ethnicity, and origin ACS 2023
- Neighborhood character
- Diverse neighborhood (Simpson 0.61)
- Race & ethnicity
- Black 55% White 27% Hispanic / Latino 16% Two or more races 5%
- Hispanic origin (detail)
- Mexican 13%
- Common ancestry
- Serbian 1% Slovak 1% Lithuanian 1%
- Foreign-born
- 6% · Canada, Jamaica
- Languages at home
- 86% English-only · Spanish 13%
Political lean MEDSL · Wilson
- 2024 margin
- Toss-up / Even · D 49.8% · R 49.4%
- 2008→2024 swing
- -5.7pp toward R · 2008: 6.1pp · 2024: 0.4pp
- All cycles
- 2024: D+0.4 2020: D+2.9 2016: D+5.6 2012: D+7.3 2008: D+6.1
Not yet ingested
- Civics
- —
Market trends
- HPI YoY
- ▼ -149.54%
- Current HPI
- 211.4136
- Rent YoY
- ▲ 7.01%
- Metro
- Wilson, NC
- State GDP YoY
- ▲ 3.28%
- F500 in state
- 26
Industry mix (Fortune 500 HQ in NC)
| Industry | F500 HQs | Revenue |
|---|---|---|
| Financial Services | 2 | $213B |
|
||
| Retail | 2 | $95B |
|
||
| Industrial Conglomerate | 1 | $38B |
|
||
| Metals / Steel | 1 | $35B |
|
||
| Utilities | 1 | $30B |
|
||
| Industrial Machinery | 1 | $19B |
|
||
Price history
+66.7% since first listed14 events — show timeline
- 2026-04-20 Price Changed $50,000 TMLS
- 2026-03-31 Price Changed $59,000 TMLS
- 2026-03-26 Relisted — TMLS
- 2026-03-14 Pending — TMLS
- 2026-01-22 Price Changed $60,000 TMLS
- 2025-08-29 Relisted — TMLS
- 2025-08-27 Pending — TMLS
- 2025-07-23 Price Changed $67,000 TMLS
- 2025-06-27 Price Changed $70,000 TMLS
- 2025-06-26 Price Changed $80,000 TMLS
- 2025-06-10 Listed $85,000 TMLS
- 2024-12-02 Sold (MLS) $32,000 Hive MLS
- 2024-11-19 Pending — Hive MLS
- 2024-11-13 Listed $30,000 Hive MLS
Property tax history
+4.4%/yrLatest (2025): $581 · +0.0% YoY. Source: county tax records.
Cash-flow waterfall
monthlySold comps — $/sqft
last 12 mo · ≤1 miLoading sold comps…