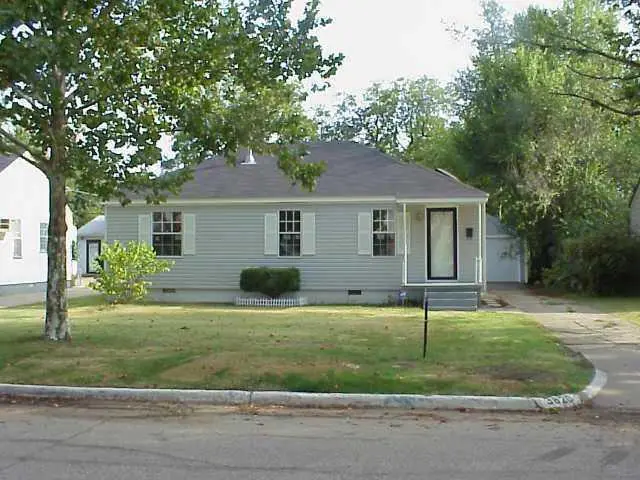
3820 NW 27th St · Oklahoma City, OK
Flood risk 1/10 · Minimal
- FEMA flood zone
- X (unshaded)
- Chance of flooding over 30 yrs
- 0.0%
- Est. flood insurance / yr
- $507 – $1,088
Fire risk 1/10 · Minimal
- Est. fire insurance / yr
- $2,463 – $4,575
Heat risk 5/10 · Moderate
- Hot days now (above 107°F)
- 7 days/yr
- Hot days in 30 yrs
- 17 days/yr
Wind risk 2/10 · Minimal
- Chance of severe wind over 30 yrs
- 3.0%
Air-quality risk 2/10 · Minimal
- Unhealthy air days now
- 1 days/yr
- Unhealthy air days in 30 yrs
- 2 days/yr
Risk factors via First Street. Map © Google.
Why this score? — see what drove the C- grade
The composite is a weighted blend of 9 inputs, each scored 0–100. Each bar is that input's sub-score; the figure is the points it added to the 100-point composite (weight × sub-score).
- Cash flow +15.8/30.0
- ARV discount +15.0/15.0
- DSCR +4.9/10.0
- Rent growth +4.3/5.0
- 1% rule +4.2/10.0
- Livability +4.0/5.0
- Condition / age +2.5/5.0
- Schools +0.7/10.0
- Appreciation +0.0/10.0
$115,000
🖨 Deal sheet (PDF) 📄 Offer letter ✓ Due diligence
Listing remarks
Charming home, this beautiful home features new roof, new electric panel, new flooring, and fresh new paint, quartz countertops, making it move-in ready! whether you're looking for the perfect starter home or an excellent long-or short term rental, this property has fantastic potential. Additional highlights include a storm shelter, a detached garage and plumbing has been updated to pex recently in most of the house. Located in heart of Oklahoma City, just minutes from all the amenities the city has to offer. Don't miss this opportunity-schedule your showing today!
Key facts
- Quartz countertops
- Fresh new paint
- New flooring
Tags
Property features AI
Finance
- Other: Living area recorded as 876 (assessor); Located in Martindale Add; Directions: From NW 23rd head north on Portland then turn west on northwest 27th St.
- Financial info: Not assumable; Buyer may qualify for a loan; Annual tax amount recorded
- HOA & community: No mandatory association dues
Exterior
- Parking: 1-car garage
- Home design: Single-family residence; One level; Existing property
- Construction: Frame construction; Shingle roof; Built (existing)
- Exterior features: Below-ground storm shelter; Lot features: Other
Interior
- Bedrooms: 2 bedrooms
- Bathrooms: 1 full bathroom
- Interior features: One living area; No fireplace; Conventional foundation
Neighborhood map
What this means for you Summary
Snapshot
- This is a 2-bed/1.0-bath single-family listed at $115k.
Deal economics
- At list price, monthly cash flow is $53 ($632/yr) — positive.
- The deal already cash-flows at list — no discount required.
- To meet the 1% rule (rent ≥ 1% of price), the offer needs to be $105k (8.4% below list).
- Recommended offer: $105k (8.4% below list) — sets the bar for 1% rule.
- Cap rate 6.8% vs local median 3.7% in Oklahoma City — top-decile yield for the area; either an underpriced asset or a hidden risk that comps aren't pricing in. Stress-test before assuming the spread holds.
Location & tenants
- Location reads 80/100 on livability (#3 in OK, #1,635 nationally) — a professional / high-income tenant draw. Strengths: amenities A+, commute A+, cost of living A+; Watch: crime F.
- Oklahoma City (urban): math 7% / reading 10% proficiency, ranked #254 of 270 in OK (top 94%) — low school quality limits family demand, transient renter base, plan for 1-2y turnover; 82% free/reduced lunch — lower-income household profile, screen leases tightly.
- Zoned schools: Kaiser Es (math 8% / reading 8%, grade F, #741 of 845 statewide, top 89%, 530 students, 0% FRL); Taft Ms (math 2% / reading 5%, grade F, #330 of 345 statewide, top 96%, 1,045 students, 0% FRL); Northwest Classen Hs (math 5% / reading 10%, grade F, #420 of 447 statewide, top 95%, 1,702 students, 0% FRL) — zoned schools average 0% FRL vs 82% district-wide (82 pts lower); this property's tenant base skews higher-income than the district average.
- Market conditions: Rents rising fast (+7.3%/yr); 221 active listings in the ZIP; 40 comparable units currently listed for rent nearby; rentals at typical pace (median 19d on market — plan ~3-4 weeks tenant-placement turnaround); 5,365 units permitted in Oklahoma County in 2024 (569 in 5+ unit buildings).
Forward outlook
- Local home prices are declining (-3.0%/yr); year-one equity from $795 of loan paydown is wiped out by about $3k of value loss. Plan a longer hold.
- Oklahoma County population projected at +41% by 2050 — long-run rental-demand tailwind backs the buy-and-hold thesis.
Negotiation context
- Only 14 days on market — expect competitive offers; lowballing is unlikely to land.
- 7 sale attempts since 22y ago; this cycle's ask is 5% above the opening price — seller raised mid-cycle; expect resistance to lowballs.
- Current owner paid $63k; list at $115k implies a 83% gain — meaningful room to come down on a strong offer.
Risks & watch-outs
- Watch-outs: built in 1943 — expect roof / HVAC / electrical / plumbing capex.
- Climate carrying-cost: extreme-heat days projected 7→17/yr by 2055 (HVAC capex compounding) — expect insurance premiums to compound above CPI over the hold.
Questions for the listing agent
- Built in 1943 — when were the roof, HVAC, electrical panel, plumbing, and water heater last replaced?
- Is there a deadline driving the sale (1031 exchange, divorce, estate, relocation)? That informs how much negotiation room exists.
- Schools are F-rated, which usually means shorter tenancies and higher turnover. Who's the typical renter profile here, and what's been the actual vacancy rate?
- Crime grade is F in this area — have there been break-ins, vandalism, or insurance claims at this property in the last 3 years? What carrier currently insures it and at what premium?
- What's the average days-on-market for RENTAL listings here right now (not sales)? A rising rental-DOM trend means longer vacancies and softer asking-rent achievability than the comps imply.
- What's the recent tenant-quality profile in this submarket — average credit score on applications, eviction rate, late-payment / NSF rate, and stable-employment percentage? A property-management company in the area should have these aggregated.
- How much new for-sale + rental construction is in the pipeline within 1–3 miles? Heavy new supply typically softens prices + rents 12–24 months out; constrained supply supports both.
Investment metrics
- 1% rule
- 0.92% ✗
- Cap rate
- 6.84%
- Cash-on-cash
- 1.96%
- DSCR
- 1.09
- GRM
- 9.1
CMA / ARV
- ARV (on-the-fly)
- $139,284
- Comps found
- 12
Show comp detail 12 sales within ~0.75 mi
| Address | Dist | Beds/Ba | Sqft | Sold | Price | $/sf | Match |
|---|---|---|---|---|---|---|---|
| 3817 NW 29th St | 0.15mi | 2/1.0 | 877 (+0%) | 3mo | $85,000 | $97 | 90 |
| 3927 NW 27th St | 0.14mi | 2/1.0 | 848 (-3%) | 4mo | $135,000 | $159 | 85 |
| 3231 Otterson Dr | 0.40mi | 2/1.0 | 871 (-1%) | 4mo | $130,000 | $149 | 76 |
| 3229 N Nesbitt Ave | 0.42mi | 2/1.0 | 871 (-1%) | 6mo | $120,000 | $138 | 75 |
| 3800 NW 32nd St | 0.48mi | 2/1.0 | 845 (-4%) | 5mo | $149,000 | $176 | 67 |
| 3847 NW 21st St | 0.35mi | 2/1.0 | 939 (+7%) | 7mo | $165,000 | $176 | 66 |
| 1709 Manor Dr | 0.71mi | 2/1.0 | 883 (+1%) | 1mo | $155,000 | $176 | 65 |
| 3025 N Utah Ave | 0.50mi | 2/1.0 | 812 (-7%) | 1mo | $70,000 | $86 | 64 |
| 4130 NW 19 St | 0.67mi | 2/1.0 | 868 (-1%) | 7mo | $153,000 | $176 | 62 |
| 1727 N Sapulpa Ave | 0.73mi | 2/1.0 | 845 (-4%) | 2mo | $99,500 | $118 | 58 |
| 3411 NW 28th St | 0.55mi | 3/1.0 (+1) | 960 (+10%) | 2mo | $142,500 | $148 | 52 |
| 3517 NW 20th St | 0.55mi | 2/1.0 | 780 (-11%) | 6mo | $125,000 | $160 | 51 |
Match score weights: distance 35% · size 25% · config 20% · recency 20%. Top-matched comps best support the ARV.
Projected returns pro-forma
-3.0% appreciation · 7.29% rent growth · sell at horizon
- IRR
- -8.5%
- Equity multiple
- 0.67×
- Total profit
- $-10,530
- Equity at exit
- $17,147
- IRR
- 5.8%
- Equity multiple
- 1.51×
- Total profit
- $16,441
- Equity at exit
- $9,943
Cash invested: $32,200 (down + closing). Projections, not guarantees.
Landlord ↔ Tenant lean methodology
- Overall (STATE)
- 83 Strongly Landlord-Friendly
- State Oklahoma
- 83 Strongly Landlord-Friendly · R+20
- County
- — inherits STATE
- City
- — inherits STATE
ZIP-level market 73107
- Rents YoY
- 7.3%
- Active inventory
- 221
- Price-to-rent
- 9.1×
Monthly cashflow live
- Estimated rent
- $1,053 high interval (Pro) →
- Mortgage (P&I)
- −$603
- Tax from tax record
- −$128 /mo · $1,540/yr
- Insurance
- −$48
- HOA
- −$0
- Vacancy / Maint / Mgmt
- −$221
- Net cashflow
- $53
Break-even live
Sensitivity live
| Price | -10% $118 | -5% $85 | +0% $53 | +5% $20 | +10% $-12 |
|---|---|---|---|---|---|
| Rent | -10% $-30 | -5% $11 | +0% $53 | +5% $94 | +10% $136 |
| Rate | -1.0pp $111 | -0.5pp $82 | base $53 | +0.5pp $23 | +1.0pp $-7 |
UW: 25.0% down · 7.5% · 30yr · 1.5% tax · 5.0% vac · 8.0% maint · 8.0% mgmt
Financing live
Cash to close
- Down payment
- $28,750
- Closing costs
- $3,450
- Reserves months
- —
- Total cash needed
- —
Loan-product check · same deal, 3 products live
Conventional
25% down · 7.5% · 30yr
- Down + closing
- —
- Monthly P&I
- —
- Monthly cashflow
- —
- DSCR
- —
- Eligible?
- —
Personal DTI + credit; lowest rate.
DSCR
20% down · 8.5% · 30yr
- Down + closing
- —
- Monthly P&I
- —
- Monthly cashflow
- —
- DSCR
- —
- Eligible?
- —
No personal income docs; deal must DSCR.
Hard money
10% down · 12.0% · 12mo
- Down + closing
- —
- Monthly P&I
- —
- Monthly cashflow
- —
- DSCR
- —
- Eligible?
- —
Short-term bridge; refi at stabilization.
Rent comps 40 comps
| Address | Beds | Baths | Sqft | Rent | $/sqft | DOM | Units | Dist |
|---|---|---|---|---|---|---|---|---|
| 3829 NW 26th St Oklahoma City, OK | 2.0 | 1.0 | 895 | $1,125 | $1.26 | 4d | 1 | 0.05mi |
| 3905 NW 23rd St Oklahoma City, OK | 2.0 | 1.5 | 1044 | $1,100 | $1.05 | 19d | 1 | 0.24mi |
| 3733 NW 22nd St Apt 210 Oklahoma City, OK | 2.0 | 1.0 | 850 | $950 | $1.12 | 45d | 1 | 0.32mi |
| 3175 N Portland Ave Oklahoma City, OK | 1.0–2.0 | 1.0–2.0 | 809 | $960 | $1.19 | 18d | 3 | 0.35mi |
| 3175 N Portland Ave Oklahoma City, OK | 2.0 | 1.0 | 865 | $899 | $1.04 | 45d | 1 | 0.35mi |
| 3175 N Portland Ave Oklahoma City, OK | 2.0 | 2.0 | 918 | $960 | $1.05 | 25d | 1 | 0.35mi |
| 3175 N Portland Ave Oklahoma City, OK | 1.0 | 1.0 | 700 | $834 | $1.19 | 16d | 1 | 0.35mi |
| 3033 N Grand Blvd Oklahoma City, OK | 1.0 | 1.0 | 672 | $675 | $1.00 | 4d | 1 | 0.41mi |
| 3912 NW 32nd St Oklahoma City, OK | 2.0 | 1.0 | 894 | $1,099 | $1.23 | 45d | 1 | 0.47mi |
| 3929 NW 32nd St Oklahoma City, OK | 3.0 | 1.0 | 1050 | $1,300 | $1.24 | 45d | 1 | 0.51mi |
| 3800 NW 19th St Oklahoma City, OK | 3.0 | 1.0 | 1073 | $1,250 | $1.16 | 25d | 1 | 0.56mi |
| 3625 NW 18th St Oklahoma City, OK | 3.0 | 2.0 | 1040 | $1,500 | $1.44 | 45d | 1 | 0.65mi |
| 3228 NW 27th St Oklahoma City, OK | 2.0 | 1.0 | 1088 | $1,195 | $1.10 | 13d | 1 | 0.75mi |
| 2626 N Meridian Ave Oklahoma City, OK | 1.0–2.0 | 1.0–2.0 | 1040 | $845 | $0.81 | 5d | 1 | 0.76mi |
| 3615 N Tulsa Ave Oklahoma City, OK | 1.0 | 1.0 | 700 | $775 | $1.11 | 45d | 1 | 0.79mi |
| 3733 NW 15th St Oklahoma City, OK | 3.0 | 1.0 | 995 | $1,150 | $1.16 | 25d | 1 | 0.81mi |
| 3608 NW 16th St Oklahoma City, OK | 2.0 | 1.0 | 784 | $950 | $1.21 | 45d | 1 | 0.83mi |
| 3403 NW 17th St Unit B Oklahoma City, OK | 1.0 | 1.0 | 572 | $1,050 | $1.84 | 45d | 1 | 0.87mi |
| 2325 N Meridian Ave Oklahoma City, OK | 2.0 | 1.0 | 800 | $850 | $1.06 | 25d | 1 | 0.88mi |
| 2325 N Meridian Ave Oklahoma City, OK | 2.0 | 1.0 | 800 | $850 | $1.06 | 13d | 1 | 0.88mi |
| 4396 NW 36th St Oklahoma City, OK | 1.0–3.0 | 1.0–2.0 | 848 | $1,044 | $1.23 | 4d | 9 | 0.89mi |
| 2317 N Meridian Ave Unit 35 Oklahoma City, OK | 2.0 | 1.0 | 800 | $850 | $1.06 | 19d | 1 | 0.90mi |
| 3141 NW 32nd St Oklahoma City, OK | 2.0 | 1.0 | 1010 | $1,025 | $1.01 | 23d | 1 | 0.94mi |
| 3109 NW 23rd St Oklahoma City, OK | 2.0 | 1.0 | 1006 | $925 | $0.92 | 45d | 1 | 0.95mi |
| 3112 Cashion Pl Oklahoma City, OK | 3.0 | 1.0 | 968 | $1,150 | $1.19 | 12d | 1 | 0.95mi |
| 3045 Pioneer St Oklahoma City, OK | 2.0 | 1.0 | 857 | $1,050 | $1.23 | 19d | 1 | 0.97mi |
| 3044 NW 28th St Oklahoma City, OK | 3.0 | 1.0 | 1030 | $1,150 | $1.12 | 4d | 1 | 0.97mi |
| 3609 NW 13th St Oklahoma City, OK | 2.0 | 1.5 | 1042 | $1,250 | $1.20 | 4d | 1 | 0.98mi |
| 3116 NW 32nd St Oklahoma City, OK | 2.0 | 1.0 | 720 | $950 | $1.32 | 6d | 1 | 0.98mi |
| 4529 NW 33rd St Oklahoma City, OK | 3.0 | 1.0 | 950 | $1,280 | $1.35 | 4d | 1 | 1.07mi |
| 3000 NW 27th St Oklahoma City, OK | 2.0 | 1.0 | 967 | $1,095 | $1.13 | 13d | 1 | 1.07mi |
| 3000 NW 27th St Oklahoma City, OK | 2.0 | 1.0 | 967 | $1,095 | $1.13 | 6d | 1 | 1.07mi |
| 2943 Pioneer Ave Unit 2943 Oklahoma City, OK | 1.0 | 1.0 | 643 | $895 | $1.39 | 5d | 1 | 1.10mi |
| 4746 NW 23rd St Oklahoma City, OK | 1.0 | 1.0 | 740 | $635 | $0.86 | 5d | 1 | 1.13mi |
| 4746 NW 23rd St Oklahoma City, OK | 2.0 | 1.0 | 975 | $815 | $0.84 | 5d | 1 | 1.13mi |
| 4746 NW 23rd St Oklahoma City, OK | 2.0 | 1.0 | 975 | $725 | $0.74 | 25d | 1 | 1.13mi |
| 2924 Pioneer St Oklahoma City, OK | 2.0 | 1.0 | 806 | $1,125 | $1.40 | 45d | 1 | 1.14mi |
| 1233 1/2 N Grand Blvd Oklahoma City, OK | 2.0 | 1.0 | 950 | $925 | $0.97 | 25d | 1 | 1.14mi |
| 3003 NW 20th St Oklahoma City, OK | 2.0 | 1.0 | 909 | $999 | $1.10 | 45d | 1 | 1.17mi |
| 4750 NW 23rd St Unit 158 Oklahoma City, OK | 2.0 | 1.0 | 975 | $785 | $0.81 | 25d | 1 | 1.18mi |
Listing history 23 events
-
2026-06-21days on market $115,000 Active 14 DOM
-
2026-06-18days on market $115,000 Active 11 DOM
-
2026-06-17days on market $115,000 Active 10 DOM
-
2026-06-16days on market $115,000 Active 9 DOM
-
2026-06-15remarks 571-char remark
-
2026-06-15pricedays on market $115,000 Active 8 DOM
-
2026-06-13statusdays on market $110,000 Active 6 DOM
-
2026-05-12status Pending
-
2026-05-08$110,000 Active
-
2025-10-09status Active
-
2025-10-08status Pending
-
2025-09-19price $125,000
-
2025-08-29$130,000 Active
-
2025-04-22historical
-
2025-04-01price $134,900
-
2025-04-01status Active
-
2025-03-05price $139,900
-
2025-02-10$144,900 Active
-
2011-07-01historical
-
2011-02-14$74,900
-
2004-12-07soldstatus $62,920
-
2004-12-03soldstatus $63,000
-
2004-09-15$59,500
ⓘ Source: listings_history table (triggers on properties + properties_extension) + one-shot
backfill from property_details.listing_events for pre-trigger history.
Tax reassessment forecast OK · Resets to sale price
- Current annual tax
- $1,540 · $128/mo
- Projected year-2 tax
- $1,540 · $128/mo
- Expected delta
- $0/yr ($0/mo · 0.0%)
ⓘ Screening estimate from a state-policy table — verify with the county assessor before closing.
Climate risk First Street
- Flood 1/10 Low FEMA zone X (unshaded) · 0% chance over 30 yrs
- Wildfire 1/10 Low
- Heat 5/10 Major 7 d/yr ≥107°F today · 17 d/yr by 30 yrs out
- Wind 2/10 Low 3% chance of damaging wind over 30 yrs
- Air quality 2/10 Low 1 unhealthy d/yr today · 2 by 30 yrs out
Nearby sold comps map
Loading sold comps map…
Walkable amenities ~0.75 mi
Loading nearby amenities…
Taxation est. · year 1
- Rental income
- $12,638
- − Mortgage interest
- −$6,442
- − Property taxes
- −$1,540
- − Insurance
- −$575
- − Repairs & maintenance
- −$1,011
- − Management
- −$1,011
- − Depreciation
- −$3,345
- Taxable loss
- −$1,286
- Est. tax savings @ 24.0%
- +$309
- After-tax cash flow
- $941/yr
For passive investors: Depreciation is non-cash, so a rental often shows a tax loss while cash-flowing — sheltering income. Rental losses are passive: they offset passive income freely, and up to $25,000/yr can offset ordinary (W-2) income if you actively participate and your MAGI is under $100k (phasing out to $0 by $150k); unused losses carry forward. On sale, claimed depreciation is recaptured at up to 25%, and gains may owe capital-gains tax (a 1031 exchange can defer both). Figures are a year-1 estimate at your 24.0% rate — not tax advice; consult a CPA.
Schools (NCES district)
- District
- Oklahoma City
- NCES district ID
- 4022770
- Math proficiency
- 7% ▼ -5.00%
- Reading proficiency
- 10% ▼ -6.00%
- Median HH income
- $35,606
- Composite
- 7.0/100
- National rank
- #9970
- State rank
- #254 of 270 in OK
Livability — Oklahoma City
- Score
- 80/100
- State rank
- #3
- US rank
- #1635
Category grades
Schools grade is shown separately in the Schools card above.
Census & demographics
- Census place
- Oklahoma City, OK
- County
- Oklahoma County · 771,644 people
- City population
- 498,656
- Metro
- Oklahoma City, OK
- Population (ZIP)
- 25,791
- Household income
- $56,873
- Rent vs Own
- Severe rent burden
- 1210.0
Population outlook (Oklahoma County) Hauer SSP2
- Today (2025)
- 911,875 people
- By 2030
- 982,413 · +7.7%
- By 2040
- 1,130,468 · +24.0%
- By 2050
- 1,288,422 · +41.3%
- By 2075
- 1,711,482 · +87.7%
- By 2100
- 2,088,448 · +129.0%
Race, ethnicity, and origin ACS 2023
- Neighborhood character
- Diverse neighborhood (Simpson 0.64)
- Race & ethnicity
- White 47% Hispanic / Latino 37% Two or more races 13% Native American 6% Black 5% Asian 2%
- Hispanic origin (detail)
- Mexican 22%
- Common ancestry
- Lithuanian 1% Italian 1% Slovak 1%
- Foreign-born
- 19% · Canada, Vietnam
- Languages at home
- 67% English-only · Spanish 30% Vietnamese 1%
Political lean MEDSL · Oklahoma
- 2024 margin
- Toss-up / Even · D 48.0% · R 49.7% · Other 2.3%
- 2008→2024 swing
- +15.1pp toward D · 2008: -16.8pp · 2024: -1.7pp
- All cycles
- 2024: R+1.7 2020: R+1.1 2016: R+10.5 2012: R+16.7 2008: R+16.8
Not yet ingested
- Civics
- —
Market trends
- HPI YoY
- ▼ -245.03%
- Current HPI
- 274.7844
- Rent YoY
- ▲ 7.29%
- Metro
- Oklahoma City, OK
- State GDP YoY
- ▲ 1.55%
- F500 in state
- 6
Industry mix (Fortune 500 HQ in OK)
| Industry | F500 HQs | Revenue |
|---|---|---|
| Energy | 3 | $48B |
|
||
Price history
+84.9% since first listed16 events — show timeline
- 2026-05-12 Pending — MLSOK
- 2026-05-08 Listed $110,000 MLSOK
- 2025-10-09 Relisted — MLSOK
- 2025-10-08 Pending — MLSOK
- 2025-09-19 Price Changed $125,000 MLSOK
- 2025-08-29 Listed $130,000 MLSOK
- 2025-04-22 Listing Removed — MLSOK
- 2025-04-01 Price Changed $134,900 MLSOK
- 2025-04-01 Relisted — MLSOK
- 2025-03-05 Price Changed $139,900 MLSOK
- 2025-02-10 Listed $144,900 MLSOK
- 2011-07-01 Listing Removed — MLSOK
- 2011-02-14 Listed $74,900 MLSOK
- 2004-12-07 Sold (MLS) $62,920 MLSOK
- 2004-12-03 Sold (Public Records) $63,000 Public Records
- 2004-09-15 Listed $59,500 MLSOK
Property tax history
+4.8%/yrLatest (2025): $1,540 · +4.2% YoY. Source: county tax records.
Cash-flow waterfall
monthlySold comps — $/sqft
last 12 mo · ≤1 miLoading sold comps…