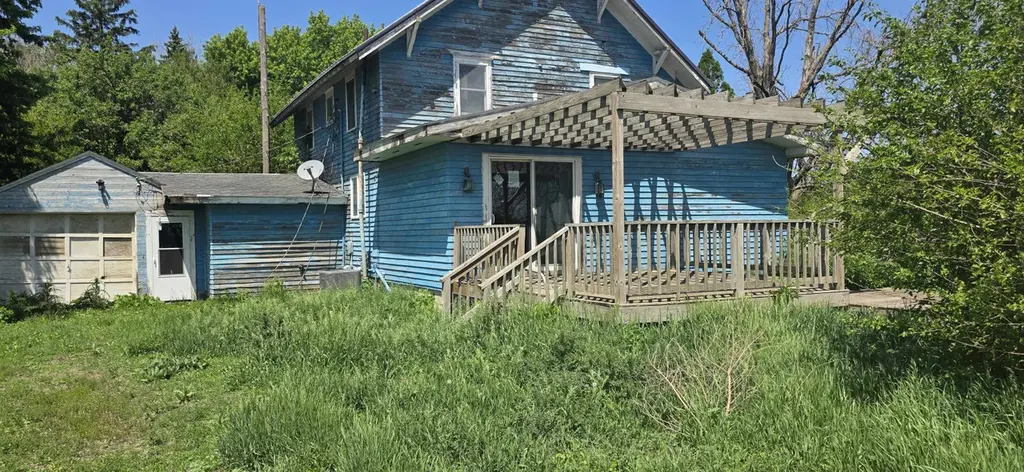
4865 320th Ave · Webb, IA
Flood risk 1/10 · Minimal
- FEMA flood zone
- X (unshaded)
- Chance of flooding over 30 yrs
- 0.0%
- Est. flood insurance / yr
- $473 – $860
Fire risk 1/10 · Minimal
- Est. fire insurance / yr
- $902 – $1,676
Heat risk 2/10 · Minimal
- Hot days now (above 101°F)
- 7 days/yr
- Hot days in 30 yrs
- 16 days/yr
Wind risk 2/10 · Minimal
- Chance of severe wind over 30 yrs
- —
Air-quality risk 1/10 · Minimal
- Unhealthy air days now
- 0 days/yr
- Unhealthy air days in 30 yrs
- 0 days/yr
Risk factors via First Street. Map © Google.
Why this score? — see what drove the B+ grade
The composite is a weighted blend of 9 inputs, each scored 0–100. Each bar is that input's sub-score; the figure is the points it added to the 100-point composite (weight × sub-score).
- Cash flow +30.0/30.0
- 1% rule +10.0/10.0
- DSCR +10.0/10.0
- Appreciation +7.6/10.0
- ARV discount +7.5/15.0
- Schools +5.9/10.0
- Livability +3.2/5.0
- Rent growth +2.5/5.0
- Condition / age +2.5/5.0
$75,050
🖨 Deal sheet 📄 Offer letter ✓ Due diligence
Listing remarks
A home where privacy is supreme. Wooded grove perfect for pets and wildlife alike. Your attention will make this house your HOME. 5 bedroom, two bath, open living room, pleasant kitchen. Seller Pays: Buyer uses Premium Title Service, the Seller's preferred title partner and closing agent. This lets the Buyer bypass the title insurance fee, related search costs and reduced escrow / settlement fees, since the Seller will cover those charges. The average charges for title search and insurance is $1225 and escrow / settlement fees is $875, resulting in an overall savings of -$1660 for buyers, who opt for Premium Title Services.
Key facts
- 2.3 acre lot
- 2 garage spots
- Built 1900
Property features AI
Exterior
- Parking: Attached gravel garage with 2 spaces
- Home design: Single-family residence; Two stories
- Construction: Wood siding; Asphalt roof
- Exterior features: Deck; Gravel road access
Interior
- Kitchen: Refrigerator
- Flooring: Hardwood
- Bathrooms: 1 full bathroom; 1 three-quarter bathroom
- Heating & cooling: Propane forced air heating
- Interior features: Eat-in kitchen; Full basement
- Laundry & utility: Washer; Dryer (main level)
Neighborhood map
What this means for you Summary
Snapshot
- This is a 4-bed/2.0-bath single-family listed at $75k.
Deal economics
- At list price, monthly cash flow is $552 ($7k/yr) — positive.
- The deal already cash-flows at list — no discount required.
- Meets the 1% rule at list price ($1k rent vs $75k).
- Recommended offer: $74k (1.5% below list) — sets the bar for market timing.
Location & tenants
- Location reads 63/100 on livability (#646 in IA) — a middle-class / working-renter tenant base. Strengths: cost of living A+, housing A+; Watch: employment C-, health & safety D, schools F.
- Sioux Central Community School District (rural): math 68% / reading 73% proficiency, ranked #143 of 289 in IA (top 50%) — strong family-tenant draw, lease renewals of 3-5y typical.
- Market conditions: 3 active listings in the ZIP; 11 units permitted in Clay County in 2024 (0 in 5+ unit buildings).
Forward outlook
- In year one you build about $4k of equity ($518 loan paydown + $4k appreciation (5.1% local appreciation)).
- Clay County population projected to shrink 6% by 2050 — rents likely to lag national; underwrite the cash flow, not the appreciation.
- At projected returns (5.1% appreciation + 3.0% rent growth), your $21k cash investment doubles in ~2 years — after that, you're playing with house money.
- By year 8, paydown + projected appreciation supports a ~$33k cash-out refi (75% LTV) — recoverable capital for the next deal without selling this one.
Negotiation context
- It's been on market 22 days — a 2% lower offer ($74k) is reasonable based on typical stale-listing flexibility.
Risks & watch-outs
- Watch-outs: built in 1900 — expect roof / HVAC / electrical / plumbing capex.
Questions for the listing agent
- Built in 1900 — when were the roof, HVAC, electrical panel, plumbing, and water heater last replaced?
- Is there a deadline driving the sale (1031 exchange, divorce, estate, relocation)? That informs how much negotiation room exists.
- Schools are F-rated, which usually means shorter tenancies and higher turnover. Who's the typical renter profile here, and what's been the actual vacancy rate?
- What's the average days-on-market for RENTAL listings here right now (not sales)? A rising rental-DOM trend means longer vacancies and softer asking-rent achievability than the comps imply.
- What's the recent tenant-quality profile in this submarket — average credit score on applications, eviction rate, late-payment / NSF rate, and stable-employment percentage? A property-management company in the area should have these aggregated.
- How much new for-sale + rental construction is in the pipeline within 1–3 miles? Heavy new supply typically softens prices + rents 12–24 months out; constrained supply supports both.
Investment metrics
- 1% rule
- 1.76% ✓
- Cap rate
- 15.12%
- Cash-on-cash
- 31.53%
- DSCR
- 2.40
- GRM
- 4.7
CMA / ARV
No comps found within radius.
Projected returns pro-forma
5.11% appreciation · 3.0% rent growth · sell at horizon
- IRR
- 40.8%
- Equity multiple
- 3.52×
- Total profit
- $52,917
- Equity at exit
- $43,012
- IRR
- 38.7%
- Equity multiple
- 7.16×
- Total profit
- $129,379
- Equity at exit
- $74,635
Cash invested: $21,014 (down + closing). Projections, not guarantees.
Landlord ↔ Tenant lean methodology
- Overall (STATE)
- 83 Strongly Landlord-Friendly
- State Iowa
- 83 Strongly Landlord-Friendly · R+6
- County
- — inherits STATE
- City
- — inherits STATE
ZIP-level market 51366
- Home prices YoY
- 4.2%
- Active inventory
- 3
- Price-to-rent
- 4.7×
Monthly cashflow live
- Estimated rent
- $1,321 medium interval (Pro) →
- Mortgage (P&I)
- −$394
- Tax from tax record
- −$66 /mo · $797/yr
- Insurance
- −$31
- HOA
- −$0
- Vacancy / Maint / Mgmt
- −$277
- Net cashflow
- $552
Break-even live
UW: 25.0% down · 7.5% · 30yr · 1.5% tax · 5.0% vac · 8.0% maint · 8.0% mgmt
Financing live
Cash to close
- Down payment
- $18,762
- Closing costs
- $2,252
- Reserves months
- —
- Total cash needed
- —
Loan-product check · same deal, 3 products live
Conventional
25% down · 7.5% · 30yr
- Down + closing
- —
- Monthly P&I
- —
- Monthly cashflow
- —
- DSCR
- —
- Eligible?
- —
Personal DTI + credit; lowest rate.
DSCR
20% down · 8.5% · 30yr
- Down + closing
- —
- Monthly P&I
- —
- Monthly cashflow
- —
- DSCR
- —
- Eligible?
- —
No personal income docs; deal must DSCR.
Hard money
10% down · 12.0% · 12mo
- Down + closing
- —
- Monthly P&I
- —
- Monthly cashflow
- —
- DSCR
- —
- Eligible?
- —
Short-term bridge; refi at stabilization.
Listing history 17 events
-
2026-06-18price $75,050 Active 22 DOM
-
2026-06-18days on market $79,000 Active 22 DOM
-
2026-06-17days on market $79,000 Active 21 DOM
-
2026-06-16days on market $79,000 Active 20 DOM
-
2026-06-15days on market $79,000 Active 19 DOM
-
2026-06-13days on market $79,000 Active 17 DOM
-
2026-06-12days on market $79,000 Active 16 DOM
-
2026-06-09days on market $79,000 Active 13 DOM
-
2026-06-08days on market $79,000 Active 12 DOM
-
2026-06-07days on market $79,000 Active 11 DOM
-
2026-06-07days on market $79,000 Active 10 DOM
-
2026-06-04days on market $79,000 Active 7 DOM
-
2026-06-02days on market $79,000 Active 6 DOM
-
2026-06-01days on market $79,000 Active 5 DOM
-
2026-05-31days on market $79,000 Active 4 DOM
-
2026-05-31days on market $79,000 Active 3 DOM
-
2026-05-27$79,000 Active
ⓘ Source: listings_history table (triggers on properties + properties_extension) + one-shot
backfill from property_details.listing_events for pre-trigger history.
Tax reassessment forecast IA · Partial reset (capped growth)
- Current annual tax
- $797 · $66/mo
- Projected year-2 tax
- $988 · $82/mo
- Expected delta
- +$191/yr (+$16/mo · 23.9%)
ⓘ Screening estimate from a state-policy table — verify with the county assessor before closing.
Climate risk First Street
- Flood 1/10 Low FEMA zone X (unshaded) · 0% chance over 30 yrs
- Wildfire 1/10 Low
- Heat 2/10 Low 7 d/yr ≥101°F today · 16 d/yr by 30 yrs out
- Wind 2/10 Low
- Air quality 1/10 Low 0 unhealthy d/yr today · 0 by 30 yrs out
Nearby sold comps map
Loading sold comps map…
Walkable amenities ~0.75 mi
Loading nearby amenities…
Taxation est. · year 1
- Rental income
- $15,848
- − Mortgage interest
- −$4,204
- − Property taxes
- −$797
- − Insurance
- −$375
- − Repairs & maintenance
- −$1,268
- − Management
- −$1,268
- − Depreciation
- −$2,183
- Taxable income
- $5,753
- Est. tax owed @ 24.0%
- −$1,381
- After-tax cash flow
- $5,244/yr
For passive investors: Depreciation is non-cash, so a rental often shows a tax loss while cash-flowing — sheltering income. Rental losses are passive: they offset passive income freely, and up to $25,000/yr can offset ordinary (W-2) income if you actively participate and your MAGI is under $100k (phasing out to $0 by $150k); unused losses carry forward. On sale, claimed depreciation is recaptured at up to 25%, and gains may owe capital-gains tax (a 1031 exchange can defer both). Figures are a year-1 estimate at your 24.0% rate — not tax advice; consult a CPA.
Schools (NCES district)
- District
- Sioux Central Community School District
- NCES district ID
- 1900023
- Math proficiency
- 68% ▼ -4.00%
- Reading proficiency
- 73% ▼ -3.00%
- Median HH income
- $47,122
- Composite
- 59.49/100
- National rank
- #922
- State rank
- #143 of 289 in IA
Livability — Webb
- Score
- 63/100
- State rank
- #646
- US rank
- #14892
Category grades
Schools grade is shown separately in the Schools card above.
Census & demographics
- Population (ZIP)
- 335
Population outlook (Clay County) Hauer SSP2
- Today (2025)
- 16,277 people
- By 2030
- 16,073 · -1.3%
- By 2040
- 15,638 · -3.9%
- By 2050
- 15,315 · -5.9%
- By 2075
- 15,026 · -7.7%
- By 2100
- 14,638 · -10.1%
Race, ethnicity, and origin ACS 2023
- Neighborhood character
- Predominantly White (99%)
- Race & ethnicity
- White 99%
- Common ancestry
- Iranian 8% Scottish 7% Portuguese 5%
- Languages at home
- 99% English-only · German/W. Germanic 1%
Political lean MEDSL · Clay
- 2024 margin
- Solid R (+43.2) · D 27.8% · R 71.0% · Other 1.2%
- 2008→2024 swing
- -38.1pp toward R · 2008: -5.1pp · 2024: -43.2pp
- All cycles
- 2024: R+43.2 2020: R+38.7 2016: R+42.4 2012: R+18.7 2008: R+5.1
Not yet ingested
- Civics
- —
Market trends
- HPI YoY
- ▲ 5.11%
- Current HPI
- 126.2555
- Rent YoY
- —
- Metro
- —
- State GDP YoY
- ▲ 2.48%
- F500 in state
- 4
Industry mix (Fortune 500 HQ in IA)
| Industry | F500 HQs | Revenue |
|---|---|---|
| Financial Services | 1 | $16B |
|
||
| Retail / Convenience | 1 | $15B |
|
||
Price history
1 event — show timeline
- 2026-05-27 Listed $79,000 Iowa Great Lakes BOR
Property tax history
+1.4%/yrLatest (2025): $797 · -5.3% YoY. Source: county tax records.
Cash-flow waterfall
monthlySold comps — $/sqft
last 12 mo · ≤1 miLoading sold comps…