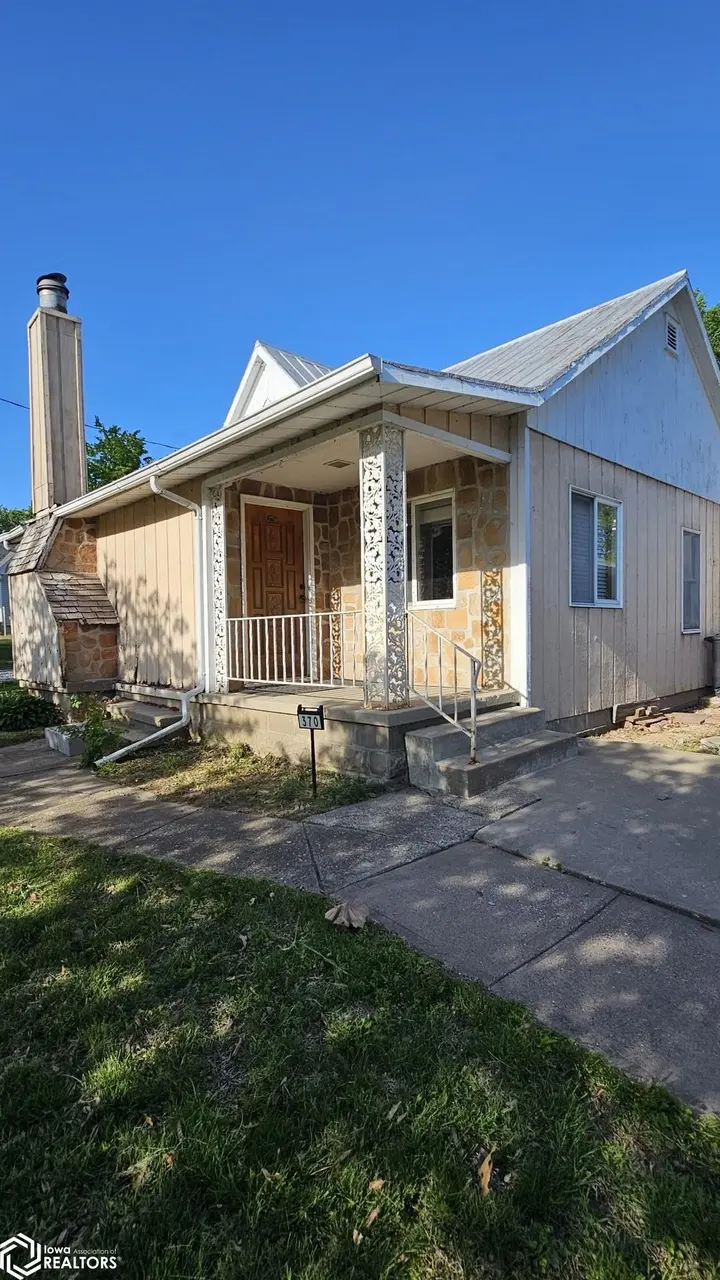
370 N Page St · Nauvoo, IL
Flood risk 1/10 · Minimal
- FEMA flood zone
- X (unshaded)
- Chance of flooding over 30 yrs
- 0.0%
- Est. flood insurance / yr
- $473 – $860
Fire risk 1/10 · Minimal
- Est. fire insurance / yr
- $804 – $1,492
Heat risk 3/10 · Minor
- Hot days now (above 107°F)
- 7 days/yr
- Hot days in 30 yrs
- 16 days/yr
Wind risk 2/10 · Minimal
- Chance of severe wind over 30 yrs
- —
Air-quality risk 2/10 · Minimal
- Unhealthy air days now
- 0 days/yr
- Unhealthy air days in 30 yrs
- 1 days/yr
Risk factors via First Street. Map © Google.
Why this score? — see what drove the B- grade
The composite is a weighted blend of 9 inputs, each scored 0–100. Each bar is that input's sub-score; the figure is the points it added to the 100-point composite (weight × sub-score).
- Cash flow +22.7/30.0
- ARV discount +15.0/15.0
- DSCR +7.3/10.0
- Appreciation +7.3/10.0
- 1% rule +6.8/10.0
- Livability +3.7/5.0
- Rent growth +2.5/5.0
- Condition / age +2.5/5.0
- Schools +2.0/10.0
$79,000
🖨 Deal sheet (PDF) 📄 Offer letter ✓ Due diligence
Listing remarks
Enjoy sunrise and sunset views from this 2-bedroom, 1-bath single-family home on approximately 0.6 surveyed acres in a quiet Nauvoo neighborhood with southwestern views of the Nauvoo bluffs. Located just blocks from downtown, the property offers multiple possibilities, including renovation of the existing structure, expansion, or new construction. A 26' x 40' extra-deep drive-through garage features three new insulated overhead doors and a new mini-split system for heating and cooling. Outdoor improvements include a 20' x 26' x 6" concrete patio installed in 2024, located behind the garage. The rear of the property is accessible via a secondary driveway on the north side. The electrica
Key facts
- Southwestern views
- Concrete patio
- 0.6 acre lot
Tags
Property features AI
Finance
- Other: Lot approximately 0.6 acres (dimensions 174 x 120 x 174 x 120); Public maintained road with city street frontage
Exterior
- Parking: Detached gravel garage with 2 car spaces
- Utilities: Public water; Public sewer; 200+ amp electric service with circuit breakers
- Home design: Single-family residence; Residential zoning
- Construction: Frame construction with wood siding; Foundation area 1,008; Built and measured above-grade finished area 1,008
- Exterior features: Rubber and metal roof
Interior
- Kitchen: Range, Microwave, Dishwasher, Refrigerator
- Bathrooms: One three-quarter bathroom
- Heating & cooling: Forced air heating; Ductless heating; Central air conditioning; Ductless cooling
- Interior features: Range, Microwave, Dishwasher, Refrigerator; Electric water heater; Basement
- Laundry & utility: Washer and Dryer
Neighborhood map
What this means for you Summary
Snapshot
- This is a 2-bed/1.0-bath single-family listed at $79k.
Deal economics
- At list price, monthly cash flow is $136 ($2k/yr) — positive.
- The deal already cash-flows at list — no discount required.
- Meets the 1% rule at list price ($935 rent vs $79k).
- Recommended offer: $77k (3.0% below list) — sets the bar for market timing.
Location & tenants
- Location reads 74/100 on livability (#254 in IL, #4,683 nationally) — a middle-class / working-renter tenant base. Strengths: cost of living A+, housing A+, health & safety A+; Watch: amenities F, commute F.
- Nauvoo-Colusa CUSD 325 (rural): math 15% / reading 25% proficiency, ranked #713 of 919 in IL (top 78%) — low school quality limits family demand, transient renter base, plan for 1-2y turnover.
- Zoned schools: Nauvoo Elem School (math 12% / reading 32%, grade F, #940 of 2,056 statewide, top 49%, 203 students, 0% FRL) — zoned schools average 0% FRL vs 40% district-wide (40 pts lower); this property's tenant base skews higher-income than the district average.
- Market conditions: 26 active listings in the ZIP.
Forward outlook
- In year one you build about $4k of equity ($546 loan paydown + $4k appreciation (4.5% local appreciation)).
- Hancock County population projected at -30% by 2050 — secular population decline; favor cash flow + early exit over multi-decade hold.
- At projected returns (4.5% appreciation + 3.0% rent growth), your $22k cash investment doubles in ~4 years — after that, you're playing with house money.
- By year 8, paydown + projected appreciation supports a ~$31k cash-out refi (75% LTV) — recoverable capital for the next deal without selling this one.
Negotiation context
- It's been on market 41 days — a 3% lower offer ($77k) is reasonable based on typical stale-listing flexibility.
- 3 sale attempts since 10y ago; this cycle's ask has dropped $20k (20%) from the opening price — seller is motivated, your offer sets the floor, not the list.
- Current owner paid $30k; list at $79k implies a 163% gain — meaningful room to come down on a strong offer.
Risks & watch-outs
- Watch-outs: built in 1900 — expect roof / HVAC / electrical / plumbing capex.
Questions for the listing agent
- It's been on market 41 days. Have you received any prior offers? Is the seller open to a 3% concession, seller financing, or rate buy-down credit?
- Built in 1900 — when were the roof, HVAC, electrical panel, plumbing, and water heater last replaced?
- Is there a deadline driving the sale (1031 exchange, divorce, estate, relocation)? That informs how much negotiation room exists.
- Schools are F-rated, which usually means shorter tenancies and higher turnover. Who's the typical renter profile here, and what's been the actual vacancy rate?
- What's the average days-on-market for RENTAL listings here right now (not sales)? A rising rental-DOM trend means longer vacancies and softer asking-rent achievability than the comps imply.
- What's the recent tenant-quality profile in this submarket — average credit score on applications, eviction rate, late-payment / NSF rate, and stable-employment percentage? A property-management company in the area should have these aggregated.
- How much new for-sale + rental construction is in the pipeline within 1–3 miles? Heavy new supply typically softens prices + rents 12–24 months out; constrained supply supports both.
Investment metrics
- 1% rule
- 1.18% ✓
- Cap rate
- 8.35%
- Cash-on-cash
- 7.35%
- DSCR
- 1.33
- GRM
- 7.0
CMA / ARV
- ARV (median comp)
- $106,729
- List price
- $79,000
- Delta
- -25.98%
- Verdict
- UNDERPRICED
- Comps
- 13 within 1.0 mi
Show comp detail 2 sales within ~0.75 mi
| Address | Dist | Beds/Ba | Sqft | Sold | Price | $/sf | Match |
|---|---|---|---|---|---|---|---|
| 165 S Wilcox St | 0.41mi | 2/1.0 | 988 (-2%) | 22mo | $85,000 | $86 | 59 |
| 415 S Fulmer St | 0.66mi | 3/1.0 (+1) | 1,040 (+3%) | 20mo | $100,000 | $96 | 42 |
Match score weights: distance 35% · size 25% · config 20% · recency 20%. Top-matched comps best support the ARV.
Projected returns pro-forma
4.55% appreciation · 3.0% rent growth · sell at horizon
- IRR
- 18.2%
- Equity multiple
- 2.13×
- Total profit
- $24,893
- Equity at exit
- $42,644
- IRR
- 18.5%
- Equity multiple
- 4.11×
- Total profit
- $68,891
- Equity at exit
- $71,899
Cash invested: $22,120 (down + closing). Projections, not guarantees.
Landlord ↔ Tenant lean methodology
- Overall (STATE)
- 43 Moderately Tenant-Leaning
- State Illinois
- 43 Moderately Tenant-Leaning · D+7
- County
- — inherits STATE
- City
- — inherits STATE
ZIP-level market 62354
- Home prices YoY
- 3.9%
- Active inventory
- 26
- Price-to-rent
- 7.0×
Monthly cashflow live
- Estimated rent
- $935 medium interval (Pro) →
- Mortgage (P&I)
- −$414
- Tax from tax record
- −$156 /mo · $1,867/yr
- Insurance
- −$33
- HOA
- −$0
- Vacancy / Maint / Mgmt
- −$196
- Net cashflow
- $136
Break-even live
Sensitivity live
| Price | -10% $180 | -5% $158 | +0% $136 | +5% $113 | +10% $91 |
|---|---|---|---|---|---|
| Rent | -10% $62 | -5% $99 | +0% $136 | +5% $172 | +10% $209 |
| Rate | -1.0pp $175 | -0.5pp $156 | base $136 | +0.5pp $115 | +1.0pp $94 |
UW: 25.0% down · 7.5% · 30yr · 1.5% tax · 5.0% vac · 8.0% maint · 8.0% mgmt
Financing live
Cash to close
- Down payment
- $19,750
- Closing costs
- $2,370
- Reserves months
- —
- Total cash needed
- —
Loan-product check · same deal, 3 products live
Conventional
25% down · 7.5% · 30yr
- Down + closing
- —
- Monthly P&I
- —
- Monthly cashflow
- —
- DSCR
- —
- Eligible?
- —
Personal DTI + credit; lowest rate.
DSCR
20% down · 8.5% · 30yr
- Down + closing
- —
- Monthly P&I
- —
- Monthly cashflow
- —
- DSCR
- —
- Eligible?
- —
No personal income docs; deal must DSCR.
Hard money
10% down · 12.0% · 12mo
- Down + closing
- —
- Monthly P&I
- —
- Monthly cashflow
- —
- DSCR
- —
- Eligible?
- —
Short-term bridge; refi at stabilization.
Listing history 21 events
-
2026-06-21days on market $79,000 Active 41 DOM
-
2026-06-21days on market $79,000 Active 40 DOM
-
2026-06-18days on market $79,000 Active 38 DOM
-
2026-06-17days on market $79,000 Active 37 DOM
-
2026-06-16days on market $79,000 Active 36 DOM
-
2026-06-15days on market $79,000 Active 35 DOM
-
2026-06-13days on market $79,000 Active 33 DOM
-
2026-06-12days on market $79,000 Active 32 DOM
-
2026-06-09days on market $79,000 Active 29 DOM
-
2026-06-08days on market $79,000 Active 28 DOM
-
2026-06-07days on market $79,000 Active 27 DOM
-
2026-06-07days on market $79,000 Active 26 DOM
-
2026-06-04days on market $79,000 Active 23 DOM
-
2026-06-02days on market $79,000 Active 22 DOM
-
2026-06-01days on market $79,000 Active 21 DOM
-
2026-05-31days on market $79,000 Active 20 DOM
-
2026-05-31days on market $79,000 Active 19 DOM
-
2026-05-10$99,000 Active 1101-char remark
-
2023-12-27soldstatus $30,000
-
2017-04-07$45,000
-
2016-07-05$90,000
ⓘ Source: listings_history table (triggers on properties + properties_extension) + one-shot
backfill from property_details.listing_events for pre-trigger history.
Tax reassessment forecast IL · Partial reset (capped growth)
- Current annual tax
- $1,867 · $156/mo
- Projected year-2 tax
- $1,867 · $156/mo
- Expected delta
- $0/yr ($0/mo · 0.0%)
ⓘ Screening estimate from a state-policy table — verify with the county assessor before closing.
Climate risk First Street
- Flood 1/10 Low FEMA zone X (unshaded) · 0% chance over 30 yrs
- Wildfire 1/10 Low
- Heat 3/10 Moderate 7 d/yr ≥107°F today · 16 d/yr by 30 yrs out
- Wind 2/10 Low
- Air quality 2/10 Low 0 unhealthy d/yr today · 1 by 30 yrs out
Nearby sold comps map
Loading sold comps map…
Walkable amenities ~0.75 mi
Loading nearby amenities…
Taxation est. · year 1
- Rental income
- $11,215
- − Mortgage interest
- −$4,425
- − Property taxes
- −$1,867
- − Insurance
- −$395
- − Repairs & maintenance
- −$897
- − Management
- −$897
- − Depreciation
- −$2,298
- Taxable income
- $435
- Est. tax owed @ 24.0%
- −$104
- After-tax cash flow
- $1,522/yr
For passive investors: Depreciation is non-cash, so a rental often shows a tax loss while cash-flowing — sheltering income. Rental losses are passive: they offset passive income freely, and up to $25,000/yr can offset ordinary (W-2) income if you actively participate and your MAGI is under $100k (phasing out to $0 by $150k); unused losses carry forward. On sale, claimed depreciation is recaptured at up to 25%, and gains may owe capital-gains tax (a 1031 exchange can defer both). Figures are a year-1 estimate at your 24.0% rate — not tax advice; consult a CPA.
Schools (NCES district)
- District
- Nauvoo-Colusa CUSD 325
- NCES district ID
- 1727780
- Math proficiency
- 15% ▲ 5.00%
- Reading proficiency
- 25% ▼ -10.00%
- Median HH income
- $43,211
- Composite
- 20.49/100
- National rank
- #13779
- State rank
- #713 of 919 in IL
Livability — Nauvoo
- Score
- 74/100
- State rank
- #254
- US rank
- #4683
Category grades
Schools grade is shown separately in the Schools card above.
Census & demographics
- Census place
- Nauvoo, IL
- Population (ZIP)
- 1,426
Population outlook (Hancock County) Hauer SSP2
- Today (2025)
- 17,042 people
- By 2030
- 16,056 · -5.8%
- By 2040
- 13,912 · -18.4%
- By 2050
- 11,879 · -30.3%
- By 2075
- 8,302 · -51.3%
- By 2100
- 5,846 · -65.7%
Race, ethnicity, and origin ACS 2023
- Neighborhood character
- Predominantly White (96%)
- Race & ethnicity
- White 96% Asian 1%
- Common ancestry
- Lithuanian 5% Slovak 4% Portuguese 1%
- Foreign-born
- 1% · Vietnam
- Languages at home
- 98% English-only · German/W. Germanic 1% Vietnamese 1%
Political lean MEDSL · Hancock
- 2024 margin
- Solid R (+50.0) · D 24.1% · R 74.1% · Other 1.8%
- 2008→2024 swing
- -39.2pp toward R · 2008: -10.8pp · 2024: -50.0pp
- All cycles
- 2024: R+50.0 2020: R+48.9 2016: R+50.8 2012: R+19.0 2008: R+10.8
Not yet ingested
- Civics
- —
Market trends
- HPI YoY
- ▲ 4.55%
- Current HPI
- 120.8838
- Rent YoY
- —
- Metro
- —
- State GDP YoY
- ▲ 1.59%
- F500 in state
- 60
Industry mix (Fortune 500 HQ in IL)
| Industry | F500 HQs | Revenue |
|---|---|---|
| Insurance | 4 | $201B |
|
||
| Consumer Goods | 4 | $87B |
|
||
| Industrial Machinery | 3 | $64B |
|
||
| Healthcare | 2 | $55B |
|
||
| Retail / Pharmacy | 1 | $148B |
|
||
| Agriculture / Food | 1 | $86B |
|
||
Price history
-12.2% since first listed5 events — show timeline
- 2026-05-27 Price Changed $79,000 IAR
- 2026-05-10 Listed $99,000 IAR
- 2023-12-27 Sold (Public Records) $30,000 Public Records
- 2017-04-07 Listed $45,000 IAR
- 2016-07-05 Listed $90,000 IAR
Property tax history
-1.4%/yrLatest (2024): $1,867 · -11.5% YoY. Source: county tax records.
Cash-flow waterfall
monthlySold comps — $/sqft
last 12 mo · ≤1 miLoading sold comps…