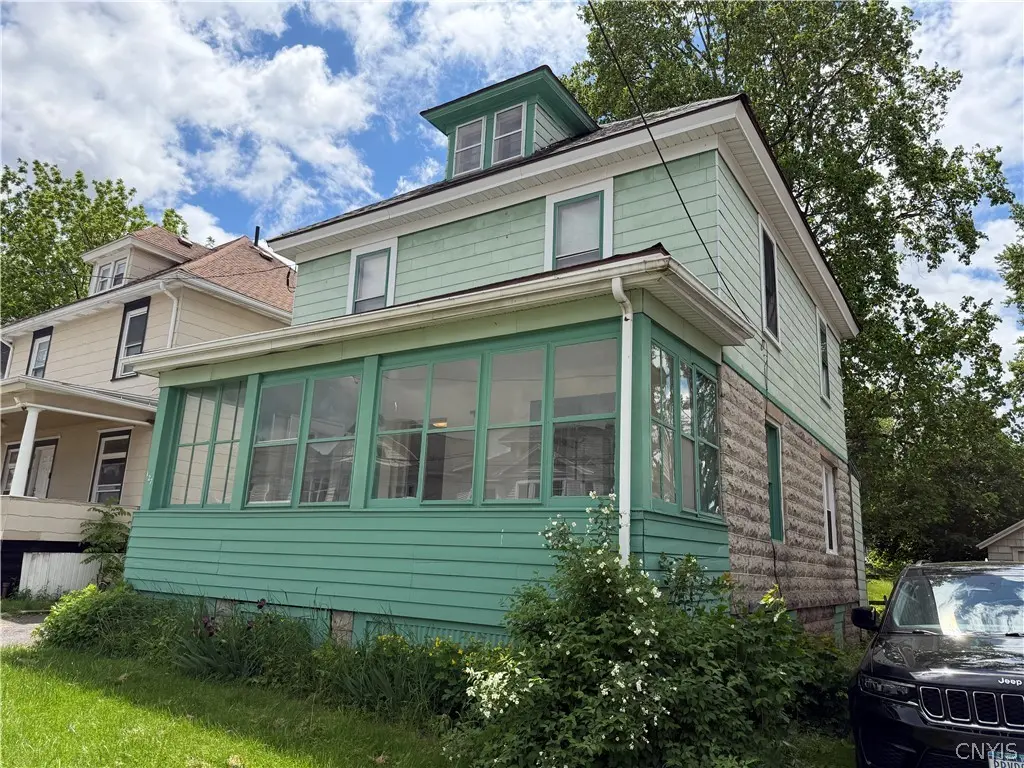
127 Burdick Ave · Syracuse, NY
Flood risk 1/10 · Minimal
- FEMA flood zone
- X (unshaded)
- Chance of flooding over 30 yrs
- 0.0%
- Est. flood insurance / yr
- $473 – $860
Fire risk 1/10 · Minimal
- Est. fire insurance / yr
- $691 – $1,283
Heat risk 3/10 · Minor
- Hot days now (above 95°F)
- 7 days/yr
- Hot days in 30 yrs
- 15 days/yr
Wind risk 1/10 · Minimal
- Chance of severe wind over 30 yrs
- 0.0%
Air-quality risk 2/10 · Minimal
- Unhealthy air days now
- 0 days/yr
- Unhealthy air days in 30 yrs
- 1 days/yr
Risk factors via First Street. Map © Google.
Why this score? — see what drove the C+ grade
The composite is a weighted blend of 9 inputs, each scored 0–100. Each bar is that input's sub-score; the figure is the points it added to the 100-point composite (weight × sub-score).
- Cash flow +24.5/30.0
- Appreciation +10.0/10.0
- DSCR +7.9/10.0
- ARV discount +6.0/15.0
- 1% rule +5.5/10.0
- Livability +3.9/5.0
- Rent growth +2.5/5.0
- Condition / age +2.5/5.0
- Schools +1.8/10.0
$159,900
🖨 Deal sheet 📄 Offer letter ✓ Due diligence
Listing remarks
Northside home available now with 4 bedrooms and 1 bath. Nice enclosed front porch, Large fenced in rear yard and off-street parking. Inside has hardwoods on the first-floor entry and Livingroom. Large eat in kitchen was a built-in bench and plenty of cabinets with a walk-in pantry. Four good sized bedrooms are on the second floor with the refreshed bathroom. The space continues with a walk-up attic. Come take a look at this affordable situation.
Key facts
- Eat in kitchen
- Fenced in rear yard
- Off-street parking
Tags
Property features AI
Exterior
- Parking: Driveway (no garage)
- Utilities: Public water (connected); Sewer connected; Cable available; Electric with circuit breakers
- Home design: Two-story house; Existing/resale property
- Construction: Cedar and stone exterior with copper plumbing noted; Asphalt shingle roof; Stone foundation; Built previously (existing)
- Exterior features: Blacktop driveway; Fully fenced yard; Patio; Irregular residential lot; City street frontage; Lot dimensions approximately 39 x 146
Interior
- Kitchen: Free-standing range; Gas cooktop; Gas oven; Gas range; Oven; Refrigerator
- Bedrooms: Total rooms: 8 (includes living spaces)
- Flooring: Carpet; Hardwood; Varies
- Bathrooms: 1 full bathroom
- Heating & cooling: Gas forced-air heating
- Interior features: Separate/formal dining room; Separate/formal living room; Full basement
Neighborhood map
What this means for you Summary
Snapshot
- This is a 4-bed/1.0-bath single-family listed at $160k.
Deal economics
- At list price, monthly cash flow is $329 ($4k/yr) — positive.
- The deal already cash-flows at list — no discount required.
- Meets the 1% rule at list price ($2k rent vs $160k).
- Recommended offer: $158k (1.5% below list) — sets the bar for market timing.
Location & tenants
- Location reads 77/100 on livability (#187 in NY, #2,869 nationally) — a middle-class / working-renter tenant base. Strengths: amenities A+, commute A+, cost of living A+; Watch: schools D+, crime F, employment D-.
- Syracuse City School District (urban): math 18% / reading 26% proficiency, ranked #590 of 590 in NY (top 100%) — low school quality limits family demand, transient renter base, plan for 1-2y turnover; 74% free/reduced lunch — lower-income household profile, screen leases tightly.
- Market conditions: 99 active listings in the ZIP; 11 comparable units currently listed for rent nearby; rentals lingering (median 44d on market — plan ~5-8 weeks vacancy on turnover, expect pricing pressure); 64% of comp listings sitting > 30 days — soft ceiling on asking rent; lower-income renter base — watch delinquency; 616 units permitted in Onondaga County in 2024 (256 in 5+ unit buildings).
- At $1,686/mo this rent would consume 45% of the median local household income ($45k/yr) (locally 1437% of renters already pay >50% of income on rent) — very limited rent-growth headroom before tenants either downsize or default.
Forward outlook
- In year one you build about $17k of equity ($1k loan paydown + $16k appreciation (10.0% local appreciation)).
- Onondaga County population projected to shrink 9% by 2050 — rents likely to lag national; underwrite the cash flow, not the appreciation.
- At projected returns (10.0% appreciation + 3.0% rent growth), your $45k cash investment doubles in ~3 years — after that, you're playing with house money.
- By year 3, paydown + projected appreciation supports a ~$43k cash-out refi (75% LTV) — recoverable capital for the next deal without selling this one.
Negotiation context
- It's been on market 21 days — a 2% lower offer ($158k) is reasonable based on typical stale-listing flexibility.
- 2 sale attempts with the ask held roughly flat each time — persistent listings suggest the price (not the market) is what's stuck; bring a comps-based counter.
- Current owner paid $50k; list at $160k implies a 223% gain — meaningful room to come down on a strong offer.
Risks & watch-outs
- Watch-outs: built in 1920 — expect roof / HVAC / electrical / plumbing capex.
Questions for the listing agent
- Built in 1920 — when were the roof, HVAC, electrical panel, plumbing, and water heater last replaced?
- Is there a deadline driving the sale (1031 exchange, divorce, estate, relocation)? That informs how much negotiation room exists.
- Schools are D-rated, which usually means shorter tenancies and higher turnover. Who's the typical renter profile here, and what's been the actual vacancy rate?
- Crime grade is F in this area — have there been break-ins, vandalism, or insurance claims at this property in the last 3 years? What carrier currently insures it and at what premium?
- What's the average days-on-market for RENTAL listings here right now (not sales)? A rising rental-DOM trend means longer vacancies and softer asking-rent achievability than the comps imply.
- What's the recent tenant-quality profile in this submarket — average credit score on applications, eviction rate, late-payment / NSF rate, and stable-employment percentage? A property-management company in the area should have these aggregated.
- How much new for-sale + rental construction is in the pipeline within 1–3 miles? Heavy new supply typically softens prices + rents 12–24 months out; constrained supply supports both.
Investment metrics
- 1% rule
- 1.05% ✓
- Cap rate
- 8.76%
- Cash-on-cash
- 8.81%
- DSCR
- 1.39
- GRM
- 7.9
CMA / ARV
- ARV (on-the-fly)
- $154,752
- Comps found
- 12
Show comp detail 12 sales within ~0.75 mi
| Address | Dist | Beds/Ba | Sqft | Sold | Price | $/sf | Match |
|---|---|---|---|---|---|---|---|
| 226 Burdick Ave | 0.13mi | 3/1.0 (-1) | 1,548 (+4%) | 0mo | $161,400 | $104 | 82 |
| 125 Cadillac St | 0.12mi | 3/1.5 (-1) | 1,528 (+3%) | 3mo | $165,000 | $108 | 80 |
| 3119 Grant Blvd | 0.41mi | 3/1.0 (-1) | 1,478 (-1%) | 2mo | $95,000 | $64 | 73 |
| 212 Hood Ave | 0.35mi | 4/1.5 | 1,540 (+4%) | 5mo | $160,000 | $104 | 71 |
| 2723 Grant Blvd | 0.15mi | 4/3.0 | 1,680 (+13%) | 2mo | $310,000 | $185 | 62 |
| 117 Lawrence St | 0.49mi | 3/1.0 (-1) | 1,416 (-5%) | 6mo | $90,000 | $64 | 59 |
| 1615 Spring St | 0.58mi | 4/1.0 | 1,392 (-6%) | 4mo | $66,000 | $47 | 58 |
| 121 Englert Ave | 0.34mi | 3/1.0 (-1) | 1,300 (-13%) | 4mo | $200,000 | $154 | 55 |
| 908 1st North St | 0.38mi | 5/2.0 (+1) | 1,344 (-10%) | 5mo | $70,000 | $52 | 53 |
| 110 Lacy Pl | 0.56mi | 3/1.0 (-1) | 1,608 (+8%) | 3mo | $138,500 | $86 | 53 |
| 104 Westview Ave | 0.67mi | 3/1.5 (-1) | 1,618 (+9%) | 3mo | $189,000 | $117 | 45 |
| 125 1/2 Westview Ave | 0.70mi | 4/1.5 | 1,292 (-13%) | 3mo | $220,000 | $170 | 41 |
Match score weights: distance 35% · size 25% · config 20% · recency 20%. Top-matched comps best support the ARV.
Projected returns pro-forma
10.0% appreciation · 3.0% rent growth · sell at horizon
- IRR
- 30.7%
- Equity multiple
- 3.41×
- Total profit
- $107,990
- Equity at exit
- $144,051
- IRR
- 26.6%
- Equity multiple
- 7.73×
- Total profit
- $301,471
- Equity at exit
- $310,651
Cash invested: $44,772 (down + closing). Projections, not guarantees.
Landlord ↔ Tenant lean methodology
- Overall (STATE)
- 15 Strongly Tenant-Friendly
- State New York
- 15 Strongly Tenant-Friendly · D+10
- County
- — inherits STATE
- City
- — inherits STATE
ZIP-level market 13208
- Home prices YoY
- 8.4%
- Active inventory
- 99
- Price-to-rent
- 7.9×
Monthly cashflow live
- Estimated rent
- $1,686 high interval (Pro) →
- Mortgage (P&I)
- −$839
- Tax from tax record
- −$98 /mo · $1,173/yr
- Insurance
- −$67
- HOA
- −$0
- Vacancy / Maint / Mgmt
- −$354
- Net cashflow
- $329
Break-even live
UW: 25.0% down · 7.5% · 30yr · 1.5% tax · 5.0% vac · 8.0% maint · 8.0% mgmt
Financing live
Cash to close
- Down payment
- $39,975
- Closing costs
- $4,797
- Reserves months
- —
- Total cash needed
- —
Loan-product check · same deal, 3 products live
Conventional
25% down · 7.5% · 30yr
- Down + closing
- —
- Monthly P&I
- —
- Monthly cashflow
- —
- DSCR
- —
- Eligible?
- —
Personal DTI + credit; lowest rate.
DSCR
20% down · 8.5% · 30yr
- Down + closing
- —
- Monthly P&I
- —
- Monthly cashflow
- —
- DSCR
- —
- Eligible?
- —
No personal income docs; deal must DSCR.
Hard money
10% down · 12.0% · 12mo
- Down + closing
- —
- Monthly P&I
- —
- Monthly cashflow
- —
- DSCR
- —
- Eligible?
- —
Short-term bridge; refi at stabilization.
Rent comps 11 comps
| Address | Beds | Baths | Sqft | Rent | $/sqft | DOM | Units | Dist |
|---|---|---|---|---|---|---|---|---|
| 286 Ross Park Syracuse, NY | 3.0 | 1.0 | 1100 | $1,500 | $1.36 | 44d | 1 | 0.32mi |
| 1132 Wolf St Unit 4 Syracuse, NY | 3.0 | 1.0 | 1041 | $1,350 | $1.30 | 43d | 1 | 0.40mi |
| 1507 N Salina St Unit 3 Syracuse, NY | 3.0 | 2.0 | 1030 | $1,350 | $1.31 | 43d | 1 | 0.71mi |
| 912 Park St Unit 1 Syracuse, NY | 3.0 | 1.0 | 1040 | $1,200 | $1.15 | 43d | 1 | 0.83mi |
| 126 Woodruff Ave Syracuse, NY | 3.0 | 1.0 | 1200 | $1,675 | $1.40 | 43d | 1 | 0.92mi |
| 746 E Laurel St Unit 1 Syracuse, NY | 4.0 | 2.0 | 1400 | $1,500 | $1.07 | 43d | 1 | 1.14mi |
| 106 Harrington St Syracuse, NY | 3.0 | 1.0 | 1168 | $1,875 | $1.61 | 43d | 1 | 1.20mi |
| 423 Wendell Ter Syracuse, NY | 4.0 | 1.0 | 1312 | $2,500 | $1.91 | 13d | 1 | 1.22mi |
| 130 Old Liverpool Rd Liverpool, NY | 4.0 | 1.0 | 1100 | $1,700 | $1.55 | 13d | 1 | 1.43mi |
| 2802 Lemoyne Ave Unit 1 Syracuse, NY | 3.0 | 1.0 | 988 | $1,700 | $1.72 | 13d | 1 | 1.46mi |
| 416 Pearl St Unit 2 Syracuse, NY | 3.0 | 1.0 | 900 | $2,400 | $2.67 | 13d | 1 | 1.48mi |
Listing history 19 events
-
2026-06-18days on market $159,900 Active 21 DOM
-
2026-06-17days on market $159,900 Active 20 DOM
-
2026-06-16days on market $159,900 Active 19 DOM
-
2026-06-15days on market $159,900 Active 18 DOM
-
2026-06-14days on market $159,900 Active 16 DOM
-
2026-06-13days on market $159,900 Active 15 DOM
-
2026-06-10days on market $159,900 Active 13 DOM
-
2026-06-09days on market $159,900 Active 12 DOM
-
2026-06-08days on market $159,900 Active 11 DOM
-
2026-06-07days on market $159,900 Active 10 DOM
-
2026-06-05days on market $159,900 Active 7 DOM
-
2026-06-02days on market $159,900 Active 5 DOM
-
2026-06-01days on market $159,900 Active 4 DOM
-
2026-05-31days on market $159,900 Active 3 DOM
-
2026-05-30days on market $159,900 Active 2 DOM
-
2026-05-28$159,900 Active
-
2025-10-17historical
-
2025-04-17$145,000 Active
-
2005-02-17soldstatus $49,500
ⓘ Source: listings_history table (triggers on properties + properties_extension) + one-shot
backfill from property_details.listing_events for pre-trigger history.
Tax reassessment forecast NY · Partial reset (capped growth)
- Current annual tax
- $1,173 · $98/mo
- Projected year-2 tax
- $1,938 · $161/mo
- Expected delta
- +$765/yr (+$64/mo · 65.2%)
ⓘ Screening estimate from a state-policy table — verify with the county assessor before closing.
Climate risk First Street
- Flood 1/10 Low FEMA zone X (unshaded) · 0% chance over 30 yrs
- Wildfire 1/10 Low
- Heat 3/10 Moderate 7 d/yr ≥95°F today · 15 d/yr by 30 yrs out
- Wind 1/10 Low 0% chance of damaging wind over 30 yrs
- Air quality 2/10 Low 0 unhealthy d/yr today · 1 by 30 yrs out
Nearby sold comps map
Loading sold comps map…
Walkable amenities ~0.75 mi
Loading nearby amenities…
Taxation est. · year 1
- Rental income
- $20,229
- − Mortgage interest
- −$8,957
- − Property taxes
- −$1,173
- − Insurance
- −$800
- − Repairs & maintenance
- −$1,618
- − Management
- −$1,618
- − Depreciation
- −$4,652
- Taxable income
- $1,411
- Est. tax owed @ 24.0%
- −$339
- After-tax cash flow
- $3,607/yr
For passive investors: Depreciation is non-cash, so a rental often shows a tax loss while cash-flowing — sheltering income. Rental losses are passive: they offset passive income freely, and up to $25,000/yr can offset ordinary (W-2) income if you actively participate and your MAGI is under $100k (phasing out to $0 by $150k); unused losses carry forward. On sale, claimed depreciation is recaptured at up to 25%, and gains may owe capital-gains tax (a 1031 exchange can defer both). Figures are a year-1 estimate at your 24.0% rate — not tax advice; consult a CPA.
Schools (NCES district)
- District
- Syracuse City School District
- NCES district ID
- 3628590
- Math proficiency
- 18% ▼ -5.00%
- Reading proficiency
- 26% ▬ 0.00%
- Median HH income
- $32,097
- Composite
- 17.83/100
- National rank
- #9007
- State rank
- #590 of 590 in NY
Livability — Syracuse
- Score
- 77/100
- State rank
- #187
- US rank
- #2869
Category grades
Schools grade is shown separately in the Schools card above.
Census & demographics
- Census place
- Syracuse, NY
- County
- Onondaga County · 247,257 people
- City population
- 152,627
- Metro
- Syracuse, NY
- Population (ZIP)
- 22,993
- Household income
- $44,712
- Rent vs Own
- Severe rent burden
- 1437.0
Population outlook (Onondaga County) Hauer SSP2
- Today (2025)
- 467,894 people
- By 2030
- 463,381 · -1.0%
- By 2040
- 447,697 · -4.3%
- By 2050
- 426,399 · -8.9%
- By 2075
- 373,661 · -20.1%
- By 2100
- 307,967 · -34.2%
Race, ethnicity, and origin ACS 2023
- Neighborhood character
- Highly diverse neighborhood (Simpson 0.70)
- Race & ethnicity
- White 46% Black 24% Asian 14% Two or more races 10% Hispanic / Latino 6%
- Hispanic origin (detail)
- Puerto Rican 4% Dominican 1%
- Common ancestry
- Romanian 3% Swedish 3% Italian 1%
- Foreign-born
- 22% · Vietnam, Philippines, Canada
- Languages at home
- 70% English-only · Spanish 6% Other Asian/Pacific 5% Vietnamese 4%
Political lean MEDSL · Onondaga
- 2024 margin
- D (+17.3) · D 58.6% · R 41.4%
- 2008→2024 swing
- -3.0pp toward R · 2008: 20.3pp · 2024: 17.3pp
- All cycles
- 2024: D+17.3 2020: D+20.6 2016: D+12.8 2012: D+21.1 2008: D+20.3
Not yet ingested
- Civics
- —
Market trends
- HPI YoY
- ▲ 30.91%
- Current HPI
- 399.3284
- Rent YoY
- —
- Metro
- Syracuse, NY
- State GDP YoY
- ▲ 2.60%
- F500 in state
- 92
Industry mix (Fortune 500 HQ in NY)
| Industry | F500 HQs | Revenue |
|---|---|---|
| Financial Services | 10 | $950B |
|
||
| Consumer Goods | 9 | $162B |
|
||
| Insurance | 4 | $225B |
|
||
| Telecommunications | 2 | $144B |
|
||
| Pharmaceuticals | 2 | $112B |
|
||
| Media / Entertainment | 2 | $69B |
|
||
Price history
+223.0% since first listed4 events — show timeline
- 2026-05-28 Listed $159,900 CNYIS
- 2025-10-17 Listing Removed — CNYIS
- 2025-04-17 Listed $145,000 CNYIS
- 2005-02-17 Sold (Public Records) $49,500 Public Records
Property tax history
-0.0%/yrLatest (2025): $1,173 · +0.0% YoY. Source: county tax records.
Cash-flow waterfall
monthlySold comps — $/sqft
last 12 mo · ≤1 miLoading sold comps…