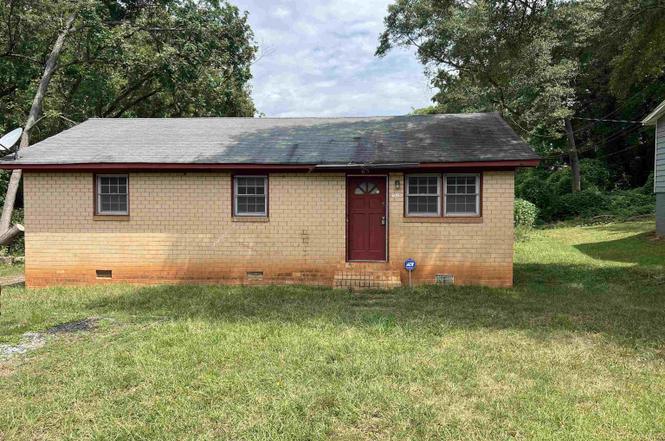
656 S Center St · Spartanburg, SC
Flood risk 9/10 · Severe
- FEMA flood zone
- X (shaded)
- Chance of flooding over 30 yrs
- 0.99%
- Est. flood insurance / yr
- $507 – $1,088
Fire risk 3/10 · Minor
- Est. fire insurance / yr
- $783 – $1,453
Heat risk 6/10 · Moderate
- Hot days now (above 105°F)
- 7 days/yr
- Hot days in 30 yrs
- 15 days/yr
Wind risk 2/10 · Minimal
- Chance of severe wind over 30 yrs
- 2.0%
Air-quality risk 4/10 · Minor
- Unhealthy air days now
- 4 days/yr
- Unhealthy air days in 30 yrs
- 4 days/yr
Risk factors via First Street. Map © Google.
Why this score? — see what drove the B+ grade
The composite is a weighted blend of 9 inputs, each scored 0–100. Each bar is that input's sub-score; the figure is the points it added to the 100-point composite (weight × sub-score).
- Cash flow +30.0/30.0
- ARV discount +15.0/15.0
- 1% rule +10.0/10.0
- DSCR +10.0/10.0
- Livability +3.8/5.0
- Schools +3.1/10.0
- Condition / age +2.5/5.0
- Rent growth +1.8/5.0
- Appreciation +0.0/10.0
$79,900
🖨 Deal sheet 📄 Offer letter ✓ Due diligence
Listing remarks
Investor Special – 3BR/1BA Brick Home with Major Potential! Attention investors and savvy buyers! Don’t miss this solid 3-bedroom, 1-bath brick home offering 975 square feet of opportunity. With a classic brick exterior and a functional floor plan, this property is a blank canvas ready for your vision, whether you’re looking to flip, hold as a rental, or renovate and occupy. Located in a stable area with strong rental demand, this home has great bones and is priced to sell. The lot provides a manageable yard and driveway parking. Bring your contractor and your creativity—this one needs some TLC but has tons of upside.
Key facts
- Strong rental demand
- Manageable yard
- Brick home
Tags
Property features AI
Finance
- Other: Lead-based paint and residential property disclosures required
- HOA & community: No HOA fees or community amenities
Exterior
- Parking: Driveway parking; Gravel driveway; No garage
- Utilities: Public water; Public sewer; Electric water heater; Public garbage pickup; No garage
- Home design: Single-story home; Approximately 50+ years old; Lot is half an acre or less
- Construction: Brick veneer (full) exterior; Composition shingle roof; Crawl space foundation; Outbuilding for storage
- Exterior features: Some storm doors; Tilt-out windows; Some trees on the lot
Interior
- Kitchen: Kitchen approximately 16 x 9; No appliances included
- Bedrooms: Primary bedroom on the main level; Main-level bedrooms: 3; Primary bedroom approximately 9 x 14; Second bedroom approximately 10 x 13; Third bedroom approximately 10 x 9
- Flooring: Hardwood flooring; Vinyl flooring
- Bathrooms: One full bathroom (on the main level)
- Heating & cooling: Gas available for heating; No cooling system
- Interior features: Laminate countertops; All window treatments remain; No fireplace
- Laundry & utility: Laundry on the first floor in the kitchen with washer connection
Neighborhood map
What this means for you Summary
Snapshot
- This is a 3-bed/1.0-bath single-family listed at $80k.
Deal economics
- At list price, monthly cash flow is $344 ($4k/yr) — positive.
- The deal already cash-flows at list — no discount required.
- Meets the 1% rule at list price ($1k rent vs $80k).
- Recommended offer: $70k (12.0% below list) — sets the bar for market timing.
- Cap rate 12.5% vs local median 3.9% in Spartanburg — top-decile yield for the area; either an underpriced asset or a hidden risk that comps aren't pricing in. Stress-test before assuming the spread holds.
Location & tenants
- Location reads 76/100 on livability (#24 in SC, #3,679 nationally) — a middle-class / working-renter tenant base. Strengths: amenities A+, commute A+, cost of living A+; Watch: crime F, employment F.
- Spartanburg 07 (urban): math 34% / reading 41% proficiency, ranked #39 of 80 in SC (top 49%) — families likely to look elsewhere, expect single-tenant / working-renter base with shorter leases; 62% free/reduced lunch — lower-income household profile, screen leases tightly.
- Zoned schools: The Cleveland Academy of Leadership (math 28% / reading 22%, grade F, #447 of 597 statewide, top 76%, 463 students, 100% FRL) — zoned schools average 100% FRL vs 62% district-wide (38 pts higher); higher-poverty schools than district average — tighter screening recommended.
- Zoned-school proficiency averages 25% at this address vs 38% district-wide (-12 pts) — the specific schools serving this property underperform the Spartanburg 07 average; the district grade overstates school quality for this exact location.
- Market conditions: Rents soft (-2.6%/yr); 466 active listings in the ZIP; 13 comparable units currently listed for rent nearby; rentals at typical pace (median 21d on market — plan ~3-4 weeks tenant-placement turnaround); 3,129 units permitted in Spartanburg County in 2024 (40 in 5+ unit buildings).
Forward outlook
- Local home prices are declining (-3.0%/yr); year-one equity from $552 of loan paydown is wiped out by about $2k of value loss. Plan a longer hold.
- Spartanburg County population projected at +18% by 2050 — long-run rental-demand tailwind backs the buy-and-hold thesis.
- At projected returns (-3.0% appreciation + 0.0% rent growth), your $22k cash investment doubles in ~10 years — after that, you're playing with house money.
Negotiation context
- It's been on market 284 days — a 12% lower offer ($70k) is reasonable based on typical stale-listing flexibility.
- 3 sale attempts; this cycle's ask has dropped $20k (20%) from the opening price — seller is motivated, your offer sets the floor, not the list.
Risks & watch-outs
- Watch-outs: property tax is 3.1% of price; flood insurance adds $66/mo.
- Climate carrying-cost: severe flood risk; extreme-heat days projected 7→15/yr by 2055 (HVAC capex compounding) — expect insurance premiums to compound above CPI over the hold.
Questions for the listing agent
- It's been on market 284 days. Have you received any prior offers? Is the seller open to a 12% concession, seller financing, or rate buy-down credit?
- Built in 1971 — when were the roof, HVAC, electrical panel, plumbing, and water heater last replaced?
- Property tax is high relative to price — has the assessment been appealed recently, and will the sale trigger a re-assessment?
- What's the actual annual flood-insurance premium (NFIP or private), and is the property in a SFHA with mandatory coverage?
- Why hasn't it sold? Are there any deal-killer items the seller is aware of (foundation, flood, title, zoning, code violations)?
- Is there a deadline driving the sale (1031 exchange, divorce, estate, relocation)? That informs how much negotiation room exists.
- Schools are D-rated, which usually means shorter tenancies and higher turnover. Who's the typical renter profile here, and what's been the actual vacancy rate?
- Crime grade is F in this area — have there been break-ins, vandalism, or insurance claims at this property in the last 3 years? What carrier currently insures it and at what premium?
- What's the average days-on-market for RENTAL listings here right now (not sales)? A rising rental-DOM trend means longer vacancies and softer asking-rent achievability than the comps imply.
- What's the recent tenant-quality profile in this submarket — average credit score on applications, eviction rate, late-payment / NSF rate, and stable-employment percentage? A property-management company in the area should have these aggregated.
- How much new for-sale + rental construction is in the pipeline within 1–3 miles? Heavy new supply typically softens prices + rents 12–24 months out; constrained supply supports both.
Investment metrics
- 1% rule
- 1.69% ✓
- Cap rate
- 12.46%
- Cash-on-cash
- 22.01%
- DSCR
- 1.98
- GRM
- 4.9
CMA / ARV
- ARV (on-the-fly)
- $153,075
- Comps found
- 12
Show comp detail 12 sales within ~0.75 mi
| Address | Dist | Beds/Ba | Sqft | Sold | Price | $/sf | Match |
|---|---|---|---|---|---|---|---|
| 656 S Center St | 0.00mi | 3/1.0 | 975 (0%) | 0mo | $60,000 | $62 | 100 |
| 103 Anderson St | 0.32mi | 3/2.0 | 1,000 (+3%) | 5mo | $208,000 | $208 | 72 |
| 105 Westmoreland St | 0.67mi | 3/1.0 | 988 (+1%) | 2mo | $177,000 | $179 | 65 |
| 211 Edenbridge Ln | 0.49mi | 3/1.0 | 1,050 (+8%) | 2mo | $189,000 | $180 | 63 |
| 776 Wofford St | 0.26mi | 3/1.0 | 850 (-13%) | 7mo | $95,000 | $112 | 61 |
| 779 Saxon Ave | 0.29mi | 2/1.0 (-1) | 1,111 (+14%) | 3mo | $115,000 | $104 | 56 |
| 760 Wofford St | 0.26mi | 3/1.0 | 840 (-14%) | 12mo | $154,500 | $184 | 54 |
| 784 Wofford St | 0.26mi | 3/1.0 | 840 (-14%) | 13mo | $98,500 | $117 | 54 |
| 318 Austin St | 0.41mi | 2/2.0 (-1) | 1,026 (+5%) | 12mo | $145,000 | $141 | 53 |
| 234 Southstar St | 0.51mi | 2/1.0 (-1) | 889 (-9%) | 10mo | $160,000 | $180 | 48 |
| 216 Fisher Ave | 0.61mi | 3/1.0 | 1,100 (+13%) | 12mo | $173,000 | $157 | 40 |
| 5 Smythe St St | 0.74mi | 2/1.0 (-1) | 912 (-6%) | 11mo | $41,500 | $46 | 40 |
Match score weights: distance 35% · size 25% · config 20% · recency 20%. Top-matched comps best support the ARV.
Projected returns pro-forma
-3.0% appreciation · 0.0% rent growth · sell at horizon
- IRR
- 6.1%
- Equity multiple
- 1.23×
- Total profit
- $5,123
- Equity at exit
- $11,913
- IRR
- 12.1%
- Equity multiple
- 1.80×
- Total profit
- $17,869
- Equity at exit
- $6,908
Cash invested: $22,372 (down + closing). Projections, not guarantees.
Landlord ↔ Tenant lean methodology
- Overall (STATE)
- 90 Strongly Landlord-Friendly
- State South Carolina
- 90 Strongly Landlord-Friendly · R+6
- County
- — inherits STATE
- City
- — inherits STATE
ZIP-level market 29301
- Home prices YoY
- -25.3%
- Rents YoY
- -2.6%
- Active inventory
- 466
- Price-to-rent
- 4.9×
Monthly cashflow live
- Estimated rent
- $1,352 high interval (Pro) →
- Mortgage (P&I)
- −$419
- Tax from tax record
- −$205 /mo · $2,463/yr
- Insurance
- −$33
- Flood insurance flood zone
- −$66 /mo · $798/yr
- HOA
- −$0
- Vacancy / Maint / Mgmt
- −$284
- Net cashflow
- $344
Break-even live
UW: 25.0% down · 7.5% · 30yr · 1.5% tax · 5.0% vac · 8.0% maint · 8.0% mgmt
Financing live
Cash to close
- Down payment
- $19,975
- Closing costs
- $2,397
- Reserves months
- —
- Total cash needed
- —
Loan-product check · same deal, 3 products live
Conventional
25% down · 7.5% · 30yr
- Down + closing
- —
- Monthly P&I
- —
- Monthly cashflow
- —
- DSCR
- —
- Eligible?
- —
Personal DTI + credit; lowest rate.
DSCR
20% down · 8.5% · 30yr
- Down + closing
- —
- Monthly P&I
- —
- Monthly cashflow
- —
- DSCR
- —
- Eligible?
- —
No personal income docs; deal must DSCR.
Hard money
10% down · 12.0% · 12mo
- Down + closing
- —
- Monthly P&I
- —
- Monthly cashflow
- —
- DSCR
- —
- Eligible?
- —
Short-term bridge; refi at stabilization.
Rent comps 13 comps
| Address | Beds | Baths | Sqft | Rent | $/sqft | DOM | Units | Dist |
|---|---|---|---|---|---|---|---|---|
| 694 Saxon Ave Spartanburg, SC | 3.0 | 1.0 | 1014 | $1,300 | $1.28 | 21d | 1 | 0.28mi |
| 321 Southstar St Spartanburg, SC | 2.0 | 1.0 | 895 | $849 | $0.95 | 21d | 1 | 0.58mi |
| 317 Southstar St Spartanburg, SC | 2.0 | 1.0 | 895 | $849 | $0.95 | 21d | 1 | 0.58mi |
| 100 Vanderbilt Ln Spartanburg, SC | 1.0–2.0 | 1.0–2.0 | 787 | $1,195 | $1.52 | 21d | 1 | 0.67mi |
| 500 Howard St Spartanburg, SC | 1.0–3.0 | 1.0–2.0 | 999 | $1,650 | $1.65 | 13d | 1 | 0.84mi |
| 560 Magnolia St Spartanburg, SC | 2.0 | 1.0 | 965 | $1,113 | $1.15 | 21d | 1 | 0.93mi |
| 408 Abner Rd Spartanburg, SC | 2.0–3.0 | 2.0 | 996 | $1,515 | $1.52 | 21d | 6 | 1.01mi |
| 131 College St Spartanburg, SC | 2.0 | 1.0 | 700 | $1,195 | $1.71 | 21d | 1 | 1.04mi |
| 142 Magnolia St Unit 301 Spartanburg, SC | 2.0 | 2.0 | 937 | $1,850 | $1.97 | 21d | 1 | 1.26mi |
| 334 W Hampton Ave Unit 1 Spartanburg, SC | 2.0 | 1.0 | 895 | $1,100 | $1.23 | 21d | 1 | 1.43mi |
| 111 Timothy St Spartanburg, SC | 2.0 | 1.0 | 1100 | $1,600 | $1.45 | 21d | 1 | 1.46mi |
| 201 N Liberty St Spartanburg, SC | 3.0 | 1.0–2.0 | 1153 | $2,330 | $2.02 | 13d | 32 | 1.46mi |
| 311 Powell Mill Rd Spartanburg, SC | 2.0 | 1.0 | 675 | $995 | $1.47 | 21d | 1 | 1.47mi |
Listing history 11 events
-
2026-05-15status Pending
-
2026-05-07historical Contingency Contract
-
2026-04-24status Active
-
2026-03-20historical Contingency Contract
-
2025-12-17price $79,900
-
2025-10-23price $84,900
-
2025-10-22status Active
-
2025-10-14historical Contingency Contract
-
2025-09-10price $89,900
-
2025-08-28price $94,900
-
2025-08-04$99,900 Active
ⓘ Source: listings_history table (triggers on properties + properties_extension) + one-shot
backfill from property_details.listing_events for pre-trigger history.
Tax reassessment forecast SC · Resets to sale price
- Current annual tax
- $2,463 · $205/mo
- Projected year-2 tax
- $2,463 · $205/mo
- Expected delta
- $0/yr ($0/mo · 0.0%)
ⓘ Screening estimate from a state-policy table — verify with the county assessor before closing.
Climate risk First Street
- Flood 9/10 Extreme FEMA zone X (shaded) · 99% chance over 30 yrs
- Wildfire 3/10 Moderate
- Heat 6/10 Major 7 d/yr ≥105°F today · 15 d/yr by 30 yrs out
- Wind 2/10 Low 2% chance of damaging wind over 30 yrs
- Air quality 4/10 Moderate 4 unhealthy d/yr today · 4 by 30 yrs out
Nearby sold comps map
Loading sold comps map…
Walkable amenities ~0.75 mi
Loading nearby amenities…
Taxation est. · year 1
- Rental income
- $16,223
- − Mortgage interest
- −$4,476
- − Property taxes
- −$2,463
- − Insurance
- −$1,197
- − Repairs & maintenance
- −$1,298
- − Management
- −$1,298
- − Depreciation
- −$2,324
- Taxable income
- $3,166
- Est. tax owed @ 24.0%
- −$760
- After-tax cash flow
- $3,367/yr
For passive investors: Depreciation is non-cash, so a rental often shows a tax loss while cash-flowing — sheltering income. Rental losses are passive: they offset passive income freely, and up to $25,000/yr can offset ordinary (W-2) income if you actively participate and your MAGI is under $100k (phasing out to $0 by $150k); unused losses carry forward. On sale, claimed depreciation is recaptured at up to 25%, and gains may owe capital-gains tax (a 1031 exchange can defer both). Figures are a year-1 estimate at your 24.0% rate — not tax advice; consult a CPA.
Schools (NCES district)
- District
- Spartanburg 07
- NCES district ID
- 4503660
- Math proficiency
- 34% ▼ -1.00%
- Reading proficiency
- 41% ▼ -1.00%
- Median HH income
- $35,825
- Composite
- 31.04/100
- National rank
- #6087
- State rank
- #39 of 80 in SC
Livability — Spartanburg
- Score
- 76/100
- State rank
- #24
- US rank
- #3679
Category grades
Schools grade is shown separately in the Schools card above.
Census & demographics
- Census place
- Spartanburg, SC
- County
- Spartanburg County · 258,607 people
- City population
- 120,406
- Metro
- Spartanburg, SC
- Population (ZIP)
- 36,278
- Household income
- $57,805
- Rent vs Own
- Severe rent burden
- 1331.0
Population outlook (Spartanburg County) Hauer SSP2
- Today (2025)
- 325,495 people
- By 2030
- 338,800 · +4.1%
- By 2040
- 363,471 · +11.7%
- By 2050
- 384,156 · +18.0%
- By 2075
- 430,137 · +32.1%
- By 2100
- 442,733 · +36.0%
Race, ethnicity, and origin ACS 2023
- Neighborhood character
- Diverse neighborhood (Simpson 0.67)
- Race & ethnicity
- White 45% Black 32% Hispanic / Latino 13% Two or more races 9% Asian 5%
- Hispanic origin (detail)
- Mexican 7% Puerto Rican 2%
- Common ancestry
- Slovak 2% Lithuanian 1% Italian 1%
- Foreign-born
- 12% · Canada, China, Vietnam
- Languages at home
- 83% English-only · Spanish 10% Other Indo-European 3% Other Asian/Pacific 1%
Political lean MEDSL · Spartanburg
- 2024 margin
- Solid R (+33.6) · D 32.6% · R 66.2% · Other 1.2%
- 2008→2024 swing
- -12.0pp toward R · 2008: -21.6pp · 2024: -33.6pp
- All cycles
- 2024: R+33.6 2020: R+27.3 2016: R+30.0 2012: R+23.1 2008: R+21.6
Not yet ingested
- Civics
- —
Market trends
- HPI YoY
- ▼ -77.19%
- Current HPI
- 228.4172
- Rent YoY
- ▼ -2.64%
- Metro
- Spartanburg, SC
- State GDP YoY
- ▲ 4.51%
- F500 in state
- 2
Industry mix (Fortune 500 HQ in SC)
| Industry | F500 HQs | Revenue |
|---|---|---|
| Packaging | 1 | $7B |
|
||
Price history
-20.0% since first listed11 events — show timeline
- 2026-05-15 Pending — Greater Greenville MLS
- 2026-05-07 Contingent — Greater Greenville MLS
- 2026-04-24 Relisted — Greater Greenville MLS
- 2026-03-20 Contingent — Greater Greenville MLS
- 2025-12-17 Price Changed $79,900 Greater Greenville MLS
- 2025-10-23 Price Changed $84,900 Greater Greenville MLS
- 2025-10-22 Relisted — Greater Greenville MLS
- 2025-10-14 Contingent — Greater Greenville MLS
- 2025-09-10 Price Changed $89,900 Greater Greenville MLS
- 2025-08-28 Price Changed $94,900 Greater Greenville MLS
- 2025-08-04 Listed $99,900 Greater Greenville MLS
Property tax history
+26.4%/yrLatest (2025): $2,463 · +496.7% YoY. Source: county tax records.
Cash-flow waterfall
monthlySold comps — $/sqft
last 12 mo · ≤1 miLoading sold comps…