 Duplex
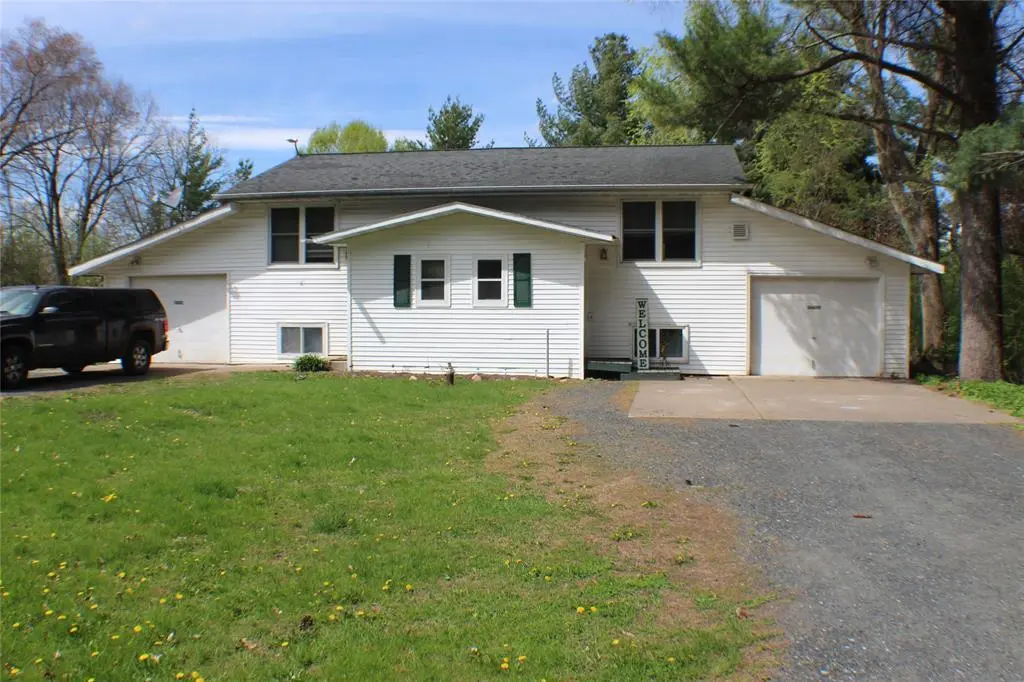
16682-90 96th Ave #2 · Anson, WI
Flood risk 3/10 · Minor
- FEMA flood zone
- X (unshaded)
- Chance of flooding over 30 yrs
- 0.2%
- Est. flood insurance / yr
- $473 – $860
Fire risk 1/10 · Minimal
- Est. fire insurance / yr
- $636 – $1,182
Heat risk 2/10 · Minimal
- Hot days now (above 97°F)
- 7 days/yr
- Hot days in 30 yrs
- 14 days/yr
Wind risk 1/10 · Minimal
- Chance of severe wind over 30 yrs
- —
Air-quality risk 2/10 · Minimal
- Unhealthy air days now
- 1 days/yr
- Unhealthy air days in 30 yrs
- 1 days/yr
Risk factors via First Street. Map © Google.
Why this score? — see what drove the D grade
The composite is a weighted blend of 9 inputs, each scored 0–100. Each bar is that input's sub-score; the figure is the points it added to the 100-point composite (weight × sub-score).
- Cash flow +12.9/30.0
- ARV discount +7.5/15.0
- DSCR +3.9/10.0
- Condition / age +3.8/5.0
- 1% rule +3.7/10.0
- Schools +3.4/10.0
- Rent growth +3.0/5.0
- Livability +2.5/5.0
- Appreciation +0.0/10.0
$297,500
🖨 Deal sheet (PDF) 📄 Offer letter ✓ Due diligence
Multi-family units
County records classify this as Multi-Family (2-4 Unit). Listing-text estimate: 2 units. confirmed
Listing remarks
Ideal location for this 2 bedroom, 1 1/2 bath duplex. Seller has not had vacancy in the 14 years of owning property. Ideal for owner to occupy. Easy to maintain vinyl siding and nice back yard. Easy access to lake, golf course, bike trail, and number of business.
Key facts
- Built 1979
- Listed 37 days
Property features AI
Finance
- Other: Two-unit building
- Financial info: Property type: Multi-family; Acreage: less than 1/2 acre; Zoning: Residential
Exterior
- Utilities: Private septic system; Electric service
- Home design: Duplex (multi-family); Estimated finished area between 2001 and 2500 total square feet; Finished above-grade and below-grade living areas included
- Construction: Finished below-grade living area: 1,008; Finished above-grade living area: 1,080
- Exterior features: Deck; Vinyl exterior
Interior
- Kitchen: Range/Oven; Refrigerator
- Bedrooms: Unit 1: 2 bedrooms; Unit 2: 2 bedrooms
- Bathrooms: Unit 1: 1 full bath, 1 half bath; Unit 2: 1 full bath, 1 half bath
- Heating & cooling: Electric baseboard heating
- Interior features: Circuit breakers; Full poured concrete basement
- Laundry & utility: Washer and dryer excluded (not included with sale)
Neighborhood map
What this means for you Summary
Snapshot
- This is a 2 × 2-bed/1.5-bath units multifamily listed at $298k. Condition is rated good.
Deal economics
- At list price, monthly cash flow is $-21 ($-251/yr) — negative. Per door: $-10/mo.
- To cash-flow at today's rent, offer at most $294k (1.0% below list).
- To meet the 1% rule (rent ≥ 1% of price), the offer needs to be $258k (13.4% below list).
- Recommended offer: $258k (13.4% below list) — sets the bar for 1% rule.
Location & tenants
- Location reads: area grade D — affects rentability + tenant quality, not the cash-flow math above.
- Chippewa Falls Area Unified School District (suburban): math 39% / reading 39% proficiency, ranked #165 of 342 in WI (top 48%) — families likely to look elsewhere, expect single-tenant / working-renter base with shorter leases.
- Zoned schools: Chippewa Falls Middle (math 29% / reading 38%, grade F, #227 of 383 statewide, top 59%, 1,064 students, 39% FRL); Chippewa Falls High (math 26% / reading 42%, grade F, #177 of 483 statewide, top 37%, 1,458 students, 33% FRL) — zoned schools at 36% FRL track the district average.
- Market conditions: Rents rising (+1.9%/yr); 169 active listings in the ZIP; solid renter incomes; 368 units permitted in Chippewa County in 2024 (142 in 5+ unit buildings).
- This rent runs 41% of the median local income ($76k/yr) — at the standard rent-burdened threshold; future hikes will face affordability resistance.
Forward outlook
- Local home prices are declining (-3.0%/yr); year-one equity from $2k of loan paydown is wiped out by about $9k of value loss. Plan a longer hold.
- Chippewa County population projected to shrink 5% by 2050 — rents likely to lag national; underwrite the cash flow, not the appreciation.
Negotiation context
- It's been on market 38 days — a 3% lower offer ($289k) is reasonable based on typical stale-listing flexibility.
Questions for the listing agent
- What do current leases actually rent for vs. the listed asking? Can we see a recent rent roll and the last 12 months of T-12 income?
- It's been on market 38 days. Have you received any prior offers? Is the seller open to a 13% concession, seller financing, or rate buy-down credit?
- Can we see the unit-by-unit rent roll, current vacancy, and any below-market leases? What's the average tenancy length?
- What capital expenditures (roof, boiler, parking lot, exteriors) have been made in the last 5 years, and what's planned in the next 2?
- Built in 1979 — when were the roof, HVAC, electrical panel, plumbing, and water heater last replaced?
- Is there a deadline driving the sale (1031 exchange, divorce, estate, relocation)? That informs how much negotiation room exists.
- The area grade is low — what's the realistic commute time and amenity access for the typical tenant pool here? Any planned neighborhood developments (good or bad) we should know about?
- What's the average days-on-market for RENTAL listings here right now (not sales)? A rising rental-DOM trend means longer vacancies and softer asking-rent achievability than the comps imply.
- What's the recent tenant-quality profile in this submarket — average credit score on applications, eviction rate, late-payment / NSF rate, and stable-employment percentage? A property-management company in the area should have these aggregated.
- How much new apartment / multifamily construction is in the pipeline within 1–3 miles? Heavy new supply (>2% of stock underway) typically softens rents 12–24 months out; light construction supports rent growth.
Investment metrics
- 1% rule
- 0.87% ✗
- Cap rate
- 6.21%
- Cash-on-cash
- -0.30%
- DSCR
- 0.99
- GRM
- 9.6
CMA / ARV
No comps found within radius.
Projected returns pro-forma
-3.0% appreciation · 1.95% rent growth · sell at horizon
- IRR
- -18.0%
- Equity multiple
- 0.37×
- Total profit
- $-52,195
- Equity at exit
- $44,358
- IRR
- -12.3%
- Equity multiple
- 0.31×
- Total profit
- $-57,828
- Equity at exit
- $25,722
Cash invested: $83,300 (down + closing). Projections, not guarantees.
Landlord ↔ Tenant lean methodology
- Overall (STATE)
- 73 Landlord-Friendly
- State Wisconsin
- 73 Landlord-Friendly · R+2
- County
- — inherits STATE
- City
- — inherits STATE
ZIP-level market 54729
- Rents YoY
- 1.9%
- Active inventory
- 169
- Price-to-rent
- 19.2×
Monthly cashflow live
- Estimated rent
- $2,576 medium interval (Pro) →
- Mortgage (P&I)
- −$1,560
- Tax est. 1.5%
- −$372 /mo · $4,462/yr
- Insurance
- −$124
- HOA
- −$0
- Vacancy / Maint / Mgmt
- −$541
- Net cashflow
- $-21
Break-even live
Sensitivity live
| Price | -10% $185 | -5% $82 | +0% $-21 | +5% $-124 | +10% $-227 |
|---|---|---|---|---|---|
| Rent | -10% $-224 | -5% $-123 | +0% $-21 | +5% $81 | +10% $183 |
| Rate | -1.0pp $129 | -0.5pp $55 | base $-21 | +0.5pp $-98 | +1.0pp $-176 |
2-unit breakdown (identical units grouped — click to expand)
| Units | Beds | Baths | Est. rent |
|---|---|---|---|
| 2× units | 2 | 1.5 | $2,576 |
| #1 | 2 | 1.5 | $1,288 |
| #2 | 2 | 1.5 | $1,288 |
| Total (2 units) | $2,576 | ||
UW: 25.0% down · 7.5% · 30yr · 1.5% tax · 5.0% vac · 8.0% maint · 8.0% mgmt
Financing live
Cash to close
- Down payment
- $74,375
- Closing costs
- $8,925
- Reserves months
- —
- Total cash needed
- —
Loan-product check · same deal, 3 products live
Conventional
25% down · 7.5% · 30yr
- Down + closing
- —
- Monthly P&I
- —
- Monthly cashflow
- —
- DSCR
- —
- Eligible?
- —
Personal DTI + credit; lowest rate.
DSCR
20% down · 8.5% · 30yr
- Down + closing
- —
- Monthly P&I
- —
- Monthly cashflow
- —
- DSCR
- —
- Eligible?
- —
No personal income docs; deal must DSCR.
Hard money
10% down · 12.0% · 12mo
- Down + closing
- —
- Monthly P&I
- —
- Monthly cashflow
- —
- DSCR
- —
- Eligible?
- —
Short-term bridge; refi at stabilization.
Listing history 20 events
-
2026-06-21pricedays on market $297,500 Active 38 DOM
-
2026-06-19days on market $310,900 Active 36 DOM
-
2026-06-18days on market $310,900 Active 35 DOM
-
2026-06-17days on market $310,900 Active 34 DOM
-
2026-06-16days on market $310,900 Active 33 DOM
-
2026-06-15days on market $310,900 Active 32 DOM
-
2026-06-14days on market $310,900 Active 30 DOM
-
2026-06-13days on market $310,900 Active 29 DOM
-
2026-06-10days on market $310,900 Active 27 DOM
-
2026-06-09days on market $310,900 Active 26 DOM
-
2026-06-08days on market $310,900 Active 25 DOM
-
2026-06-07days on market $310,900 Active 24 DOM
-
2026-06-05days on market $310,900 Active 21 DOM
-
2026-06-03days on market $310,900 Active 20 DOM
-
2026-06-02days on market $310,900 Active 19 DOM
-
2026-06-01days on market $310,900 Active 18 DOM
-
2026-05-31days on market $310,900 Active 17 DOM
-
2026-05-30days on market $310,900 Active 16 DOM
-
2026-05-15$310,900 Active
-
2026-05-07historical $310,900
ⓘ Source: listings_history table (triggers on properties + properties_extension) + one-shot
backfill from property_details.listing_events for pre-trigger history.
Climate risk First Street
- Flood 3/10 Moderate FEMA zone X (unshaded) · 20% chance over 30 yrs
- Wildfire 1/10 Low
- Heat 2/10 Low 7 d/yr ≥97°F today · 14 d/yr by 30 yrs out
- Wind 1/10 Low
- Air quality 2/10 Low 1 unhealthy d/yr today · 1 by 30 yrs out
Nearby sold comps map
Loading sold comps map…
Walkable amenities ~0.75 mi
Loading nearby amenities…
Taxation est. · year 1
- Rental income
- $30,912
- − Mortgage interest
- −$16,665
- − Property taxes
- −$4,462
- − Insurance
- −$1,488
- − Repairs & maintenance
- −$2,473
- − Management
- −$2,473
- − Depreciation
- −$8,655
- Taxable loss
- −$5,303
- Est. tax savings @ 24.0%
- +$1,273
- After-tax cash flow
- $1,022/yr
For passive investors: Depreciation is non-cash, so a rental often shows a tax loss while cash-flowing — sheltering income. Rental losses are passive: they offset passive income freely, and up to $25,000/yr can offset ordinary (W-2) income if you actively participate and your MAGI is under $100k (phasing out to $0 by $150k); unused losses carry forward. On sale, claimed depreciation is recaptured at up to 25%, and gains may owe capital-gains tax (a 1031 exchange can defer both). Figures are a year-1 estimate at your 24.0% rate — not tax advice; consult a CPA.
Condition & rehab AI · 9 photos
This 2-bedroom, 2-bath duplex is in good condition with minimal repairs needed. Fresh paint and deep cleaning of carpets would significantly enhance its curb appeal and value.
Value-add opportunities
- Both Paint touch-ups — Fresh paint enhances curb appeal and interior aesthetics
- Both Deep cleaning of carpets — Clean carpets improve the home's appearance and reduce allergens
- Both Landscaping improvements — Well-maintained landscaping enhances curb appeal and property value
Renovation cost estimate screening
Value-add ROI direction
- Both Paint touch-ups — Fresh paint enhances curb appeal and interior aesthetics ↑
- Both Deep cleaning of carpets — Clean carpets improve the home's appearance and reduce allergens ↑
- Both Landscaping improvements — Well-maintained landscaping enhances curb appeal and property value ↑
ⓘ Cost ranges are severity-bucket heuristics (US national rule-of-thumb). Get contractor quotes + a written scope before underwriting a rehab budget.
Schools (NCES district)
- District
- Chippewa Falls Area Unified School District
- NCES district ID
- 5502550
- Math proficiency
- 39% ▼ -8.00%
- Reading proficiency
- 39% ▼ -5.00%
- Median HH income
- $53,111
- Composite
- 33.97/100
- National rank
- #5326
- State rank
- #165 of 342 in WI
Livability — Anson
No livability data for this city. (Only ~50 U.S. cities are tracked.)
Census & demographics
- County
- Chippewa County · 34,366 people
- Metro
- Eau Claire, WI
- Population (ZIP)
- 34,366
- Household income
- $75,809
- Rent vs Own
- Severe rent burden
- 890.0
Population outlook (Chippewa County) Hauer SSP2
- Today (2025)
- 64,601 people
- By 2030
- 64,743 · +0.2%
- By 2040
- 63,950 · -1.0%
- By 2050
- 61,359 · -5.0%
- By 2075
- 53,265 · -17.5%
- By 2100
- 40,534 · -37.3%
Race, ethnicity, and origin ACS 2023
- Neighborhood character
- Predominantly White (93%)
- Race & ethnicity
- White 93% Two or more races 3% Asian 2% Hispanic / Latino 2% Black 1%
- Common ancestry
- Portuguese 14% Romanian 5% Lithuanian 3%
- Foreign-born
- 2% · Canada, China
- Languages at home
- 96% English-only · Spanish 2% Other Asian/Pacific 1%
Political lean MEDSL · Chippewa
- 2024 margin
- Strong R (+23.0) · D 38.0% · R 60.9% · Other 1.1%
- 2008→2024 swing
- -32.1pp toward R · 2008: 9.1pp · 2024: -23.0pp
- All cycles
- 2024: R+23.0 2020: R+20.4 2016: R+19.2 2012: R+0.5 2008: D+9.1
Not yet ingested
- Civics
- —
Market trends
- HPI YoY
- ▼ -197.54%
- Current HPI
- 222.4407
- Rent YoY
- ▲ 1.95%
- Metro
- Eau Claire, WI
- State GDP YoY
- ▲ 2.10%
- F500 in state
- 20
Industry mix (Fortune 500 HQ in WI)
| Industry | F500 HQs | Revenue |
|---|---|---|
| Industrial Machinery | 4 | $23B |
|
||
| Industrial Technology | 2 | $36B |
|
||
| Insurance | 1 | $36B |
|
||
| Professional Services | 1 | $19B |
|
||
| Utilities | 1 | $9B |
|
||
| Consumer Goods | 1 | $3B |
|
||
Price history
+0.0% since first listed2 events — show timeline
- 2026-05-15 Listed $310,900 RANWW
- 2026-05-07 Coming Soon $310,900 RANWW
Cash-flow waterfall
monthlySold comps — $/sqft
last 12 mo · ≤1 miLoading sold comps…