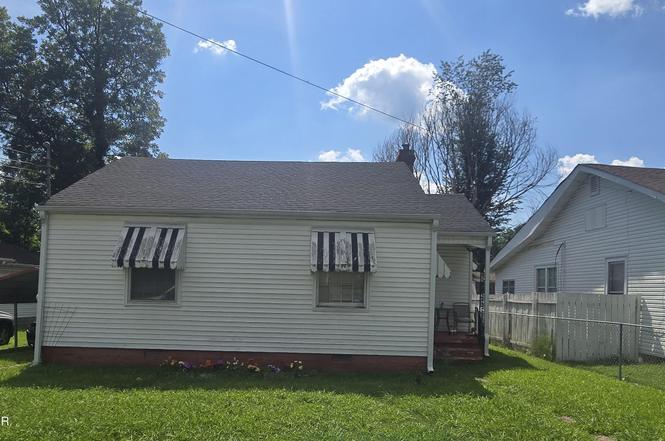
123 Lenoir Ave · Jackson, TN
Flood risk 1/10 · Minimal
- FEMA flood zone
- X (unshaded)
- Chance of flooding over 30 yrs
- 0.0%
- Est. flood insurance / yr
- $507 – $1,088
Fire risk 1/10 · Minimal
- Est. fire insurance / yr
- $949 – $1,763
Heat risk 7/10 · Major
- Hot days now (above 108°F)
- 7 days/yr
- Hot days in 30 yrs
- 21 days/yr
Wind risk 4/10 · Minor
- Chance of severe wind over 30 yrs
- 16.0%
Air-quality risk 1/10 · Minimal
- Unhealthy air days now
- 0 days/yr
- Unhealthy air days in 30 yrs
- 0 days/yr
Risk factors via First Street. Map © Google.
Why this score? — see what drove the B+ grade
The composite is a weighted blend of 9 inputs, each scored 0–100. Each bar is that input's sub-score; the figure is the points it added to the 100-point composite (weight × sub-score).
- Cash flow +30.0/30.0
- ARV discount +15.0/15.0
- 1% rule +10.0/10.0
- DSCR +10.0/10.0
- Rent growth +3.8/5.0
- Livability +3.1/5.0
- Condition / age +2.5/5.0
- Schools +1.2/10.0
- Appreciation +0.0/10.0
$55,000
🖨 Deal sheet (PDF) 📄 Offer letter ✓ Due diligence
Key facts
- 7,500 sq ft lot
- 3 parking spots
- Built 1950
Property features AI
Exterior
- Parking: Three parking spaces total; One covered space; One carport space; Gravel parking surface
- Security: Smoke detector(s)
- Utilities: Public water; Public sewer; Natural gas available and connected; Electricity available; Cable available; Water connected; Sewer connected
- Home design: Single-family residence; One story (single level); City street frontage; 50 x 150 lot dimensions
- Construction: Vinyl siding; Concrete perimeter foundation
- Exterior features: Covered front and rear porches; Covered patio/porch; Chain link fencing in the back yard; Shed(s)
Interior
- Bedrooms: Three bedrooms on the main level; Five total rooms
- Flooring: Carpet; Linoleum; Wood
- Bathrooms: One full bathroom on the main level
- Heating & cooling: Natural gas heating; Window unit(s) for cooling
- Interior features: Carpet, linoleum, and wood flooring; Smoke detector(s)
- Laundry & utility: Washer hookup; Electric dryer hookup
Neighborhood map
What this means for you Summary
Snapshot
- This is a 3-bed/1.0-bath single-family listed at $55k.
Deal economics
- At list price, monthly cash flow is $984 ($12k/yr) — positive.
- The deal already cash-flows at list — no discount required.
- Meets the 1% rule at list price ($2k rent vs $55k).
- Recommended offer: $48k (12.0% below list) — sets the bar for market timing.
- Cap rate 27.8% vs local median 3.5% in Jackson — top-decile yield for the area; either an underpriced asset or a hidden risk that comps aren't pricing in. Stress-test before assuming the spread holds.
Location & tenants
- Location reads 62/100 on livability (#216 in TN) — a middle-class / working-renter tenant base. Strengths: cost of living A+, housing A+; Watch: health & safety C-, crime F, amenities F.
- Madison County (urban): math 10% / reading 17% proficiency, ranked #131 of 139 in TN (top 94%) — low school quality limits family demand, transient renter base, plan for 1-2y turnover; 68% free/reduced lunch — lower-income household profile, screen leases tightly.
- Zoned schools: Jackson Career Technology Magnet Elementary (math 3% / reading 5%, grade F, #310 of 333 statewide, top 94%, 388 students, 0% FRL); South Side High School (math 10% / reading 15%, grade F, #257 of 332 statewide, top 78%, 810 students, 0% FRL) — zoned schools average 0% FRL vs 68% district-wide (68 pts lower); this property's tenant base skews higher-income than the district average.
- Market conditions: Rents rising fast (+5.2%/yr); 255 active listings in the ZIP; 1 comparable units currently listed for rent nearby; lower-income renter base — watch delinquency; 247 units permitted in Madison County in 2024 (0 in 5+ unit buildings).
- At $1,676/mo this rent would consume 47% of the median local household income ($43k/yr) (locally 1701% of renters already pay >50% of income on rent) — very limited rent-growth headroom before tenants either downsize or default.
Forward outlook
- Local home prices are declining (-3.0%/yr); year-one equity from $380 of loan paydown is wiped out by about $2k of value loss. Plan a longer hold.
- Madison County population projected at -12% by 2050 — secular population decline; favor cash flow + early exit over multi-decade hold.
- At projected returns (-3.0% appreciation + 5.2% rent growth), your $15k cash investment doubles in ~2 years — after that, you're playing with house money.
Negotiation context
- It's been on market 265 days — a 12% lower offer ($48k) is reasonable based on typical stale-listing flexibility.
- 2 sale attempts; this cycle's ask has dropped $10k (15%) from the opening price — seller is motivated, your offer sets the floor, not the list.
Risks & watch-outs
- Watch-outs: built in 1950 — expect roof / HVAC / electrical / plumbing capex.
- Climate carrying-cost: extreme-heat days projected 7→21/yr by 2055 (HVAC capex compounding) — expect insurance premiums to compound above CPI over the hold.
Questions for the listing agent
- It's been on market 265 days. Have you received any prior offers? Is the seller open to a 12% concession, seller financing, or rate buy-down credit?
- Built in 1950 — when were the roof, HVAC, electrical panel, plumbing, and water heater last replaced?
- Why hasn't it sold? Are there any deal-killer items the seller is aware of (foundation, flood, title, zoning, code violations)?
- Is there a deadline driving the sale (1031 exchange, divorce, estate, relocation)? That informs how much negotiation room exists.
- Schools are F-rated, which usually means shorter tenancies and higher turnover. Who's the typical renter profile here, and what's been the actual vacancy rate?
- Crime grade is F in this area — have there been break-ins, vandalism, or insurance claims at this property in the last 3 years? What carrier currently insures it and at what premium?
- What's the average days-on-market for RENTAL listings here right now (not sales)? A rising rental-DOM trend means longer vacancies and softer asking-rent achievability than the comps imply.
- What's the recent tenant-quality profile in this submarket — average credit score on applications, eviction rate, late-payment / NSF rate, and stable-employment percentage? A property-management company in the area should have these aggregated.
- How much new for-sale + rental construction is in the pipeline within 1–3 miles? Heavy new supply typically softens prices + rents 12–24 months out; constrained supply supports both.
Investment metrics
- 1% rule
- 3.05% ✓
- Cap rate
- 27.77%
- Cash-on-cash
- 76.70%
- DSCR
- 4.41
- GRM
- 2.7
CMA / ARV
- ARV (on-the-fly)
- $108,543
- Comps found
- 12
Show comp detail 12 sales within ~0.75 mi
| Address | Dist | Beds/Ba | Sqft | Sold | Price | $/sf | Match |
|---|---|---|---|---|---|---|---|
| 129 Peabody Ave | 0.14mi | 2/1.0 (-1) | 1,119 (0%) | 11mo | $170,000 | $152 | 80 |
| 1112 E Chester St | 0.20mi | 3/1.0 | 1,105 (-1%) | 16mo | $39,900 | $36 | 76 |
| 201 N Hays Ave | 0.49mi | 3/1.0 | 1,190 (+6%) | 8mo | $56,000 | $47 | 60 |
| 202 S Lindsey St | 0.34mi | 3/2.0 | 1,243 (+11%) | 6mo | $120,000 | $97 | 57 |
| 241 S Lindsey St | 0.42mi | 3/2.0 | 1,260 (+13%) | 0mo | $125,000 | $99 | 55 |
| 33 Holland | 0.46mi | 3/1.0 | 1,000 (-11%) | 7mo | $115,000 | $115 | 55 |
| 214 Peabody Ave | 0.18mi | 2/1.0 (-1) | 978 (-13%) | 14mo | $53,500 | $55 | 54 |
| 47 Regency Dr | 0.55mi | 3/1.5 | 1,156 (+3%) | 15mo | $100,000 | $87 | 54 |
| 60 Altamont Dr | 0.74mi | 3/1.0 | 1,215 (+9%) | 4mo | $55,000 | $45 | 48 |
| 43 Carnell St | 0.75mi | 3/1.5 | 1,217 (+9%) | 2mo | $74,000 | $61 | 47 |
| 344 Phillips St | 0.68mi | 3/1.0 | 963 (-14%) | 1mo | $129,900 | $135 | 44 |
| 163 Cartmell St | 0.61mi | 3/2.0 | 1,277 (+14%) | 9mo | $215,000 | $168 | 37 |
Match score weights: distance 35% · size 25% · config 20% · recency 20%. Top-matched comps best support the ARV.
Projected returns pro-forma
-3.0% appreciation · 5.19% rent growth · sell at horizon
- IRR
- 79.1%
- Equity multiple
- 4.74×
- Total profit
- $57,555
- Equity at exit
- $8,201
- IRR
- 83.1%
- Equity multiple
- 10.55×
- Total profit
- $147,045
- Equity at exit
- $4,755
Cash invested: $15,400 (down + closing). Projections, not guarantees.
Landlord ↔ Tenant lean methodology
- Overall (STATE)
- 87 Strongly Landlord-Friendly
- State Tennessee
- 87 Strongly Landlord-Friendly · R+13
- County
- — inherits STATE
- City
- — inherits STATE
ZIP-level market 38301
- Rents YoY
- 5.2%
- Active inventory
- 255
- Price-to-rent
- 2.7×
Monthly cashflow live
- Estimated rent
- $1,676 medium interval (Pro) →
- Mortgage (P&I)
- −$288
- Tax from tax record
- −$29 /mo · $344/yr
- Insurance
- −$23
- HOA
- −$0
- Vacancy / Maint / Mgmt
- −$352
- Net cashflow
- $984
Break-even live
Sensitivity live
| Price | -10% $1,015 | -5% $1,000 | +0% $984 | +5% $969 | +10% $953 |
|---|---|---|---|---|---|
| Rent | -10% $852 | -5% $918 | +0% $984 | +5% $1,051 | +10% $1,117 |
| Rate | -1.0pp $1,012 | -0.5pp $998 | base $984 | +0.5pp $970 | +1.0pp $956 |
UW: 25.0% down · 7.5% · 30yr · 1.5% tax · 5.0% vac · 8.0% maint · 8.0% mgmt
Financing live
Cash to close
- Down payment
- $13,750
- Closing costs
- $1,650
- Reserves months
- —
- Total cash needed
- —
Loan-product check · same deal, 3 products live
Conventional
25% down · 7.5% · 30yr
- Down + closing
- —
- Monthly P&I
- —
- Monthly cashflow
- —
- DSCR
- —
- Eligible?
- —
Personal DTI + credit; lowest rate.
DSCR
20% down · 8.5% · 30yr
- Down + closing
- —
- Monthly P&I
- —
- Monthly cashflow
- —
- DSCR
- —
- Eligible?
- —
No personal income docs; deal must DSCR.
Hard money
10% down · 12.0% · 12mo
- Down + closing
- —
- Monthly P&I
- —
- Monthly cashflow
- —
- DSCR
- —
- Eligible?
- —
Short-term bridge; refi at stabilization.
Rent comps 1 comps
| Address | Beds | Baths | Sqft | Rent | $/sqft | DOM | Units | Dist |
|---|---|---|---|---|---|---|---|---|
| 102 Jackson Walk Plz Jackson, TN | 1.0–3.0 | 1.0–2.5 | 1082 | $2,600 | $2.40 | 45d | 1 | 1.17mi |
Listing history 23 events
-
2026-06-17status $55,000 Pending 265 DOM
-
2026-06-17days on market $55,000 Active 265 DOM
-
2026-06-16days on market $55,000 Active 264 DOM
-
2026-06-15days on market $55,000 Active 263 DOM
-
2026-06-14days on market $55,000 Active 261 DOM
-
2026-06-13days on market $55,000 Active 260 DOM
-
2026-06-10days on market $55,000 Active 258 DOM
-
2026-06-09days on market $55,000 Active 257 DOM
-
2026-06-08days on market $55,000 Active 256 DOM
-
2026-06-07days on market $55,000 Active 255 DOM
-
2026-06-05days on market $55,000 Active 252 DOM
-
2026-06-03days on market $55,000 Active 251 DOM
-
2026-06-02days on market $55,000 Active 250 DOM
-
2026-06-01days on market $55,000 Active 249 DOM
-
2026-05-31days on market $55,000 Active 248 DOM
-
2026-05-30days on market $55,000 Active 247 DOM
-
2026-04-25price $55,000
-
2026-03-24price $59,000
-
2026-02-09status Active
-
2026-01-19historical
-
2025-11-25status Pending
-
2025-08-26price $60,000
-
2025-07-09$65,000 Active
ⓘ Source: listings_history table (triggers on properties + properties_extension) + one-shot
backfill from property_details.listing_events for pre-trigger history.
Tax reassessment forecast TN · Resets to sale price
- Current annual tax
- $344 · $29/mo
- Projected year-2 tax
- $390 · $33/mo
- Expected delta
- +$46/yr (+$4/mo · 13.5%)
ⓘ Screening estimate from a state-policy table — verify with the county assessor before closing.
Climate risk First Street
- Flood 1/10 Low FEMA zone X (unshaded) · 0% chance over 30 yrs
- Wildfire 1/10 Low
- Heat 7/10 Severe 7 d/yr ≥108°F today · 21 d/yr by 30 yrs out
- Wind 4/10 Moderate 16% chance of damaging wind over 30 yrs
- Air quality 1/10 Low 0 unhealthy d/yr today · 0 by 30 yrs out
Nearby sold comps map
Loading sold comps map…
Walkable amenities ~0.75 mi
Loading nearby amenities…
Taxation est. · year 1
- Rental income
- $20,116
- − Mortgage interest
- −$3,081
- − Property taxes
- −$344
- − Insurance
- −$275
- − Repairs & maintenance
- −$1,609
- − Management
- −$1,609
- − Depreciation
- −$1,600
- Taxable income
- $11,598
- Est. tax owed @ 24.0%
- −$2,784
- After-tax cash flow
- $9,028/yr
For passive investors: Depreciation is non-cash, so a rental often shows a tax loss while cash-flowing — sheltering income. Rental losses are passive: they offset passive income freely, and up to $25,000/yr can offset ordinary (W-2) income if you actively participate and your MAGI is under $100k (phasing out to $0 by $150k); unused losses carry forward. On sale, claimed depreciation is recaptured at up to 25%, and gains may owe capital-gains tax (a 1031 exchange can defer both). Figures are a year-1 estimate at your 24.0% rate — not tax advice; consult a CPA.
Schools (NCES district)
- District
- Madison County
- NCES district ID
- 4702580
- Math proficiency
- 10% ▼ -11.00%
- Reading proficiency
- 17% ▼ -4.00%
- Median HH income
- $42,015
- Composite
- 11.74/100
- National rank
- #9687
- State rank
- #131 of 139 in TN
Livability — Jackson
- Score
- 62/100
- State rank
- #216
- US rank
- #16488
Category grades
Schools grade is shown separately in the Schools card above.
Census & demographics
- Census place
- Jackson, TN
- County
- Madison County · 87,024 people
- City population
- 87,024
- Metro
- Jackson, TN
- Population (ZIP)
- 33,536
- Household income
- $43,227
- Rent vs Own
- Severe rent burden
- 1701.0
Population outlook (Madison County) Hauer SSP2
- Today (2025)
- 95,952 people
- By 2030
- 94,264 · -1.8%
- By 2040
- 89,607 · -6.6%
- By 2050
- 84,133 · -12.3%
- By 2075
- 72,215 · -24.7%
- By 2100
- 62,062 · -35.3%
Race, ethnicity, and origin ACS 2023
- Neighborhood character
- Diverse neighborhood (Simpson 0.57)
- Race & ethnicity
- Black 50% White 42% Two or more races 5% Hispanic / Latino 4%
- Common ancestry
- Slovak 1% Serbian 1% Portuguese 1%
- Foreign-born
- 3% · Canada
- Languages at home
- 96% English-only · Spanish 3%
Political lean MEDSL · Madison
- 2024 margin
- R (+18.2) · D 40.3% · R 58.5% · Other 1.2%
- 2008→2024 swing
- +3.4pp toward D · 2008: -21.6pp · 2024: -18.2pp
- All cycles
- 2024: R+18.2 2020: R+12.9 2016: R+15.6 2012: R+8.9 2008: R+21.6
Not yet ingested
- Civics
- —
Market trends
- HPI YoY
- ▼ -112.26%
- Current HPI
- 162.2273
- Rent YoY
- ▲ 5.19%
- Metro
- Jackson, TN
- State GDP YoY
- ▲ 2.78%
- F500 in state
- 22
Industry mix (Fortune 500 HQ in TN)
| Industry | F500 HQs | Revenue |
|---|---|---|
| Healthcare | 3 | $91B |
|
||
| Retail | 3 | $72B |
|
||
| Transportation / Logistics | 1 | $88B |
|
||
| Paper / Packaging | 1 | $19B |
|
||
| Insurance | 1 | $13B |
|
||
| Energy | 1 | $12B |
|
||
Price history
-15.4% since first listed7 events — show timeline
- 2026-04-25 Price Changed $55,000 CWTAR
- 2026-03-24 Price Changed $59,000 CWTAR
- 2026-02-09 Relisted — CWTAR
- 2026-01-19 Delisted — CWTAR
- 2025-11-25 Pending — CWTAR
- 2025-08-26 Price Changed $60,000 CWTAR
- 2025-07-09 Listed $65,000 CWTAR
Property tax history
+0.8%/yrLatest (2025): $344 · +0.0% YoY. Source: county tax records.
Cash-flow waterfall
monthlySold comps — $/sqft
last 12 mo · ≤1 miLoading sold comps…