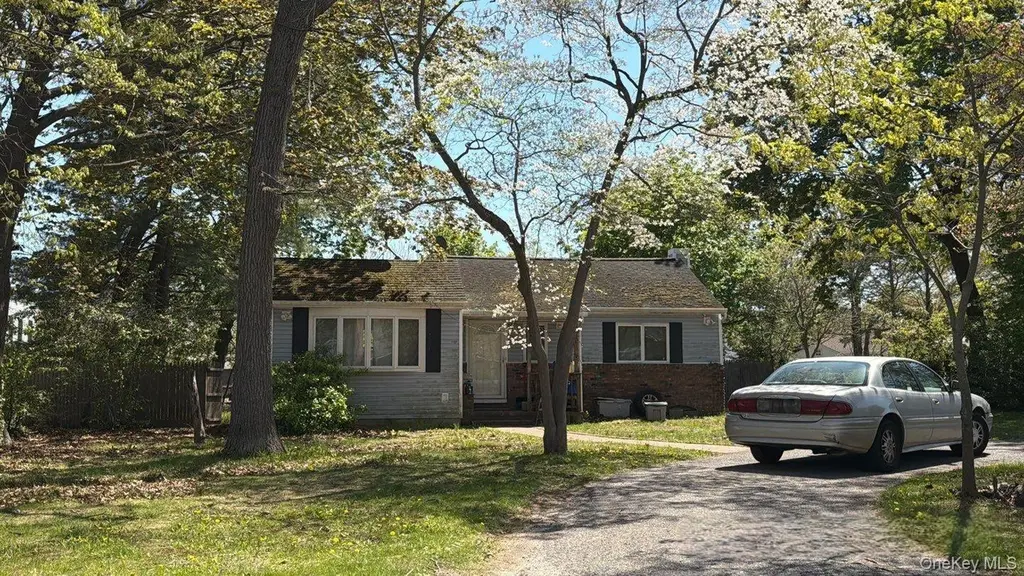
50 Ridgedale Ave · Farmingville, NY
Flood risk 1/10 · Minimal
- FEMA flood zone
- X (unshaded)
- Chance of flooding over 30 yrs
- 0.0%
- Est. flood insurance / yr
- $473 – $860
Fire risk 1/10 · Minimal
- Est. fire insurance / yr
- $691 – $1,283
Heat risk 4/10 · Minor
- Hot days now (above 94°F)
- 7 days/yr
- Hot days in 30 yrs
- 17 days/yr
Wind risk 6/10 · Moderate
- Chance of severe wind over 30 yrs
- 77.0%
Air-quality risk 3/10 · Minor
- Unhealthy air days now
- 3 days/yr
- Unhealthy air days in 30 yrs
- 4 days/yr
Risk factors via First Street. Map © Google.
Why this score? — see what drove the C- grade
The composite is a weighted blend of 9 inputs, each scored 0–100. Each bar is that input's sub-score; the figure is the points it added to the 100-point composite (weight × sub-score).
- ARV discount +15.0/15.0
- Cash flow +13.0/30.0
- Schools +6.6/10.0
- 1% rule +4.3/10.0
- DSCR +3.9/10.0
- Livability +3.4/5.0
- Rent growth +2.5/5.0
- Condition / age +2.5/5.0
- Appreciation +0.0/10.0
$329,950
🖨 Deal sheet 📄 Offer letter ✓ Due diligence
Listing remarks
This Ranch Style Home Features 2 Bedrooms, Full Bath, Formal Dining Room & Eat In Kitchen. The information provided is estimated to the best of our abilities at this time.
Key facts
- 0.34 acre lot
- Built 1939
- Listed 37 days
Property features AI
Exterior
- Parking: Driveway; No carport
- Utilities: Sewer: Other; Utilities: See remarks
- Home design: Single family residence; One story
- Construction: Frame construction
- Exterior features: Front yard; Back yard; Not waterfront
Interior
- Kitchen: Eat-in kitchen
- Bedrooms: One-level home
- Bathrooms: 1 full bathroom
- Heating & cooling: Hot water heating; Oil heating; No central cooling
- Interior features: First-floor bedroom; First-floor full bath; Eat-in kitchen; Formal dining
- Laundry & utility: Basement (partial)
Neighborhood map
What this means for you Summary
Snapshot
- This is a 2-bed/1.0-bath single-family listed at $330k.
Deal economics
- At list price, monthly cash flow is $-15 ($-184/yr) — negative.
- To cash-flow at today's rent, offer at most $327k (0.8% below list).
- To meet the 1% rule (rent ≥ 1% of price), the offer needs to be $307k (7.1% below list).
- Recommended offer: $307k (7.1% below list) — sets the bar for 1% rule.
- Cap rate 6.2% vs local median 4.3% in Farmingville — top-decile yield for the area; either an underpriced asset or a hidden risk that comps aren't pricing in. Stress-test before assuming the spread holds.
Location & tenants
- Location reads 67/100 on livability (#592 in NY) — a middle-class / working-renter tenant base. Strengths: employment A+, housing A+, health & safety B; Watch: amenities F, commute F, cost of living F.
- Sachem Central School District (suburban): math 69% / reading 76% proficiency, ranked #86 of 590 in NY (top 15%) — strong family-tenant draw, lease renewals of 3-5y typical; only 15% free/reduced lunch — higher-income household profile.
- Zoned schools: Lynwood Avenue School (math 57% / reading 67%, grade B, #675 of 2,108 statewide, top 35%, 572 students, 37% FRL); Sagamore Middle School (math 44% / reading 57%, grade C, #259 of 729 statewide, top 36%, 933 students, 30% FRL); Sachem High School East (math 94% / reading 93%, grade A+, #131 of 1,100 statewide, top 13%, 2,082 students, 28% FRL) — zoned schools average 32% FRL vs 15% district-wide (17 pts higher); higher-poverty schools than district average — tighter screening recommended.
- Market conditions: 66 active listings in the ZIP; 4 comparable units currently listed for rent nearby; rentals at typical pace (median 24d on market — plan ~3-4 weeks tenant-placement turnaround); 1,366 units permitted in Suffolk County in 2024 (216 in 5+ unit buildings).
Forward outlook
- Local home prices are declining (-3.0%/yr); year-one equity from $2k of loan paydown is wiped out by about $10k of value loss. Plan a longer hold.
- Suffolk County population projected to shrink 5% by 2050 — rents likely to lag national; underwrite the cash flow, not the appreciation.
Negotiation context
- It's been on market 37 days — a 3% lower offer ($320k) is reasonable based on typical stale-listing flexibility.
- 4 sale attempts since 13y ago with the ask held roughly flat each time — persistent listings suggest the price (not the market) is what's stuck; bring a comps-based counter.
- Current owner paid $110k; list at $330k implies a 200% gain — meaningful room to come down on a strong offer.
Risks & watch-outs
- Watch-outs: built in 1939 — expect roof / HVAC / electrical / plumbing capex.
- Climate carrying-cost: major wind risk, 77% chance of damaging wind over 30y — expect insurance premiums to compound above CPI over the hold.
Questions for the listing agent
- What do current leases actually rent for vs. the listed asking? Can we see a recent rent roll and the last 12 months of T-12 income?
- It's been on market 37 days. Have you received any prior offers? Is the seller open to a 7% concession, seller financing, or rate buy-down credit?
- Built in 1939 — when were the roof, HVAC, electrical panel, plumbing, and water heater last replaced?
- Is there a deadline driving the sale (1031 exchange, divorce, estate, relocation)? That informs how much negotiation room exists.
- Schools are B-rated — typically a magnet for longer-tenancy family renters. What's the average tenant stay here, and is there a school-zone premium baked into asking?
- What's the average days-on-market for RENTAL listings here right now (not sales)? A rising rental-DOM trend means longer vacancies and softer asking-rent achievability than the comps imply.
- What's the recent tenant-quality profile in this submarket — average credit score on applications, eviction rate, late-payment / NSF rate, and stable-employment percentage? A property-management company in the area should have these aggregated.
- How much new for-sale + rental construction is in the pipeline within 1–3 miles? Heavy new supply typically softens prices + rents 12–24 months out; constrained supply supports both.
Investment metrics
- 1% rule
- 0.93% ✗
- Cap rate
- 6.24%
- Cash-on-cash
- -0.20%
- DSCR
- 0.99
- GRM
- 9.0
CMA / ARV
- ARV (median comp)
- $561,184
- List price
- $329,950
- Delta
- -41.20%
- Verdict
- UNDERPRICED
- Comps
- 20 within 1.0 mi
Show comp detail 3 sales within ~0.75 mi
| Address | Dist | Beds/Ba | Sqft | Sold | Price | $/sf | Match |
|---|---|---|---|---|---|---|---|
| 168 Woodycrest Dr | 0.16mi | 3/3.0 (+1) | 938 (+1%) | 2mo | $575,000 | $613 | 76 |
| 5523 Expressway Dr N | 0.27mi | 2/1.0 | 792 (-15%) | 12mo | $310,000 | $391 | 53 |
| 25 Powell Ave | 0.61mi | 3/1.0 (+1) | 1,000 (+8%) | 8mo | $575,000 | $575 | 47 |
Match score weights: distance 35% · size 25% · config 20% · recency 20%. Top-matched comps best support the ARV.
Projected returns pro-forma
-3.0% appreciation · 3.0% rent growth · sell at horizon
- IRR
- -16.6%
- Equity multiple
- 0.41×
- Total profit
- $-54,298
- Equity at exit
- $49,197
- IRR
- -8.3%
- Equity multiple
- 0.48×
- Total profit
- $-47,956
- Equity at exit
- $28,528
Cash invested: $92,386 (down + closing). Projections, not guarantees.
Landlord ↔ Tenant lean methodology
- Overall (STATE)
- 15 Strongly Tenant-Friendly
- State New York
- 15 Strongly Tenant-Friendly · D+10
- County
- — inherits STATE
- City
- — inherits STATE
ZIP-level market 11738
- Active inventory
- 66
- Price-to-rent
- 9.0×
Monthly cashflow live
- Estimated rent
- $3,066 medium interval (Pro) →
- Mortgage (P&I)
- −$1,730
- Tax from tax record
- −$570 /mo · $6,835/yr
- Insurance
- −$137
- HOA
- −$0
- Vacancy / Maint / Mgmt
- −$644
- Net cashflow
- $-15
Break-even live
UW: 25.0% down · 7.5% · 30yr · 1.5% tax · 5.0% vac · 8.0% maint · 8.0% mgmt
Financing live
Cash to close
- Down payment
- $82,488
- Closing costs
- $9,898
- Reserves months
- —
- Total cash needed
- —
Loan-product check · same deal, 3 products live
Conventional
25% down · 7.5% · 30yr
- Down + closing
- —
- Monthly P&I
- —
- Monthly cashflow
- —
- DSCR
- —
- Eligible?
- —
Personal DTI + credit; lowest rate.
DSCR
20% down · 8.5% · 30yr
- Down + closing
- —
- Monthly P&I
- —
- Monthly cashflow
- —
- DSCR
- —
- Eligible?
- —
No personal income docs; deal must DSCR.
Hard money
10% down · 12.0% · 12mo
- Down + closing
- —
- Monthly P&I
- —
- Monthly cashflow
- —
- DSCR
- —
- Eligible?
- —
Short-term bridge; refi at stabilization.
Rent comps 4 comps
| Address | Beds | Baths | Sqft | Rent | $/sqft | DOM | Units | Dist |
|---|---|---|---|---|---|---|---|---|
| 98 Cassa Loop Unit 98 Holtsville, NY | 1.0 | 1.0 | 975 | $2,850 | $2.92 | 24d | 1 | 1.19mi |
| 2 Victorian Ct Holtsville, NY | 1.0–2.0 | 1.0–2.0 | 1037 | $3,295 | $3.18 | 5d | 1 | 1.23mi |
| 19 Cassa Loop Unit 19 Holtsville, NY | 1.0 | 1.0 | 975 | $2,875 | $2.95 | 24d | 1 | 1.31mi |
| 287 Cassa Loop Unit 287 Holtsville, NY | 2.0 | 2.0 | 1100 | $3,295 | $3.00 | 43d | 1 | 1.34mi |
Listing history 24 events
-
2026-06-18days on market $329,950 Active 37 DOM
-
2026-06-17days on market $329,950 Active 36 DOM
-
2026-06-16days on market $329,950 Active 35 DOM
-
2026-06-15days on market $329,950 Active 34 DOM
-
2026-06-13days on market $329,950 Active 32 DOM
-
2026-06-13days on market $329,950 Active 31 DOM
-
2026-06-09days on market $329,950 Active 28 DOM
-
2026-06-08days on market $329,950 Active 27 DOM
-
2026-06-07days on market $329,950 Active 26 DOM
-
2026-06-04days on market $329,950 Active 23 DOM
-
2026-06-03days on market $329,950 Active 22 DOM
-
2026-06-02days on market $329,950 Active 21 DOM
-
2026-06-01days on market $329,950 Active 20 DOM
-
2026-05-31days on market $329,950 Active 19 DOM
-
2026-05-11$329,950 Active 175-char remark
-
2024-09-13historical
-
2024-08-06$389,990 Active
-
2024-08-05historical
-
2014-05-21historical
-
2014-04-30$162,500
-
2014-02-01historical
-
2013-12-11$162,500
-
1997-07-29soldstatus $110,000
-
1988-07-15soldstatus $97,000
ⓘ Source: listings_history table (triggers on properties + properties_extension) + one-shot
backfill from property_details.listing_events for pre-trigger history.
Tax reassessment forecast NY · Partial reset (capped growth)
- Current annual tax
- $6,835 · $570/mo
- Projected year-2 tax
- $6,835 · $570/mo
- Expected delta
- $0/yr ($0/mo · -0.0%)
ⓘ Screening estimate from a state-policy table — verify with the county assessor before closing.
Climate risk First Street
- Flood 1/10 Low FEMA zone X (unshaded) · 0% chance over 30 yrs
- Wildfire 1/10 Low
- Heat 4/10 Moderate 7 d/yr ≥94°F today · 17 d/yr by 30 yrs out
- Wind 6/10 Major 77% chance of damaging wind over 30 yrs
- Air quality 3/10 Moderate 3 unhealthy d/yr today · 4 by 30 yrs out
Nearby sold comps map
Loading sold comps map…
Walkable amenities ~0.75 mi
Loading nearby amenities…
Taxation est. · year 1
- Rental income
- $36,791
- − Mortgage interest
- −$18,482
- − Property taxes
- −$6,835
- − Insurance
- −$1,650
- − Repairs & maintenance
- −$2,943
- − Management
- −$2,943
- − Depreciation
- −$9,599
- Taxable loss
- −$5,661
- Est. tax savings @ 24.0%
- +$1,359
- After-tax cash flow
- $1,175/yr
For passive investors: Depreciation is non-cash, so a rental often shows a tax loss while cash-flowing — sheltering income. Rental losses are passive: they offset passive income freely, and up to $25,000/yr can offset ordinary (W-2) income if you actively participate and your MAGI is under $100k (phasing out to $0 by $150k); unused losses carry forward. On sale, claimed depreciation is recaptured at up to 25%, and gains may owe capital-gains tax (a 1031 exchange can defer both). Figures are a year-1 estimate at your 24.0% rate — not tax advice; consult a CPA.
Schools (NCES district)
- District
- Sachem Central School District
- NCES district ID
- 3625350
- Math proficiency
- 69% ▬ 0.00%
- Reading proficiency
- 76% ▲ 12.00%
- Median HH income
- $92,968
- Composite
- 65.53/100
- National rank
- #472
- State rank
- #86 of 590 in NY
Livability — Farmingville
- Score
- 67/100
- State rank
- #592
- US rank
- #10732
Category grades
Schools grade is shown separately in the Schools card above.
Census & demographics
- Census place
- Farmingville, NY
- City population
- 20,246
- Population (ZIP)
- 20,246
Population outlook (Suffolk County) Hauer SSP2
- Today (2025)
- 1,505,262 people
- By 2030
- 1,498,318 · -0.5%
- By 2040
- 1,471,101 · -2.3%
- By 2050
- 1,424,848 · -5.3%
- By 2075
- 1,337,157 · -11.2%
- By 2100
- 1,217,720 · -19.1%
Race, ethnicity, and origin ACS 2023
- Neighborhood character
- Diverse neighborhood (Simpson 0.57)
- Race & ethnicity
- White 61% Hispanic / Latino 23% Two or more races 8% Black 6% Asian 5% Native American 1%
- Hispanic origin (detail)
- Mexican 1% Puerto Rican 7% Dominican 2%
- Common ancestry
- Romanian 3% Estonian 2% Russian 2%
- Foreign-born
- 17% · Canada, Jamaica, China
- Languages at home
- 74% English-only · Spanish 13% Other Indo-European 8% Other Asian/Pacific 1%
Political lean MEDSL · Suffolk
- 2024 margin
- Lean R (+10.0) · D 45.0% · R 55.0%
- 2008→2024 swing
- -16.0pp toward R · 2008: 6.0pp · 2024: -10.0pp
- All cycles
- 2024: R+10.0 2020: R+0.0 2016: R+8.2 2012: D+2.9 2008: D+6.0
Not yet ingested
- Civics
- —
Market trends
- HPI YoY
- ▼ -605.51%
- Current HPI
- 364.6287
- Rent YoY
- —
- Metro
- —
- State GDP YoY
- ▲ 2.60%
- F500 in state
- 92
Industry mix (Fortune 500 HQ in NY)
| Industry | F500 HQs | Revenue |
|---|---|---|
| Financial Services | 10 | $950B |
|
||
| Consumer Goods | 9 | $162B |
|
||
| Insurance | 4 | $225B |
|
||
| Telecommunications | 2 | $144B |
|
||
| Pharmaceuticals | 2 | $112B |
|
||
| Media / Entertainment | 2 | $69B |
|
||
Price history
+240.2% since first listed10 events — show timeline
- 2026-05-11 Listed $329,950 OneKey® MLS as Distributed by MLS Grid
- 2024-09-13 Listing Removed — OneKey® MLS as Distributed by MLS Grid
- 2024-08-06 Listed $389,990 OneKey® MLS as Distributed by MLS Grid
- 2024-08-05 Coming Soon — OneKey® MLS as Distributed by MLS Grid
- 2014-05-21 Listing Removed — OneKey® MLS as Distributed by MLS Grid
- 2014-04-30 Listed $162,500 OneKey® MLS as Distributed by MLS Grid
- 2014-02-01 Listing Removed — OneKey® MLS as Distributed by MLS Grid
- 2013-12-11 Listed $162,500 OneKey® MLS as Distributed by MLS Grid
- 1997-07-29 Sold (Public Records) $110,000 Public Records
- 1988-07-15 Sold (Public Records) $97,000 Public Records
Property tax history
+3.6%/yrLatest (2025): $6,835 · +0.0% YoY. Source: county tax records.
Cash-flow waterfall
monthlySold comps — $/sqft
last 12 mo · ≤1 miLoading sold comps…