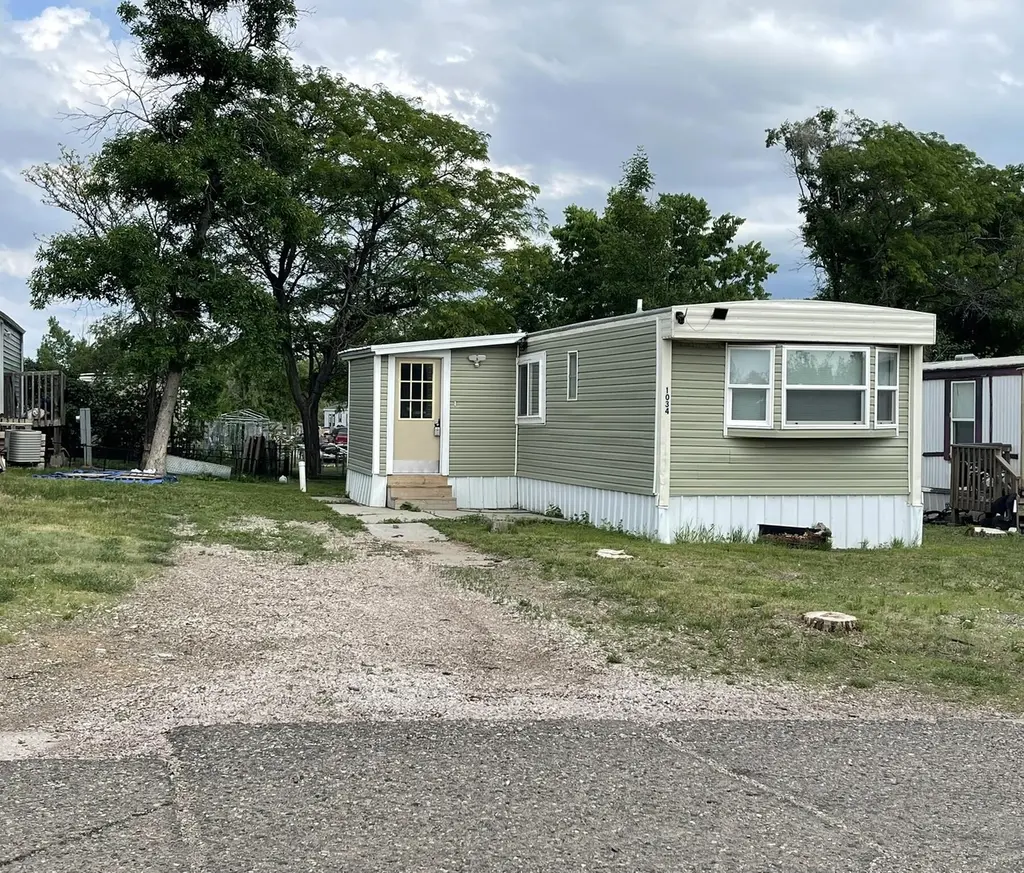
1034 N Euclid Ave · Pierre, SD
Flood risk No data
- FEMA flood zone
- —
- Chance of flooding over 30 yrs
- —
- Est. flood insurance / yr
- —
Fire risk No data
- Est. fire insurance / yr
- —
Heat risk No data
- Hot days now (above threshold)
- —
- Hot days in 30 yrs
- —
Wind risk No data
- Chance of severe wind over 30 yrs
- —
Air-quality risk No data
- Unhealthy air days now
- —
- Unhealthy air days in 30 yrs
- —
Risk factors via First Street. Map © Google.
Why this score? — see what drove the B grade
The composite is a weighted blend of 9 inputs, each scored 0–100. Each bar is that input's sub-score; the figure is the points it added to the 100-point composite (weight × sub-score).
- Cash flow +30.0/30.0
- 1% rule +10.0/10.0
- DSCR +10.0/10.0
- ARV discount +7.5/15.0
- Schools +4.4/10.0
- Livability +3.7/5.0
- Rent growth +2.5/5.0
- Condition / age +2.5/5.0
- Appreciation +0.0/10.0
$30,000
🖨 Deal sheet (PDF) 📄 Offer letter ✓ Due diligence
Listing remarks MLS
Opportunity is knocking!Great home for someone looking for a rental property, first home owner or maybe someone looking to down size as all of the updates have been DONE!This 3 bdrm, 2 Bath home has NEW siding, insulation, sheetrock, floor coverings, kitchen cabinets, counter tops & bathroom fixtures in primary bedroom. New panel & wiring in 2019.Lot Rent is $225.00 & includes garbage, water & sewer
Key facts
- Updated sheetrock
- Updated siding
- Updated counter tops
Tags
Property features AI
Finance
- Financial info: Annual tax amount listed
Exterior
- Home design: Single-family residence; One story
- Construction: Vinyl siding; Mobile home length 62 ft
- Exterior features: Porch
Interior
- Kitchen: Microwave; Dishwasher; Range; Refrigerator
- Flooring: Linoleum
- Bathrooms: 1 full bathroom; 1 half bathroom
- Heating & cooling: Forced air heating; Wall/window cooling units
- Interior features: Microwave, Dishwasher, Range, Refrigerator; Linoleum flooring; Seven total rooms; No basement
Neighborhood map
What this means for you Summary
Snapshot
- This is a 3-bed/1.5-bath manufactured listed at $30k.
Deal economics
- At list price, monthly cash flow is $752 ($9k/yr) — positive.
- The deal already cash-flows at list — no discount required.
- Meets the 1% rule at list price ($1k rent vs $30k).
- Recommended offer: $30k (1.5% below list) — sets the bar for market timing.
- Cap rate 36.4% vs local median 3.4% in Pierre — top-decile yield for the area; either an underpriced asset or a hidden risk that comps aren't pricing in. Stress-test before assuming the spread holds.
Location & tenants
- Location reads 74/100 on livability (#31 in SD, #4,502 nationally) — a middle-class / working-renter tenant base. Strengths: cost of living A+, housing A+, health & safety A+; Watch: crime F, amenities F, commute F.
- Pierre School District 32-2 (town): math 47% / reading 54% proficiency, ranked #24 of 59 in SD (top 41%) — acceptable for families but not a draw, mixed tenant base, ~2y average lease.
- Zoned schools: Jefferson Elementary - 06 (math 44% / reading 45%, grade F, #144 of 253 statewide, top 63%, 430 students, 34% FRL); Georgia Morse Middle School - 02 (math 46% / reading 53%, grade C, #55 of 143 statewide, top 46%, 684 students, 26% FRL); T F Riggs High School - 01 (math 42% / reading 67%, grade C-, #53 of 151 statewide, top 41%, 842 students, 17% FRL) — zoned schools at 26% FRL track the district average.
- Market conditions: 130 active listings in the ZIP; solid renter incomes; 135 units permitted in Hughes County in 2024 (115 in 5+ unit buildings).
- This rent is only 18% of the median local income ($82k/yr) — well below the 30% rent-burden line; pricing power to push rent on renewal without tenant pushback.
Forward outlook
- Local home prices are declining (-3.0%/yr); year-one equity from $207 of loan paydown is wiped out by about $900 of value loss. Plan a longer hold.
- Hughes County population projected at +14% by 2050 — modest demand growth; plan on rents tracking national, not racing it.
- At projected returns (-3.0% appreciation + 3.0% rent growth), your $8k cash investment doubles in ~2 years — after that, you're playing with house money.
Negotiation context
- It's been on market 17 days — a 2% lower offer ($30k) is reasonable based on typical stale-listing flexibility.
- 2 sale attempts since 2y ago with the ask held roughly flat each time — persistent listings suggest the price (not the market) is what's stuck; bring a comps-based counter.
Questions for the listing agent
- Built in 1974 — when were the roof, HVAC, electrical panel, plumbing, and water heater last replaced?
- Is there a deadline driving the sale (1031 exchange, divorce, estate, relocation)? That informs how much negotiation room exists.
- Crime grade is F in this area — have there been break-ins, vandalism, or insurance claims at this property in the last 3 years? What carrier currently insures it and at what premium?
- What's the average days-on-market for RENTAL listings here right now (not sales)? A rising rental-DOM trend means longer vacancies and softer asking-rent achievability than the comps imply.
- What's the recent tenant-quality profile in this submarket — average credit score on applications, eviction rate, late-payment / NSF rate, and stable-employment percentage? A property-management company in the area should have these aggregated.
- How much new for-sale + rental construction is in the pipeline within 1–3 miles? Heavy new supply typically softens prices + rents 12–24 months out; constrained supply supports both.
Investment metrics
- 1% rule
- 4.05% ✓
- Cap rate
- 36.38%
- Cash-on-cash
- 107.45%
- DSCR
- 5.78
- GRM
- 2.1
CMA / ARV
No comps found within radius.
Projected returns pro-forma
-3.0% appreciation · 3.0% rent growth · sell at horizon
- IRR
- —
- Equity multiple
- 6.13×
- Total profit
- $43,060
- Equity at exit
- $4,473
- IRR
- —
- Equity multiple
- 12.82×
- Total profit
- $99,253
- Equity at exit
- $2,594
Cash invested: $8,400 (down + closing). Projections, not guarantees.
Landlord ↔ Tenant lean methodology
- Overall (STATE)
- 83 Strongly Landlord-Friendly
- State South Dakota
- 83 Strongly Landlord-Friendly · R+16
- County
- — inherits STATE
- City
- — inherits STATE
ZIP-level market 57501
- Active inventory
- 130
- Price-to-rent
- 2.1×
Monthly cashflow live
- Estimated rent
- $1,214 medium interval (Pro) →
- Mortgage (P&I)
- −$157
- Tax est. 1.5%
- −$38 /mo · $450/yr
- Insurance
- −$12
- HOA
- −$0
- Vacancy / Maint / Mgmt
- −$255
- Net cashflow
- $752
Break-even live
Sensitivity live
| Price | -10% $773 | -5% $762 | +0% $752 | +5% $742 | +10% $731 |
|---|---|---|---|---|---|
| Rent | -10% $656 | -5% $704 | +0% $752 | +5% $800 | +10% $848 |
| Rate | -1.0pp $767 | -0.5pp $760 | base $752 | +0.5pp $744 | +1.0pp $736 |
UW: 25.0% down · 7.5% · 30yr · 1.5% tax · 5.0% vac · 8.0% maint · 8.0% mgmt
Financing live
Cash to close
- Down payment
- $7,500
- Closing costs
- $900
- Reserves months
- —
- Total cash needed
- —
Loan-product check · same deal, 3 products live
Conventional
25% down · 7.5% · 30yr
- Down + closing
- —
- Monthly P&I
- —
- Monthly cashflow
- —
- DSCR
- —
- Eligible?
- —
Personal DTI + credit; lowest rate.
DSCR
20% down · 8.5% · 30yr
- Down + closing
- —
- Monthly P&I
- —
- Monthly cashflow
- —
- DSCR
- —
- Eligible?
- —
No personal income docs; deal must DSCR.
Hard money
10% down · 12.0% · 12mo
- Down + closing
- —
- Monthly P&I
- —
- Monthly cashflow
- —
- DSCR
- —
- Eligible?
- —
Short-term bridge; refi at stabilization.
Listing history 11 events
-
2026-06-22days on market $30,000 Active 17 DOM
-
2026-06-19days on market $30,000 Active 14 DOM
-
2026-06-18days on market $30,000 Active 13 DOM
-
2026-06-17days on market $30,000 Active 12 DOM
-
2026-06-16days on market $30,000 Active 11 DOM
-
2026-06-15days on market $30,000 Active 10 DOM
-
2026-06-14days on market $30,000 Active 8 DOM
-
2026-06-12days on market $30,000 Active 7 DOM
-
2026-06-09days on market $30,000 Active 4 DOM
-
2026-06-08days on market $30,000 Active 3 DOM
-
2026-06-07$30,000 Active 2 DOM
ⓘ Source: listings_history table (triggers on properties + properties_extension) + one-shot
backfill from property_details.listing_events for pre-trigger history.
Nearby sold comps map
Loading sold comps map…
Walkable amenities ~0.75 mi
Loading nearby amenities…
Taxation est. · year 1
- Rental income
- $14,574
- − Mortgage interest
- −$1,680
- − Property taxes
- −$450
- − Insurance
- −$150
- − Repairs & maintenance
- −$1,166
- − Management
- −$1,166
- − Depreciation
- −$873
- Taxable income
- $9,089
- Est. tax owed @ 24.0%
- −$2,181
- After-tax cash flow
- $6,844/yr
For passive investors: Depreciation is non-cash, so a rental often shows a tax loss while cash-flowing — sheltering income. Rental losses are passive: they offset passive income freely, and up to $25,000/yr can offset ordinary (W-2) income if you actively participate and your MAGI is under $100k (phasing out to $0 by $150k); unused losses carry forward. On sale, claimed depreciation is recaptured at up to 25%, and gains may owe capital-gains tax (a 1031 exchange can defer both). Figures are a year-1 estimate at your 24.0% rate — not tax advice; consult a CPA.
Schools (NCES district)
- District
- Pierre School District 32-2
- NCES district ID
- 4655260
- Math proficiency
- 47% ▼ -6.00%
- Reading proficiency
- 54% ▼ -4.00%
- Median HH income
- $57,931
- Composite
- 43.93/100
- National rank
- #2909
- State rank
- #24 of 59 in SD
Livability — Pierre
- Score
- 74/100
- State rank
- #31
- US rank
- #4502
Category grades
Schools grade is shown separately in the Schools card above.
Census & demographics
- Census place
- Pierre, SD
- County
- Hughes County · 17,326 people
- City population
- 17,326
- Metro
- Pierre, SD
- Population (ZIP)
- 17,326
- Household income
- $81,791
- Rent vs Own
- Severe rent burden
- 226.0
Population outlook (Hughes County) Hauer SSP2
- Today (2025)
- 18,429 people
- By 2030
- 18,861 · +2.3%
- By 2040
- 19,778 · +7.3%
- By 2050
- 20,979 · +13.8%
- By 2075
- 27,077 · +46.9%
- By 2100
- 36,716 · +99.2%
Race, ethnicity, and origin ACS 2023
- Neighborhood character
- Predominantly White (81%)
- Race & ethnicity
- White 81% Native American 11% Two or more races 6% Hispanic / Latino 3%
- Common ancestry
- Portuguese 12% Iranian 4% Romanian 2%
- Foreign-born
- 1% · Vietnam, Canada
- Languages at home
- 96% English-only · Spanish 2% Vietnamese 1%
Political lean MEDSL · Hughes
- 2024 margin
- Solid R (+30.1) · D 33.6% · R 63.8% · Other 2.6%
- 2008→2024 swing
- -3.4pp toward R · 2008: -26.7pp · 2024: -30.1pp
- All cycles
- 2024: R+30.1 2020: R+29.4 2016: R+33.4 2012: R+29.8 2008: R+26.7
Not yet ingested
- Civics
- —
Market trends
- HPI YoY
- ▼ -129.77%
- Current HPI
- 198.7322
- Rent YoY
- —
- Metro
- Pierre, SD
- State GDP YoY
- ▲ 0.70%
- F500 in state
- 2
Industry mix (Fortune 500 HQ in SD)
| Industry | F500 HQs | Revenue |
|---|---|---|
| Utilities | 1 | $1B |
|
||
Price history
+400.0% since first listed5 events — show timeline
- 2026-06-05 Listed $30,000 CSDBR
- 2024-06-07 Sold (MLS) $27,000 CSDBR
- 2024-06-03 Contingent — CSDBR
- 2024-05-20 Listed $30,000 CSDBR
- 2015-10-30 Sold (Public Records) $6,000 Public Records
Property tax history
+5.3%/yrLatest (2025): $31 · -1.3% YoY. Source: county tax records.
Cash-flow waterfall
monthlySold comps — $/sqft
last 12 mo · ≤1 miLoading sold comps…