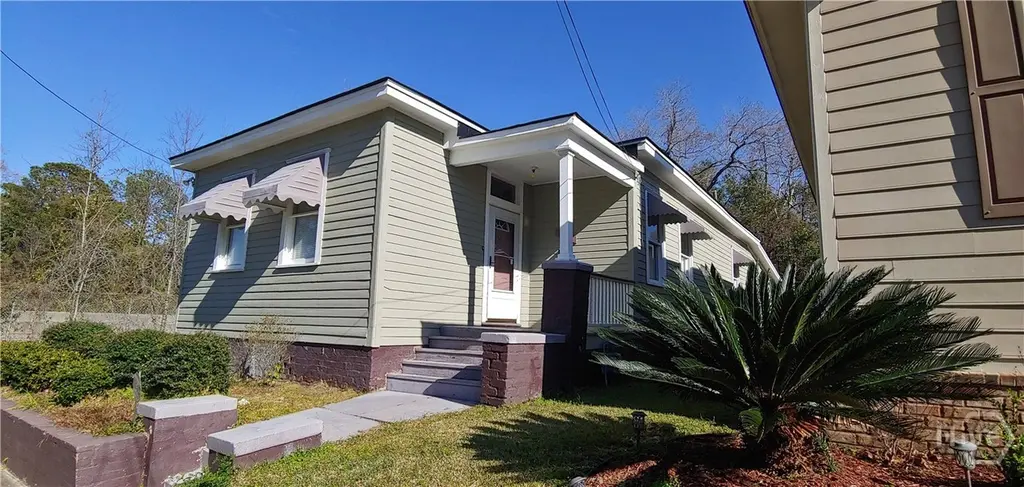
114 Adair St · Savannah, GA
Flood risk 1/10 · Minimal
- FEMA flood zone
- X (unshaded)
- Chance of flooding over 30 yrs
- 0.0%
- Est. flood insurance / yr
- $507 – $1,088
Fire risk 1/10 · Minimal
- Est. fire insurance / yr
- $963 – $1,789
Heat risk 10/10 · Severe
- Hot days now (above 107°F)
- 7 days/yr
- Hot days in 30 yrs
- 18 days/yr
Wind risk 9/10 · Severe
- Chance of severe wind over 30 yrs
- 99.0%
Air-quality risk 5/10 · Moderate
- Unhealthy air days now
- 7 days/yr
- Unhealthy air days in 30 yrs
- 8 days/yr
Risk factors via First Street. Map © Google.
Why this score? — see what drove the C grade
The composite is a weighted blend of 9 inputs, each scored 0–100. Each bar is that input's sub-score; the figure is the points it added to the 100-point composite (weight × sub-score).
- Cash flow +19.9/30.0
- ARV discount +15.0/15.0
- DSCR +6.3/10.0
- 1% rule +5.0/10.0
- Livability +4.3/5.0
- Rent growth +3.4/5.0
- Condition / age +2.5/5.0
- Schools +2.0/10.0
- Appreciation +0.0/10.0
$220,000
🖨 Deal sheet 📄 Offer letter ✓ Due diligence
Listing remarks MLS
Amazing deal on this bungalow located just minutes from downtown savannah, schools, shopping, restaurants, hospitals and Truman parkway. This home features 3 bedrooms, 3 baths, spacious owner's suite with a owner's bath, large living room with a fireplace and built-in book shelves, a separate dining room, a nice kitchen with lots of cabinet space, nice wood floors throughout living room and dining room, ceramic tile in kitchen and baths. This home sits at the end of a quiet short street. Hurry! This deal won't last!
Key facts
- Kitchen and baths
- Recently refreshed
- Single family home
Tags
Property features AI
Exterior
- Parking: Off-street parking
- Utilities: Public water; Public sewer
- Home design: Single-family residence; One-story; Raised foundation
- Construction: Frame construction with wood siding
- Exterior features: Front porch, porch and patio; Corner lot; Has a view; Asphalt road frontage
Interior
- Bathrooms: 3 full bathrooms
- Heating & cooling: Central heating (natural gas); Central electric air conditioning
- Interior features: Decorative living room fireplace; Gas water heater
- Laundry & utility: Dedicated laundry room
Neighborhood map
What this means for you Summary
Snapshot
- This is a 3-bed/3.0-bath single-family listed at $220k.
Deal economics
- At list price, monthly cash flow is $265 ($3k/yr) — positive.
- The deal already cash-flows at list — no discount required.
- Meets the 1% rule at list price ($2k rent vs $220k).
- Recommended offer: $213k (3.0% below list) — sets the bar for market timing.
- Cap rate 7.7% vs local median 4.0% in Savannah — top-decile yield for the area; either an underpriced asset or a hidden risk that comps aren't pricing in. Stress-test before assuming the spread holds.
Location & tenants
- Location reads 86/100 on livability (#1 in GA, #397 nationally) — a professional / high-income tenant draw. Strengths: crime A+, amenities A+, commute A+; Watch: employment D, schools F.
- Savannah-Chatham County (urban): math 20% / reading 26% proficiency, ranked #134 of 174 in GA (top 77%) — low school quality limits family demand, transient renter base, plan for 1-2y turnover.
- Market conditions: Rents rising (+3.6%/yr); 226 active listings in the ZIP; 40 comparable units currently listed for rent nearby; rentals lingering (median 44d on market — plan ~5-8 weeks vacancy on turnover, expect pricing pressure); 52% of comp listings sitting > 30 days — soft ceiling on asking rent; 2,694 units permitted in Chatham County in 2024 (973 in 5+ unit buildings).
- At $2,206/mo this rent would consume 50% of the median local household income ($53k/yr) (locally 1649% of renters already pay >50% of income on rent) — very limited rent-growth headroom before tenants either downsize or default.
Forward outlook
- Local home prices are declining (-3.0%/yr); year-one equity from $2k of loan paydown is wiped out by about $7k of value loss. Plan a longer hold.
- Chatham County population projected at +33% by 2050 — long-run rental-demand tailwind backs the buy-and-hold thesis.
Negotiation context
- It's been on market 48 days — a 3% lower offer ($213k) is reasonable based on typical stale-listing flexibility.
- 6 sale attempts since 20y ago with the ask held roughly flat each time — persistent listings suggest the price (not the market) is what's stuck; bring a comps-based counter.
- Current owner paid $90k; list at $220k implies a 145% gain — meaningful room to come down on a strong offer.
Risks & watch-outs
- Watch-outs: built in 1940 — expect roof / HVAC / electrical / plumbing capex.
- Climate carrying-cost: severe wind risk, 99% chance of damaging wind over 30y; extreme-heat days projected 7→18/yr by 2055 (HVAC capex compounding) — expect insurance premiums to compound above CPI over the hold.
Questions for the listing agent
- It's been on market 48 days. Have you received any prior offers? Is the seller open to a 3% concession, seller financing, or rate buy-down credit?
- Built in 1940 — when were the roof, HVAC, electrical panel, plumbing, and water heater last replaced?
- Is there a deadline driving the sale (1031 exchange, divorce, estate, relocation)? That informs how much negotiation room exists.
- Schools are F-rated, which usually means shorter tenancies and higher turnover. Who's the typical renter profile here, and what's been the actual vacancy rate?
- What's the average days-on-market for RENTAL listings here right now (not sales)? A rising rental-DOM trend means longer vacancies and softer asking-rent achievability than the comps imply.
- What's the recent tenant-quality profile in this submarket — average credit score on applications, eviction rate, late-payment / NSF rate, and stable-employment percentage? A property-management company in the area should have these aggregated.
- How much new for-sale + rental construction is in the pipeline within 1–3 miles? Heavy new supply typically softens prices + rents 12–24 months out; constrained supply supports both.
Investment metrics
- 1% rule
- 1.00% ✓
- Cap rate
- 7.74%
- Cash-on-cash
- 5.16%
- DSCR
- 1.23
- GRM
- 8.3
CMA / ARV
- ARV (median comp)
- $280,449
- List price
- $220,000
- Delta
- -21.55%
- Verdict
- UNDERPRICED
- Comps
- 20 within 1.0 mi
Show comp detail 12 sales within ~0.75 mi
| Address | Dist | Beds/Ba | Sqft | Sold | Price | $/sf | Match |
|---|---|---|---|---|---|---|---|
| 1226 E Bolton St | 0.21mi | 3/2.5 | 1,500 (-0%) | 7mo | $347,000 | $231 | 83 |
| 726 Waters Ave | 0.31mi | 3/1.5 | 1,416 (-6%) | 6mo | $205,000 | $145 | 64 |
| 1902 Foster St | 0.69mi | 3/2.0 | 1,484 (-1%) | 2mo | $349,900 | $236 | 60 |
| 1317 E 32nd St | 0.61mi | 3/2.0 | 1,438 (-4%) | 1mo | $353,000 | $245 | 60 |
| 1111 E 31st St | 0.62mi | 3/2.0 | 1,580 (+5%) | 1mo | $423,000 | $268 | 58 |
| 1210 E Waldburg St | 0.27mi | 3/2.0 | 1,277 (-15%) | 2mo | $285,000 | $223 | 56 |
| 823 E Park Ave | 0.56mi | 3/2.5 | 1,384 (-8%) | 3mo | $425,000 | $307 | 56 |
| 809 E Bolton St | 0.54mi | 3/2.0 | 1,350 (-10%) | 1mo | $440,000 | $326 | 53 |
| 501 Atkinson Ave | 0.71mi | 3/2.0 | 1,458 (-3%) | 7mo | $360,000 | $247 | 52 |
| 1107 Skidaway Rd | 0.53mi | 2/1.0 (-1) | 1,316 (-12%) | 6mo | $339,586 | $258 | 37 |
| 1804 E Henry St | 0.68mi | 2/2.0 (-1) | 1,309 (-13%) | 4mo | $390,000 | $298 | 35 |
| 1217 E 34th St | 0.71mi | 4/2.0 (+1) | 1,677 (+12%) | 5mo | $156,000 | $93 | 35 |
Match score weights: distance 35% · size 25% · config 20% · recency 20%. Top-matched comps best support the ARV.
Projected returns pro-forma
-3.0% appreciation · 3.62% rent growth · sell at horizon
- IRR
- -7.6%
- Equity multiple
- 0.72×
- Total profit
- $-17,382
- Equity at exit
- $32,803
- IRR
- 2.7%
- Equity multiple
- 1.20×
- Total profit
- $12,377
- Equity at exit
- $19,022
Cash invested: $61,600 (down + closing). Projections, not guarantees.
Landlord ↔ Tenant lean methodology
- Overall (STATE)
- 90 Strongly Landlord-Friendly
- State Georgia
- 90 Strongly Landlord-Friendly · R+3
- County
- — inherits STATE
- City
- — inherits STATE
ZIP-level market 31404
- Rents YoY
- 3.6%
- Active inventory
- 226
- Price-to-rent
- 8.3×
Monthly cashflow live
- Estimated rent
- $2,206 high interval (Pro) →
- Mortgage (P&I)
- −$1,154
- Tax from tax record
- −$232 /mo · $2,789/yr
- Insurance
- −$92
- HOA
- −$0
- Vacancy / Maint / Mgmt
- −$463
- Net cashflow
- $265
Break-even live
UW: 25.0% down · 7.5% · 30yr · 1.5% tax · 5.0% vac · 8.0% maint · 8.0% mgmt
Financing live
Cash to close
- Down payment
- $55,000
- Closing costs
- $6,600
- Reserves months
- —
- Total cash needed
- —
Loan-product check · same deal, 3 products live
Conventional
25% down · 7.5% · 30yr
- Down + closing
- —
- Monthly P&I
- —
- Monthly cashflow
- —
- DSCR
- —
- Eligible?
- —
Personal DTI + credit; lowest rate.
DSCR
20% down · 8.5% · 30yr
- Down + closing
- —
- Monthly P&I
- —
- Monthly cashflow
- —
- DSCR
- —
- Eligible?
- —
No personal income docs; deal must DSCR.
Hard money
10% down · 12.0% · 12mo
- Down + closing
- —
- Monthly P&I
- —
- Monthly cashflow
- —
- DSCR
- —
- Eligible?
- —
Short-term bridge; refi at stabilization.
Rent comps 40 comps
| Address | Beds | Baths | Sqft | Rent | $/sqft | DOM | Units | Dist |
|---|---|---|---|---|---|---|---|---|
| 1203 E Bolton St Savannah, GA | 2.0 | 2.5 | 1200 | $2,000 | $1.67 | 23d | 1 | 0.31mi |
| 1112 E Bolton St Savannah, GA | 3.0 | 1.0 | 1112 | $1,975 | $1.78 | 23d | 1 | 0.36mi |
| 1518 E Park Ave Savannah, GA | 2.0–3.0 | 1.0–2.5 | 1261 | $1,703 | $1.35 | 14d | 6 | 0.37mi |
| 27 Stirling St Savannah, GA | 2.0 | 1.0 | 2000 | $2,500 | $1.25 | 43d | 1 | 0.37mi |
| 1612 Skidaway Rd Savannah, GA | 2.0 | 1.0 | 1453 | $1,800 | $1.24 | 43d | 1 | 0.42mi |
| 1655 McKinnon Dr Savannah, GA | 4.0 | 2.0 | 1292 | $1,795 | $1.39 | 23d | 1 | 0.44mi |
| 921 E Waldburg St Apt B Savannah, GA | 2.0 | 2.0 | 1300 | $2,400 | $1.85 | 14d | 1 | 0.50mi |
| 1403 E Anderson St Savannah, GA | 3.0 | 2.0 | 1300 | $2,400 | $1.85 | 44d | 1 | 0.54mi |
| 430 Lawton Ave Savannah, GA | 4.0 | 2.5 | 2000 | $3,400 | $1.70 | 43d | 1 | 0.55mi |
| 900 E Park Ave Savannah, GA | 3.0 | 2.0 | 1450 | $1,975 | $1.36 | 43d | 1 | 0.56mi |
| 1114 E Anderson St Unit A Savannah, GA | 2.0 | 2.0 | 1374 | $1,800 | $1.31 | 43d | 1 | 0.57mi |
| 1112 E Anderson St Savannah, GA | 4.0 | 2.0 | 1488 | $2,300 | $1.55 | 43d | 1 | 0.57mi |
| 1611 E Henry St Unit A Savannah, GA | 3.0 | 2.0 | 2226 | $1,850 | $0.83 | 44d | 1 | 0.57mi |
| 1502 E 31st St Savannah, GA | 3.0 | 2.0 | 1212 | $1,700 | $1.40 | 14d | 1 | 0.58mi |
| 1150 E Perry Ln Savannah, GA | 2.0 | 1.0–2.0 | 922 | $2,620 | $2.84 | 14d | 16 | 0.59mi |
| 810 E Park Ave Unit B Savannah, GA | 3.0 | 2.0 | 1100 | $2,700 | $2.45 | 43d | 1 | 0.61mi |
| 1014 E Anderson St Savannah, GA | 2.0 | 1.0 | 1642 | $2,200 | $1.34 | 43d | 1 | 0.62mi |
| 1110 E 31st St Unit B Savannah, GA | 2.0 | 1.0 | 1200 | $1,625 | $1.35 | 43d | 1 | 0.63mi |
| 826 E Duffy St Unit A Savannah, GA | 3.0 | 2.0 | 1445 | $1,850 | $1.28 | 43d | 1 | 0.64mi |
| 836 E Henry St Unit C Savannah, GA | 3.0 | 1.0 | 1800 | $2,000 | $1.11 | 43d | 1 | 0.65mi |
| 742 E Park Ave Savannah, GA | 3.0 | 2.0 | 2209 | $2,000 | $0.91 | 43d | 1 | 0.68mi |
| 823 E Henry St Unit B Savannah, GA | 4.0 | 1.5 | 1670 | $2,000 | $1.20 | 43d | 1 | 0.69mi |
| 1704 E 31st St Savannah, GA | 3.0 | 2.0 | 1137 | $2,350 | $2.07 | 43d | 1 | 0.69mi |
| 836 E Anderson St Unit A Savannah, GA | 2.0 | 1.5 | 1215 | $1,950 | $1.60 | 14d | 1 | 0.70mi |
| 1810 E 32nd St Savannah, GA | 3.0 | 1.5 | 1218 | $3,000 | $2.46 | 23d | 1 | 0.74mi |
| 1509 Ott St Savannah, GA | 3.0 | 1.5 | 1263 | $1,900 | $1.50 | 43d | 1 | 0.74mi |
| 101 Forrest Ave Savannah, GA | 3.0 | 1.0 | 1367 | $1,895 | $1.39 | 43d | 1 | 0.74mi |
| 404 Gordonston Ave Savannah, GA | 3.0 | 2.0 | 2028 | $2,800 | $1.38 | 14d | 1 | 0.76mi |
| 723 E Henry St Unit A Savannah, GA | 3.0 | 2.0 | 1199 | $2,150 | $1.79 | 23d | 1 | 0.79mi |
| 1118 NE 36th St Savannah, GA | 3.0 | 2.0 | 1200 | $2,000 | $1.67 | 43d | 1 | 0.84mi |
| 614 E Gwinnett St Unit 616 Savannah, GA | 2.0 | 2.0 | 1116 | $2,790 | $2.50 | 43d | 1 | 0.85mi |
| 916 E 35th St Savannah, GA | 4.0 | 2.0 | 1630 | $2,700 | $1.66 | 23d | 1 | 0.87mi |
| 643 E Henry St Unit B Savannah, GA | 3.0 | 1.5 | 1207 | $1,899 | $1.57 | 23d | 1 | 0.89mi |
| 401 Upper East Ave Unit 1369215P Savannah, GA | 3.0 | 3.5 | 1894 | $4,490 | $2.37 | 14d | 1 | 0.90mi |
| 437 Port St Savannah, GA | 2.0 | 2.5 | 2134 | $4,200 | $1.97 | 21d | 1 | 0.90mi |
| 1131 SE 36th St Unit A Savannah, GA | 2.0 | 1.0 | 1200 | $1,675 | $1.40 | 14d | 1 | 0.90mi |
| 503 Blair St Savannah, GA | 2.0 | 2.5 | 1224 | $2,400 | $1.96 | 43d | 1 | 0.92mi |
| 1202 E 37th St Unit A Savannah, GA | 4.0 | 2.0 | 1480 | $2,295 | $1.55 | 14d | 1 | 0.92mi |
| 542 E Bolton St Savannah, GA | 2.0 | 1.0 | 1060 | $1,700 | $1.60 | 14d | 1 | 0.92mi |
| 201 Pilot St Savannah, GA | 2.0 | 1.0–2.0 | 878 | $4,156 | $4.73 | 14d | 77 | 0.93mi |
Listing history 32 events
-
2026-06-18days on market $220,000 Active 48 DOM
-
2026-06-17days on market $220,000 Active 47 DOM
-
2026-06-16days on market $220,000 Active 46 DOM
-
2026-06-15days on market $220,000 Active 45 DOM
-
2026-06-14days on market $220,000 Active 43 DOM
-
2026-06-13days on market $220,000 Active 42 DOM
-
2026-06-10days on market $220,000 Active 40 DOM
-
2026-06-09days on market $220,000 Active 39 DOM
-
2026-06-08days on market $220,000 Active 38 DOM
-
2026-06-07days on market $220,000 Active 37 DOM
-
2026-06-05days on market $220,000 Active 34 DOM
-
2026-06-03days on market $220,000 Active 33 DOM
-
2026-06-02days on market $220,000 Active 32 DOM
-
2026-06-01days on market $220,000 Active 31 DOM
-
2026-05-31days on market $220,000 Active 30 DOM
-
2026-05-30days on market $220,000 Active 29 DOM
-
2026-05-01$220,000 Active 502-char remark
-
2026-03-30historical
-
2026-02-18$265,000 Active
-
2019-02-06soldstatus $89,900
-
2019-02-01soldstatus $89,900
Show marketing remark (521 chars)
Amazing deal on this bungalow located just minutes from downtown savannah, schools, shopping, restaurants, hospitals and Truman parkway. This home features 3 bedrooms, 3 baths, spacious owner's suite with a owner's bath, large living room with a fireplace and built-in book shelves, a separate dining room, a nice kitchen with lots of cabinet space, nice wood floors throughout living room and dining room, ceramic tile in kitchen and baths. This home sits at the end of a quiet short street. Hurry! This deal won't last!
-
2019-01-31soldstatus $89,900
-
2018-10-05$94,900
Show marketing remark (521 chars)
Amazing deal on this bungalow located just minutes from downtown savannah, schools, shopping, restaurants, hospitals and Truman parkway. This home features 3 bedrooms, 3 baths, spacious owner's suite with a owner's bath, large living room with a fireplace and built-in book shelves, a separate dining room, a nice kitchen with lots of cabinet space, nice wood floors throughout living room and dining room, ceramic tile in kitchen and baths. This home sits at the end of a quiet short street. Hurry! This deal won't last!
-
2016-12-09soldstatus $85,000
-
2016-11-10soldstatus $85,000
-
2016-07-15$79,795
-
2006-11-13soldstatus $129,000
-
2006-10-30soldstatus $129,000
-
2006-06-28$129,900
-
2005-02-01soldstatus $66,000
-
2001-01-10soldstatus $18,000
ⓘ Source: listings_history table (triggers on properties + properties_extension) + one-shot
backfill from property_details.listing_events for pre-trigger history.
Tax reassessment forecast GA · Resets to sale price
- Current annual tax
- $2,789 · $232/mo
- Projected year-2 tax
- $2,789 · $232/mo
- Expected delta
- $0/yr ($0/mo · 0.0%)
ⓘ Screening estimate from a state-policy table — verify with the county assessor before closing.
Climate risk First Street
- Flood 1/10 Low FEMA zone X (unshaded) · 0% chance over 30 yrs
- Wildfire 1/10 Low
- Heat 10/10 Extreme 7 d/yr ≥107°F today · 18 d/yr by 30 yrs out
- Wind 9/10 Extreme 99% chance of damaging wind over 30 yrs
- Air quality 5/10 Major 7 unhealthy d/yr today · 8 by 30 yrs out
Nearby sold comps map
Loading sold comps map…
Walkable amenities ~0.75 mi
Loading nearby amenities…
Taxation est. · year 1
- Rental income
- $26,472
- − Mortgage interest
- −$12,323
- − Property taxes
- −$2,789
- − Insurance
- −$1,100
- − Repairs & maintenance
- −$2,118
- − Management
- −$2,118
- − Depreciation
- −$6,400
- Taxable loss
- −$376
- Est. tax savings @ 24.0%
- +$90
- After-tax cash flow
- $3,270/yr
For passive investors: Depreciation is non-cash, so a rental often shows a tax loss while cash-flowing — sheltering income. Rental losses are passive: they offset passive income freely, and up to $25,000/yr can offset ordinary (W-2) income if you actively participate and your MAGI is under $100k (phasing out to $0 by $150k); unused losses carry forward. On sale, claimed depreciation is recaptured at up to 25%, and gains may owe capital-gains tax (a 1031 exchange can defer both). Figures are a year-1 estimate at your 24.0% rate — not tax advice; consult a CPA.
Schools (NCES district)
- District
- Savannah-Chatham County
- NCES district ID
- 1301020
- Math proficiency
- 20% ▼ -11.00%
- Reading proficiency
- 26% ▼ -5.00%
- Median HH income
- $47,443
- Composite
- 20.14/100
- National rank
- #8639
- State rank
- #134 of 174 in GA
Livability — Savannah
- Score
- 86/100
- State rank
- #1
- US rank
- #397
Category grades
Schools grade is shown separately in the Schools card above.
Census & demographics
- Census place
- Savannah, GA
- County
- Chatham County · 271,602 people
- City population
- 216,564
- Metro
- Savannah, GA
- Population (ZIP)
- 30,062
- Household income
- $53,303
- Rent vs Own
- Severe rent burden
- 1649.0
Population outlook (Chatham County) Hauer SSP2
- Today (2025)
- 332,584 people
- By 2030
- 355,508 · +6.9%
- By 2040
- 400,030 · +20.3%
- By 2050
- 443,019 · +33.2%
- By 2075
- 534,579 · +60.7%
- By 2100
- 583,863 · +75.6%
Race, ethnicity, and origin ACS 2023
- Neighborhood character
- Majority Black (60%)
- Race & ethnicity
- Black 60% White 33% Two or more races 4% Hispanic / Latino 3% Asian 1%
- Common ancestry
- Romanian 2% Lithuanian 1% Slovak 1%
- Foreign-born
- 4% · Canada, Vietnam
- Languages at home
- 93% English-only · Spanish 3% Other Asian/Pacific 1% French/Haitian/Cajun 1%
Political lean MEDSL · Chatham
- 2024 margin
- D (+18.0) · D 58.6% · R 40.6%
- 2008→2024 swing
- +3.6pp toward D · 2008: 14.4pp · 2024: 18.0pp
- All cycles
- 2024: D+18.0 2020: D+18.8 2016: D+14.5 2012: D+12.0 2008: D+14.4
Not yet ingested
- Civics
- —
Market trends
- HPI YoY
- ▼ -187.86%
- Current HPI
- 310.0764
- Rent YoY
- ▲ 3.62%
- Metro
- Savannah, GA
- State GDP YoY
- ▲ 2.66%
- F500 in state
- 28
Industry mix (Fortune 500 HQ in GA)
| Industry | F500 HQs | Revenue |
|---|---|---|
| Paper / Packaging | 2 | $29B |
|
||
| Retail | 1 | $160B |
|
||
| Transportation / Logistics | 1 | $91B |
|
||
| Airlines | 1 | $62B |
|
||
| Consumer Goods | 1 | $47B |
|
||
| Utilities | 1 | $25B |
|
||
Price history
+1122.2% since first listed16 events — show timeline
- 2026-05-01 Listed $220,000 Hive MLS
- 2026-03-30 Listing Removed — Hive MLS
- 2026-02-18 Listed $265,000 Hive MLS
- 2019-02-06 Sold (Public Records) $89,900 Public Records
- 2019-02-01 Sold (MLS) $89,900 GAMLS
- 2019-01-31 Sold (MLS) $89,900 Hive MLS
- 2018-10-05 Listed $94,900 Hive MLS
- 2018-10-05 Listed $94,900 GAMLS
- 2016-12-09 Sold (MLS) $85,000 Hive MLS
- 2016-11-10 Sold (Public Records) $85,000 Public Records
- 2016-07-15 Listed $79,795 Hive MLS
- 2006-11-13 Sold (Public Records) $129,000 Public Records
- 2006-10-30 Sold (MLS) $129,000 Hive MLS
- 2006-06-28 Listed $129,900 Hive MLS
- 2005-02-01 Sold (Public Records) $66,000 Public Records
- 2001-01-10 Sold (Public Records) $18,000 Public Records
Property tax history
+15.1%/yrLatest (2025): $2,789 · +74.8% YoY. Source: county tax records.
Cash-flow waterfall
monthlySold comps — $/sqft
last 12 mo · ≤1 miLoading sold comps…