530 Easterbrook St · Bay St. Louis, MS
Flood risk 1/10 · Minimal
- FEMA flood zone
- X (shaded)
- Chance of flooding over 30 yrs
- 0.0%
- Est. flood insurance / yr
- $507 – $1,088
Fire risk 1/10 · Minimal
- Est. fire insurance / yr
- $1,241 – $2,305
Heat risk 10/10 · Severe
- Hot days now (above 107°F)
- 7 days/yr
- Hot days in 30 yrs
- 22 days/yr
Wind risk 9/10 · Severe
- Chance of severe wind over 30 yrs
- 99.0%
Air-quality risk 1/10 · Minimal
- Unhealthy air days now
- 0 days/yr
- Unhealthy air days in 30 yrs
- 0 days/yr
Risk factors via First Street. Map © Google.
Why this score? — see what drove the C+ grade
The composite is a weighted blend of 9 inputs, each scored 0–100. Each bar is that input's sub-score; the figure is the points it added to the 100-point composite (weight × sub-score).
- Cash flow +24.8/30.0
- ARV discount +14.2/15.0
- DSCR +8.0/10.0
- 1% rule +5.6/10.0
- Schools +3.9/10.0
- Rent growth +2.5/5.0
- Livability +2.5/5.0
- Condition / age +2.5/5.0
- Appreciation +0.0/10.0
$235,000
🖨 Deal sheet 📄 Offer letter ✓ Due diligence
Listing remarks MLS
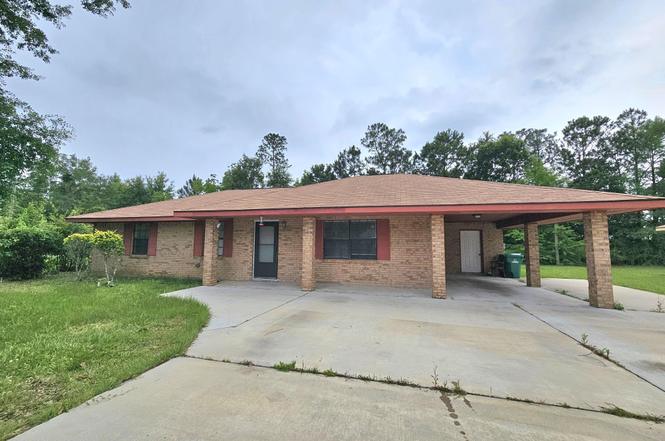
Do not miss your chance to view this four bedroom home approximately one mile from the beach and Old Town Bay's entertainment district! With no flood insurance required, and a new roof on this all brick home there is much to love! Make the interior your own design! The property features a covered car port with additional storage. Buyers and buyers agent to verify all information
Key facts
- Great parking space
- Spacious front yard
- Spacious back yard
Tags
Property features AI
Exterior
- Parking: Carport (1 space); Driveway parking; Paved parking; Total 4 parking spaces; On-site storage
- Utilities: Public water; Public sewer; Electricity available
- Home design: Single-family house; One story; Entry on main level; Brick construction
- Construction: Shingle roof; Slab foundation; Built (year per public records)
- Exterior features: Front porch; Private entrance
Interior
- Kitchen: Electric cooktop; Microwave; Refrigerator
- Bathrooms: 2 full bathrooms
- Heating & cooling: Central electric heating; Central air conditioning; Ceiling fans
- Interior features: Breakfast bar; Private entrance
Neighborhood map
What this means for you Summary
Snapshot
- This is a 4-bed/2.0-bath single-family listed at $235k.
Deal economics
- At list price, monthly cash flow is $496 ($6k/yr) — positive.
- The deal already cash-flows at list — no discount required.
- Meets the 1% rule at list price ($2k rent vs $235k).
- Recommended offer: $207k (12.0% below list) — sets the bar for market timing.
- Cap rate 8.8% vs local median 1.9% in Bay St. Louis — top-decile yield for the area; either an underpriced asset or a hidden risk that comps aren't pricing in. Stress-test before assuming the spread holds.
Location & tenants
- Location reads: area grade C — affects rentability + tenant quality, not the cash-flow math above.
- Bay St Louis Waveland School District (suburban): math 51% / reading 43% proficiency, ranked #21 of 130 in MS (top 16%) — families likely to look elsewhere, expect single-tenant / working-renter base with shorter leases; 74% free/reduced lunch — lower-income household profile, screen leases tightly.
- Market conditions: 601 active listings in the ZIP; 1 comparable units currently listed for rent nearby; 248 units permitted in Hancock County in 2024 (0 in 5+ unit buildings).
Forward outlook
- Local home prices are declining (-3.0%/yr); year-one equity from $2k of loan paydown is wiped out by about $7k of value loss. Plan a longer hold.
- Hancock County population projected at +20% by 2050 — long-run rental-demand tailwind backs the buy-and-hold thesis.
Negotiation context
- It's been on market 220 days — a 12% lower offer ($207k) is reasonable based on typical stale-listing flexibility.
- 4 sale attempts since 4y ago; this cycle's ask has dropped $25k (10%) from the opening price — seller is motivated, your offer sets the floor, not the list.
Risks & watch-outs
- Climate carrying-cost: severe wind risk, 99% chance of damaging wind over 30y; extreme-heat days projected 7→22/yr by 2055 (HVAC capex compounding) — expect insurance premiums to compound above CPI over the hold.
Questions for the listing agent
- It's been on market 220 days. Have you received any prior offers? Is the seller open to a 12% concession, seller financing, or rate buy-down credit?
- Why hasn't it sold? Are there any deal-killer items the seller is aware of (foundation, flood, title, zoning, code violations)?
- Is there a deadline driving the sale (1031 exchange, divorce, estate, relocation)? That informs how much negotiation room exists.
- What's the average days-on-market for RENTAL listings here right now (not sales)? A rising rental-DOM trend means longer vacancies and softer asking-rent achievability than the comps imply.
- What's the recent tenant-quality profile in this submarket — average credit score on applications, eviction rate, late-payment / NSF rate, and stable-employment percentage? A property-management company in the area should have these aggregated.
- How much new for-sale + rental construction is in the pipeline within 1–3 miles? Heavy new supply typically softens prices + rents 12–24 months out; constrained supply supports both.
Investment metrics
- 1% rule
- 1.06% ✓
- Cap rate
- 8.82%
- Cash-on-cash
- 9.04%
- DSCR
- 1.40
- GRM
- 7.8
CMA / ARV
- ARV (on-the-fly)
- $276,276
- Comps found
- 12
Show comp detail 12 sales within ~0.75 mi
| Address | Dist | Beds/Ba | Sqft | Sold | Price | $/sf | Match |
|---|---|---|---|---|---|---|---|
| 715 Union St | 0.33mi | 4/2.0 | 1,248 (+4%) | 15mo | $162,500 | $130 | 65 |
| 401 Third St | 0.75mi | 4/2.0 | 1,204 (+1%) | 1mo | $229,000 | $190 | 63 |
| 298 Union St | 0.55mi | 3/2.0 (-1) | 1,176 (-2%) | 7mo | $324,300 | $276 | 60 |
| 713 Union St | 0.32mi | 3/2.0 (-1) | 1,300 (+9%) | 8mo | $165,000 | $127 | 59 |
| 417 Saint John St | 0.38mi | 3/1.0 (-1) | 1,272 (+6%) | 10mo | $260,000 | $204 | 55 |
| 866 Washington St | 0.72mi | 3/2.0 (-1) | 1,162 (-3%) | 10mo | $292,000 | $251 | 49 |
| 253 Sycamore St | 0.59mi | 3/2.0 (-1) | 1,048 (-12%) | 4mo | $445,000 | $425 | 43 |
| 735 Old Spanish Trl | 0.67mi | 3/1.5 (-1) | 1,285 (+7%) | 9mo | $215,000 | $167 | 42 |
| 438 Ballentine St | 0.58mi | 3/2.0 (-1) | 1,060 (-11%) | 11mo | $274,000 | $258 | 40 |
| 510 Genin St | 0.34mi | 3/2.0 (-1) | 1,362 (+14%) | 20mo | $315,000 | $231 | 40 |
| 226 Sycamore St | 0.71mi | 3/2.0 (-1) | 1,050 (-12%) | 21mo | $520,000 | $495 | 24 |
| 614 Highland Dr | 0.73mi | 3/2.0 (-1) | 1,360 (+14%) | 19mo | $289,000 | $213 | 22 |
Match score weights: distance 35% · size 25% · config 20% · recency 20%. Top-matched comps best support the ARV.
Projected returns pro-forma
-3.0% appreciation · 3.0% rent growth · sell at horizon
- IRR
- -2.6%
- Equity multiple
- 0.90×
- Total profit
- $-6,555
- Equity at exit
- $35,039
- IRR
- 7.0%
- Equity multiple
- 1.53×
- Total profit
- $34,742
- Equity at exit
- $20,319
Cash invested: $65,800 (down + closing). Projections, not guarantees.
Landlord ↔ Tenant lean methodology
- Overall (STATE)
- 90 Strongly Landlord-Friendly
- State Mississippi
- 90 Strongly Landlord-Friendly · R+11
- County
- — inherits STATE
- City
- — inherits STATE
ZIP-level market 39520
- Active inventory
- 601
- Price-to-rent
- 7.8×
Monthly cashflow live
- Estimated rent
- $2,500 medium interval (Pro) →
- Mortgage (P&I)
- −$1,232
- Tax from tax record
- −$149 /mo · $1,787/yr
- Insurance
- −$98
- HOA
- −$0
- Vacancy / Maint / Mgmt
- −$525
- Net cashflow
- $496
Break-even live
UW: 25.0% down · 7.5% · 30yr · 1.5% tax · 5.0% vac · 8.0% maint · 8.0% mgmt
Financing live
Cash to close
- Down payment
- $58,750
- Closing costs
- $7,050
- Reserves months
- —
- Total cash needed
- —
Loan-product check · same deal, 3 products live
Conventional
25% down · 7.5% · 30yr
- Down + closing
- —
- Monthly P&I
- —
- Monthly cashflow
- —
- DSCR
- —
- Eligible?
- —
Personal DTI + credit; lowest rate.
DSCR
20% down · 8.5% · 30yr
- Down + closing
- —
- Monthly P&I
- —
- Monthly cashflow
- —
- DSCR
- —
- Eligible?
- —
No personal income docs; deal must DSCR.
Hard money
10% down · 12.0% · 12mo
- Down + closing
- —
- Monthly P&I
- —
- Monthly cashflow
- —
- DSCR
- —
- Eligible?
- —
Short-term bridge; refi at stabilization.
Rent comps 1 comps
| Address | Beds | Baths | Sqft | Rent | $/sqft | DOM | Units | Dist |
|---|---|---|---|---|---|---|---|---|
| 216 Carre Ct Bay Saint Louis, MS | 3.0 | 2.5 | 1480 | $2,500 | $1.69 | 13d | 1 | 0.84mi |
Listing history 27 events
-
2026-06-18days on market $235,000 Active 220 DOM
-
2026-06-17days on market $235,000 Active 219 DOM
-
2026-06-16days on market $235,000 Active 218 DOM
-
2026-06-15days on market $235,000 Active 217 DOM
-
2026-06-13days on market $235,000 Active 215 DOM
-
2026-06-12days on market $235,000 Active 214 DOM
-
2026-06-09days on market $235,000 Active 211 DOM
-
2026-06-08days on market $235,000 Active 210 DOM
-
2026-06-07days on market $235,000 Active 208 DOM
-
2026-06-04days on market $235,000 Active 205 DOM
-
2026-06-02days on market $235,000 Active 204 DOM
-
2026-06-01days on market $235,000 Active 203 DOM
-
2026-05-31days on market $235,000 Active 202 DOM
-
2026-05-07price $235,000
-
2026-01-27status Active
-
2026-01-27price $239,900
-
2025-09-12status Active
-
2025-09-08status Pending
-
2025-09-08historical
-
2025-07-18price $254,999
-
2025-06-23$259,999 Active
-
2022-06-21soldstatus
-
2022-06-17soldstatus Closed 381-char remark
Show marketing remark (381 chars)
Do not miss your chance to view this four bedroom home approximately one mile from the beach and Old Town Bay's entertainment district! With no flood insurance required, and a new roof on this all brick home there is much to love! Make the interior your own design! The property features a covered car port with additional storage. Buyers and buyers agent to verify all information
-
2022-04-07status Pending 381-char remark
Show marketing remark (381 chars)
Do not miss your chance to view this four bedroom home approximately one mile from the beach and Old Town Bay's entertainment district! With no flood insurance required, and a new roof on this all brick home there is much to love! Make the interior your own design! The property features a covered car port with additional storage. Buyers and buyers agent to verify all information
-
2022-03-25$199,900 Active 381-char remark
Show marketing remark (381 chars)
Do not miss your chance to view this four bedroom home approximately one mile from the beach and Old Town Bay's entertainment district! With no flood insurance required, and a new roof on this all brick home there is much to love! Make the interior your own design! The property features a covered car port with additional storage. Buyers and buyers agent to verify all information
-
2022-01-10soldstatus
-
1988-08-05soldstatus
ⓘ Source: listings_history table (triggers on properties + properties_extension) + one-shot
backfill from property_details.listing_events for pre-trigger history.
Tax reassessment forecast MS · Resets to sale price
- Current annual tax
- $1,787 · $149/mo
- Projected year-2 tax
- $1,857 · $155/mo
- Expected delta
- +$69/yr (+$6/mo · 3.9%)
ⓘ Screening estimate from a state-policy table — verify with the county assessor before closing.
Climate risk First Street
- Flood 1/10 Low FEMA zone X (shaded) · 0% chance over 30 yrs
- Wildfire 1/10 Low
- Heat 10/10 Extreme 7 d/yr ≥107°F today · 22 d/yr by 30 yrs out
- Wind 9/10 Extreme 99% chance of damaging wind over 30 yrs
- Air quality 1/10 Low 0 unhealthy d/yr today · 0 by 30 yrs out
Nearby sold comps map
Loading sold comps map…
Walkable amenities ~0.75 mi
Loading nearby amenities…
Taxation est. · year 1
- Rental income
- $30,000
- − Mortgage interest
- −$13,164
- − Property taxes
- −$1,787
- − Insurance
- −$1,175
- − Repairs & maintenance
- −$2,400
- − Management
- −$2,400
- − Depreciation
- −$6,836
- Taxable income
- $2,238
- Est. tax owed @ 24.0%
- −$537
- After-tax cash flow
- $5,412/yr
For passive investors: Depreciation is non-cash, so a rental often shows a tax loss while cash-flowing — sheltering income. Rental losses are passive: they offset passive income freely, and up to $25,000/yr can offset ordinary (W-2) income if you actively participate and your MAGI is under $100k (phasing out to $0 by $150k); unused losses carry forward. On sale, claimed depreciation is recaptured at up to 25%, and gains may owe capital-gains tax (a 1031 exchange can defer both). Figures are a year-1 estimate at your 24.0% rate — not tax advice; consult a CPA.
Schools (NCES district)
- District
- Bay St Louis Waveland School District
- NCES district ID
- 2800570
- Math proficiency
- 51% ▲ 4.00%
- Reading proficiency
- 43% ▼ -3.00%
- Median HH income
- $38,774
- Composite
- 39.27/100
- National rank
- #3998
- State rank
- #21 of 130 in MS
Livability — Bay St. Louis
No livability data for this city. (Only ~50 U.S. cities are tracked.)
Census & demographics
- Census place
- Bay St. Louis, MS
- Population (ZIP)
- 15,471
Population outlook (Hancock County) Hauer SSP2
- Today (2025)
- 52,161 people
- By 2030
- 54,753 · +5.0%
- By 2040
- 59,242 · +13.6%
- By 2050
- 62,417 · +19.7%
- By 2075
- 68,168 · +30.7%
- By 2100
- 69,212 · +32.7%
Race, ethnicity, and origin ACS 2023
- Neighborhood character
- Predominantly White (80%)
- Race & ethnicity
- White 80% Black 11% Two or more races 6% Hispanic / Latino 3% Asian 1%
- Common ancestry
- Lithuanian 15% Romanian 2% Serbian 2%
- Foreign-born
- 3% · Canada, China
- Languages at home
- 96% English-only · Spanish 2% Chinese 1%
Political lean MEDSL · Hancock
- 2024 margin
- Solid R (+58.7) · D 20.1% · R 78.8% · Other 1.1%
- 2008→2024 swing
- -4.4pp toward R · 2008: -54.2pp · 2024: -58.7pp
- All cycles
- 2024: R+58.7 2020: R+55.5 2016: R+59.4 2012: R+52.8 2008: R+54.2
Not yet ingested
- Civics
- —
Market trends
- HPI YoY
- ▼ -169.80%
- Current HPI
- 227.2103
- Rent YoY
- —
- Metro
- —
- State GDP YoY
- —
- F500 in state
- 0
Price history
+17.6% since first listed14 events — show timeline
- 2026-05-07 Price Changed $235,000 MLSU
- 2026-01-27 Relisted — MLSU
- 2026-01-27 Price Changed $239,900 MLSU
- 2025-09-12 Relisted — MLSU
- 2025-09-08 Pending — MLSU
- 2025-09-08 Listing Removed — MLSU
- 2025-07-18 Price Changed $254,999 MLSU
- 2025-06-23 Listed $259,999 MLSU
- 2022-06-21 Sold (Public Records) — Public Records
- 2022-06-17 Sold (MLS) — MLSU
- 2022-04-07 Pending — MLSU
- 2022-03-25 Listed $199,900 MLSU
- 2022-01-10 Sold (Public Records) — Public Records
- 1988-08-05 Sold (Public Records) — Public Records
Property tax history
+56.9%/yrLatest (2025): $1,787 · +0.0% YoY. Source: county tax records.
Cash-flow waterfall
monthlySold comps — $/sqft
last 12 mo · ≤1 miLoading sold comps…