 🏗️ New Construction
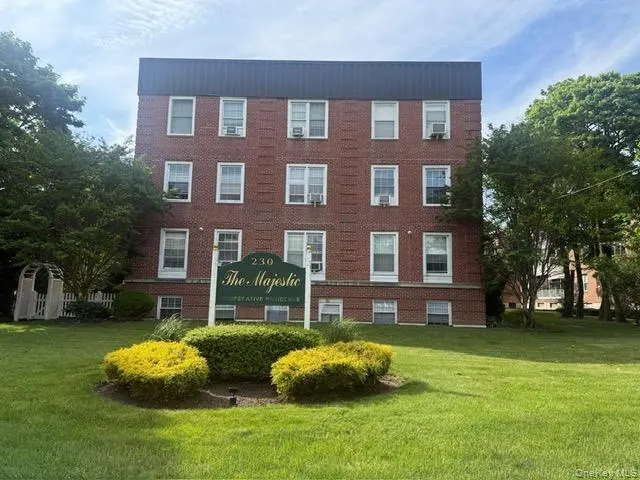
230 Central Ave Unit 1-C · Lawrence, NY
Flood risk 1/10 · Minimal
- FEMA flood zone
- X (unshaded)
- Chance of flooding over 30 yrs
- 0.0%
- Est. flood insurance / yr
- $473 – $860
Fire risk 2/10 · Minimal
- Est. fire insurance / yr
- $691 – $1,283
Heat risk 6/10 · Moderate
- Hot days now (above 95°F)
- 7 days/yr
- Hot days in 30 yrs
- 16 days/yr
Wind risk 8/10 · Major
- Chance of severe wind over 30 yrs
- 80.0%
Air-quality risk 4/10 · Minor
- Unhealthy air days now
- 4 days/yr
- Unhealthy air days in 30 yrs
- 6 days/yr
Risk factors via First Street. Map © Google.
Why this score? — see what drove the D- grade
The composite is a weighted blend of 9 inputs, each scored 0–100. Each bar is that input's sub-score; the figure is the points it added to the 100-point composite (weight × sub-score).
- Appreciation +10.0/10.0
- ARV discount +7.5/15.0
- Cash flow +5.8/30.0
- 1% rule +4.2/10.0
- Schools +4.2/10.0
- Livability +3.0/5.0
- Rent growth +2.5/5.0
- Condition / age +2.2/5.0
- DSCR +0.2/10.0
$310,000
🖨 Deal sheet (PDF) 📄 Offer letter ✓ Due diligence
Listing remarks
Discover comfortable and convenient living in the heart of Lawrence with this spacious one-bedroom apartment, ideally situated on the first floor of a well-maintained elevator building. Residents enjoy the ease of an on-site laundry facility and assigned indoor parking available for $85 per month. Step inside to a welcoming entry foyer that leads to a thoughtfully designed layout featuring a kitchen and an expansive step-down living and dining area—perfect for relaxing or entertaining. The oversized bedroom provides exceptional storage with three closets, along with a ceiling fan and air conditioner for year-round comfort. The full bathroom is designed for convenience and style, featu
Key facts
- Three closets
- Ceiling fan
- Entry foyer
Tags
Neighborhood map
What this means for you Summary
Snapshot
- This is a 1-bed/1.0-bath condo listed at $310k. Condition is rated fair.
Deal economics
- At list price, monthly cash flow is $-614 ($-7k/yr) — negative.
- The deal already cash-flows at list — no discount required.
- To meet the 1% rule (rent ≥ 1% of price), the offer needs to be $285k (8.1% below list).
- Recommended offer: $285k (8.1% below list) — sets the bar for 1% rule.
- Cap rate 3.9% vs local median 2.8% in Lawrence — top-decile yield for the area; either an underpriced asset or a hidden risk that comps aren't pricing in. Stress-test before assuming the spread holds.
Location & tenants
- Location reads 60/100 on livability (#981 in NY) — a middle-class / working-renter tenant base. Strengths: crime A+, employment A+; Watch: housing C-, amenities F, commute F.
- Lawrence Union Free School District (suburban): math 43% / reading 46% proficiency, ranked #399 of 590 in NY (top 68%) — families likely to look elsewhere, expect single-tenant / working-renter base with shorter leases.
- Zoned schools: Lawrence Early Childhood Center At #4 School (145 students, 94% FRL); Lawrence Middle School At Broadway Campus (math 12% / reading 37%, grade F, #611 of 729 statewide, top 88%, 405 students, 79% FRL); Lawrence Senior High School (math 87% / reading 30%, grade C, #877 of 1,100 statewide, top 80%, 770 students, 70% FRL) — zoned schools average 81% FRL vs 52% district-wide (29 pts higher); higher-poverty schools than district average — tighter screening recommended.
- Market conditions: 53 active listings in the ZIP; 1 comparable units currently listed for rent nearby; 824 units permitted in Nassau County in 2024 (153 in 5+ unit buildings).
Forward outlook
- In year one you build about $33k of equity ($2k loan paydown + $31k appreciation (10.0% local appreciation)).
- Nassau County population projected at +7% by 2050 — modest demand growth; plan on rents tracking national, not racing it.
- By year 2, paydown + projected appreciation supports a ~$53k cash-out refi (75% LTV) — recoverable capital for the next deal without selling this one.
Negotiation context
- It's been on market 25 days — a 2% lower offer ($305k) is reasonable based on typical stale-listing flexibility.
Risks & watch-outs
- Watch-outs: HOA is 25% of rent; built in 1942 — expect roof / HVAC / electrical / plumbing capex.
- Climate carrying-cost: severe wind risk, 80% chance of damaging wind over 30y; extreme-heat days projected 7→16/yr by 2055 (HVAC capex compounding) — expect insurance premiums to compound above CPI over the hold.
Questions for the listing agent
- What do current leases actually rent for vs. the listed asking? Can we see a recent rent roll and the last 12 months of T-12 income?
- Have any recent inspections been done? Can we get a copy of the seller's disclosures and any deferred-maintenance estimates?
- Built in 1942 — when were the roof, HVAC, electrical panel, plumbing, and water heater last replaced?
- What does the HOA fee cover, when was the last increase, and are there any pending special assessments or reserve-fund shortfalls?
- Any open or pending special assessments — roof, HVAC, plumbing, elevator, façade? What's the per-unit balance and payoff schedule, and is the seller paying it off at close or rolling it to the buyer?
- Is there a deadline driving the sale (1031 exchange, divorce, estate, relocation)? That informs how much negotiation room exists.
- The area grade is low — what's the realistic commute time and amenity access for the typical tenant pool here? Any planned neighborhood developments (good or bad) we should know about?
- What's the average days-on-market for RENTAL listings here right now (not sales)? A rising rental-DOM trend means longer vacancies and softer asking-rent achievability than the comps imply.
- What's the recent tenant-quality profile in this submarket — average credit score on applications, eviction rate, late-payment / NSF rate, and stable-employment percentage? A property-management company in the area should have these aggregated.
- How much new apartment / multifamily construction is in the pipeline within 1–3 miles? Heavy new supply (>2% of stock underway) typically softens rents 12–24 months out; light construction supports rent growth.
Investment metrics
- 1% rule
- 0.92% ✗
- Cap rate
- 3.92%
- Cash-on-cash
- -8.49%
- DSCR
- 0.62
- GRM
- 9.1
CMA / ARV
No comps found within radius.
Projected returns pro-forma
10.0% appreciation · 3.0% rent growth · sell at horizon
- IRR
- 18.4%
- Equity multiple
- 2.50×
- Total profit
- $130,226
- Equity at exit
- $279,273
- IRR
- 17.1%
- Equity multiple
- 5.78×
- Total profit
- $415,207
- Equity at exit
- $602,262
Cash invested: $86,800 (down + closing). Projections, not guarantees.
Landlord ↔ Tenant lean methodology
- Overall (STATE)
- 15 Strongly Tenant-Friendly
- State New York
- 15 Strongly Tenant-Friendly · D+10
- County
- — inherits STATE
- City
- — inherits STATE
ZIP-level market 11559
- Home prices YoY
- 4.1%
- Active inventory
- 53
- Price-to-rent
- 9.1×
Monthly cashflow live
- Estimated rent
- $2,850 medium interval (Pro) →
- Mortgage (P&I)
- −$1,626
- Tax est. 1.5%
- −$388 /mo · $4,650/yr
- Insurance
- −$129
- HOA est. from 2 same-building comps
- −$723
- Vacancy / Maint / Mgmt
- −$598
- Net cashflow
- $-614
Break-even live
Sensitivity live
| Price | -10% $-400 | -5% $-507 | +0% $-614 | +5% $-721 | +10% $-828 |
|---|---|---|---|---|---|
| Rent | -10% $-839 | -5% $-726 | +0% $-614 | +5% $-501 | +10% $-389 |
| Rate | -1.0pp $-458 | -0.5pp $-535 | base $-614 | +0.5pp $-694 | +1.0pp $-776 |
UW: 25.0% down · 7.5% · 30yr · 1.5% tax · 5.0% vac · 8.0% maint · 8.0% mgmt
Financing live
Cash to close
- Down payment
- $77,500
- Closing costs
- $9,300
- Reserves months
- —
- Total cash needed
- —
Loan-product check · same deal, 3 products live
Conventional
25% down · 7.5% · 30yr
- Down + closing
- —
- Monthly P&I
- —
- Monthly cashflow
- —
- DSCR
- —
- Eligible?
- —
Personal DTI + credit; lowest rate.
DSCR
20% down · 8.5% · 30yr
- Down + closing
- —
- Monthly P&I
- —
- Monthly cashflow
- —
- DSCR
- —
- Eligible?
- —
No personal income docs; deal must DSCR.
Hard money
10% down · 12.0% · 12mo
- Down + closing
- —
- Monthly P&I
- —
- Monthly cashflow
- —
- DSCR
- —
- Eligible?
- —
Short-term bridge; refi at stabilization.
Rent comps 1 comps
| Address | Beds | Baths | Sqft | Rent | $/sqft | DOM | Units | Dist |
|---|---|---|---|---|---|---|---|---|
| 601 Chestnut St Unit A-21 Cedarhurst, NY | 1.0 | 1.0 | 700 | $2,850 | $4.07 | 45d | 1 | 0.95mi |
HOA detail condo
- Monthly dues
- $0 · $0/yr
- Assessments
- None detected in remarks — confirm with the listing agent.
Listing history 44 events
-
2026-06-21days on market $310,000 Active 25 DOM
-
2026-06-18days on market $310,000 Active 22 DOM
-
2026-06-17days on market $310,000 Active 21 DOM
-
2026-06-16days on market $310,000 Active 20 DOM
-
2026-06-15days on market $310,000 Active 19 DOM
-
2026-06-13days on market $310,000 Active 17 DOM
-
2026-06-13days on market $310,000 Active 16 DOM
-
2026-06-09days on market $310,000 Active 13 DOM
-
2026-06-08days on market $310,000 Active 12 DOM
-
2026-06-07days on market $310,000 Active 11 DOM
-
2026-06-04days on market $310,000 Active 8 DOM
-
2026-06-03days on market $310,000 Active 7 DOM
-
2026-06-02days on market $310,000 Active 6 DOM
-
2026-06-01days on market $310,000 Active 5 DOM
-
2026-05-31days on market $310,000 Active 4 DOM
-
2026-03-03status Pending
-
2026-02-10price $250,000
-
2025-12-19price $262,999
-
2025-12-18price $263,999
-
2025-12-12price $264,000
-
2025-12-03price $264,999
-
2025-11-18price $265,999
-
2025-10-27price $266,999
-
2025-10-23price $267,000
-
2025-10-16price $267,900
-
2025-10-03price $268,900
-
2025-09-19price $268,990
-
2025-09-17price $268,993
-
2025-09-05price $268,994
-
2025-08-18price $268,995
-
2025-08-05price $268,996
-
2025-08-04price $268,997
-
2025-07-30price $268,998
-
2025-07-29price $268,999
-
2025-07-23price $269,000
-
2025-07-22price $274,995
-
2025-07-16price $274,998
-
2025-07-14price $274,999
-
2025-06-26price $275,000
-
2025-06-19price $288,997
-
2025-06-13price $288,998
-
2025-05-19price $288,999
-
2025-04-21price $289,000
-
2025-03-18$299,000 Active
ⓘ Source: listings_history table (triggers on properties + properties_extension) + one-shot
backfill from property_details.listing_events for pre-trigger history.
Climate risk First Street
- Flood 1/10 Low FEMA zone X (unshaded) · 0% chance over 30 yrs
- Wildfire 2/10 Low
- Heat 6/10 Major 7 d/yr ≥95°F today · 16 d/yr by 30 yrs out
- Wind 8/10 Severe 80% chance of damaging wind over 30 yrs
- Air quality 4/10 Moderate 4 unhealthy d/yr today · 6 by 30 yrs out
Nearby sold comps map
Loading sold comps map…
Walkable amenities ~0.75 mi
Loading nearby amenities…
Taxation est. · year 1
- Rental income
- $34,200
- − Mortgage interest
- −$17,365
- − Property taxes
- −$4,650
- − Insurance
- −$1,550
- − Repairs & maintenance
- −$2,736
- − Management
- −$2,736
- − HOA
- −$8,676
- − Depreciation
- −$9,018
- Taxable loss
- −$12,531
- Est. tax savings @ 24.0%
- +$3,007
- After-tax cash flow
- $-4,359/yr
For passive investors: Depreciation is non-cash, so a rental often shows a tax loss while cash-flowing — sheltering income. Rental losses are passive: they offset passive income freely, and up to $25,000/yr can offset ordinary (W-2) income if you actively participate and your MAGI is under $100k (phasing out to $0 by $150k); unused losses carry forward. On sale, claimed depreciation is recaptured at up to 25%, and gains may owe capital-gains tax (a 1031 exchange can defer both). Figures are a year-1 estimate at your 24.0% rate — not tax advice; consult a CPA.
Condition & rehab AI · 1 photo
The property is in fair condition with some minor repairs and maintenance needed. Upgrading the exterior and interior paint would significantly enhance its value and appeal.
Repairs flagged
- Minor Brick siding — Some discoloration and wear
- Minor Landscaping — Some overgrowth
Value-add opportunities
- Both Landscaping and exterior painting — Enhances curb appeal and property value
- Both Interior painting — Fresh paint can make the interior look more inviting and modern
Renovation cost estimate screening
| Repair item | Severity | Est. cost |
|---|---|---|
| Brick siding · Some discoloration and wear | Minor | $500–3,000 |
| Landscaping · Some overgrowth | Minor | $500–3,000 |
| Total estimated repair cost · 2 items | $1,000–6,000 |
Value-add ROI direction
- Both Landscaping and exterior painting — Enhances curb appeal and property value ↑
- Both Interior painting — Fresh paint can make the interior look more inviting and modern ↑
ⓘ Cost ranges are severity-bucket heuristics (US national rule-of-thumb). Get contractor quotes + a written scope before underwriting a rehab budget.
Schools (NCES district)
- District
- Lawrence Union Free School District
- NCES district ID
- 3616830
- Math proficiency
- 43% ▼ -2.00%
- Reading proficiency
- 46% ▼ -8.00%
- Median HH income
- $91,008
- Composite
- 42.14/100
- National rank
- #3307
- State rank
- #399 of 590 in NY
Livability — Lawrence
- Score
- 60/100
- State rank
- #981
- US rank
- #19168
Category grades
Schools grade is shown separately in the Schools card above.
Census & demographics
- Census place
- Lawrence, NY
- City population
- 9,130
- Population (ZIP)
- 9,130
Population outlook (Nassau County) Hauer SSP2
- Today (2025)
- 1,409,302 people
- By 2030
- 1,431,482 · +1.6%
- By 2040
- 1,471,607 · +4.4%
- By 2050
- 1,502,845 · +6.6%
- By 2075
- 1,575,403 · +11.8%
- By 2100
- 1,554,356 · +10.3%
Race, ethnicity, and origin ACS 2023
- Neighborhood character
- Predominantly White (76%)
- Race & ethnicity
- White 76% Hispanic / Latino 17% Black 5% Two or more races 2% Asian 2%
- Hispanic origin (detail)
- Puerto Rican 3% Dominican 2%
- Common ancestry
- Romanian 19% Slovak 3% Hispanic 3%
- Foreign-born
- 20% · Canada
- Languages at home
- 67% English-only · Spanish 11% French/Haitian/Cajun 4% Russian/Polish/Slavic 3%
Political lean MEDSL · Nassau
- 2024 margin
- Toss-up / Even · D 47.9% · R 52.1%
- 2008→2024 swing
- -12.6pp toward R · 2008: 8.4pp · 2024: -4.2pp
- All cycles
- 2024: R+4.2 2020: D+9.5 2016: D+5.3 2012: D+6.7 2008: D+8.4
Not yet ingested
- Civics
- —
Market trends
- HPI YoY
- ▲ 17.24%
- Current HPI
- 436.7253
- Rent YoY
- —
- Metro
- —
- State GDP YoY
- ▲ 2.60%
- F500 in state
- 92
Industry mix (Fortune 500 HQ in NY)
| Industry | F500 HQs | Revenue |
|---|---|---|
| Financial Services | 10 | $950B |
|
||
| Consumer Goods | 9 | $162B |
|
||
| Insurance | 4 | $225B |
|
||
| Telecommunications | 2 | $144B |
|
||
| Pharmaceuticals | 2 | $112B |
|
||
| Media / Entertainment | 2 | $69B |
|
||
Price history
-16.4% since first listed29 events — show timeline
- 2026-03-03 Pending — OneKey® MLS as Distributed by MLS Grid
- 2026-02-10 Price Changed $250,000 OneKey® MLS as Distributed by MLS Grid
- 2025-12-19 Price Changed $262,999 OneKey® MLS as Distributed by MLS Grid
- 2025-12-18 Price Changed $263,999 OneKey® MLS as Distributed by MLS Grid
- 2025-12-12 Price Changed $264,000 OneKey® MLS as Distributed by MLS Grid
- 2025-12-03 Price Changed $264,999 OneKey® MLS as Distributed by MLS Grid
- 2025-11-18 Price Changed $265,999 OneKey® MLS as Distributed by MLS Grid
- 2025-10-27 Price Changed $266,999 OneKey® MLS as Distributed by MLS Grid
- 2025-10-23 Price Changed $267,000 OneKey® MLS as Distributed by MLS Grid
- 2025-10-16 Price Changed $267,900 OneKey® MLS as Distributed by MLS Grid
- 2025-10-03 Price Changed $268,900 OneKey® MLS as Distributed by MLS Grid
- 2025-09-19 Price Changed $268,990 OneKey® MLS as Distributed by MLS Grid
- 2025-09-17 Price Changed $268,993 OneKey® MLS as Distributed by MLS Grid
- 2025-09-05 Price Changed $268,994 OneKey® MLS as Distributed by MLS Grid
- 2025-08-18 Price Changed $268,995 OneKey® MLS as Distributed by MLS Grid
- 2025-08-05 Price Changed $268,996 OneKey® MLS as Distributed by MLS Grid
- 2025-08-04 Price Changed $268,997 OneKey® MLS as Distributed by MLS Grid
- 2025-07-30 Price Changed $268,998 OneKey® MLS as Distributed by MLS Grid
- 2025-07-29 Price Changed $268,999 OneKey® MLS as Distributed by MLS Grid
- 2025-07-23 Price Changed $269,000 OneKey® MLS as Distributed by MLS Grid
- 2025-07-22 Price Changed $274,995 OneKey® MLS as Distributed by MLS Grid
- 2025-07-16 Price Changed $274,998 OneKey® MLS as Distributed by MLS Grid
- 2025-07-14 Price Changed $274,999 OneKey® MLS as Distributed by MLS Grid
- 2025-06-26 Price Changed $275,000 OneKey® MLS as Distributed by MLS Grid
- 2025-06-19 Price Changed $288,997 OneKey® MLS as Distributed by MLS Grid
- 2025-06-13 Price Changed $288,998 OneKey® MLS as Distributed by MLS Grid
- 2025-05-19 Price Changed $288,999 OneKey® MLS as Distributed by MLS Grid
- 2025-04-21 Price Changed $289,000 OneKey® MLS as Distributed by MLS Grid
- 2025-03-18 Listed $299,000 OneKey® MLS as Distributed by MLS Grid
Cash-flow waterfall
monthlySold comps — $/sqft
last 12 mo · ≤1 miLoading sold comps…