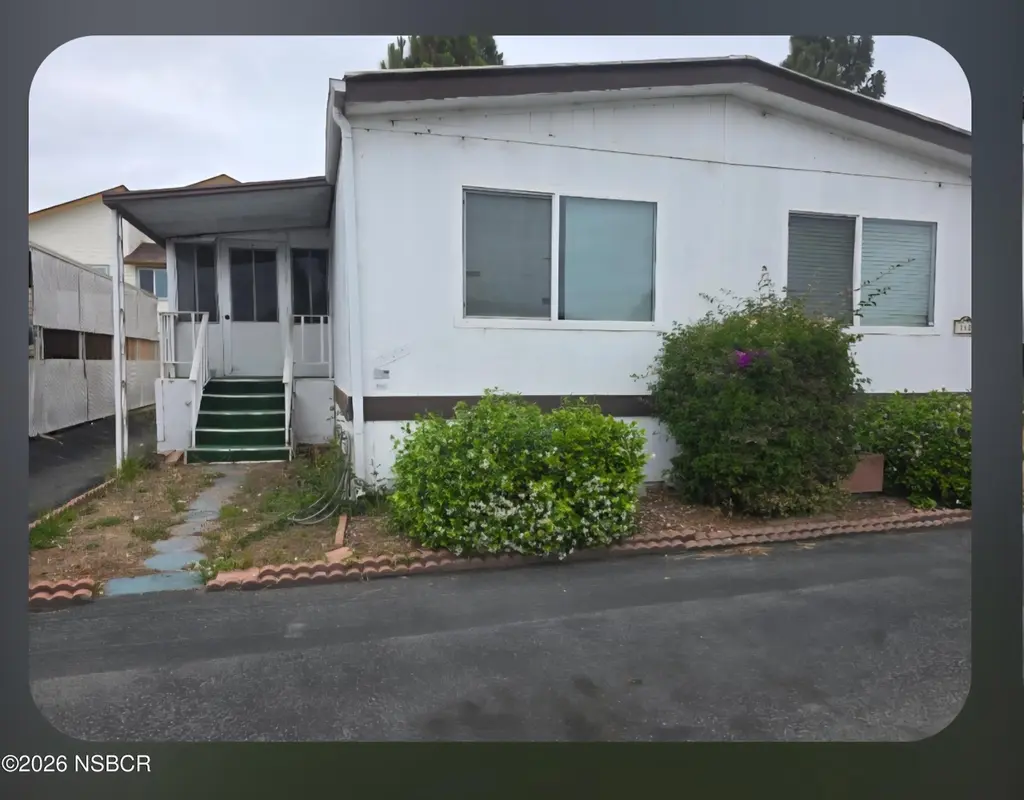
1701 S Thornburg S #140 · Santa Maria, CA
Flood risk 1/10 · Minimal
- FEMA flood zone
- X (unshaded)
- Chance of flooding over 30 yrs
- 0.0%
- Est. flood insurance / yr
- $507 – $1,088
Fire risk 1/10 · Minimal
- Est. fire insurance / yr
- $659 – $1,223
Heat risk 3/10 · Minor
- Hot days now (above 84°F)
- 7 days/yr
- Hot days in 30 yrs
- 16 days/yr
Wind risk 1/10 · Minimal
- Chance of severe wind over 30 yrs
- —
Air-quality risk 6/10 · Moderate
- Unhealthy air days now
- 8 days/yr
- Unhealthy air days in 30 yrs
- 10 days/yr
Risk factors via First Street. Map © Google.
Why this score? — see what drove the B grade
The composite is a weighted blend of 9 inputs, each scored 0–100. Each bar is that input's sub-score; the figure is the points it added to the 100-point composite (weight × sub-score).
- Cash flow +30.0/30.0
- 1% rule +10.0/10.0
- DSCR +10.0/10.0
- ARV discount +7.5/15.0
- Appreciation +5.0/10.0
- Livability +3.6/5.0
- Schools +2.9/10.0
- Rent growth +2.5/5.0
- Condition / age +2.5/5.0
$89,000
🖨 Deal sheet 📄 Offer letter ✓ Due diligence
Listing remarks
Spacious mobile home in a quiet park! 3 bedrooms, 2 bathrooms with plenty of room for extended family and guests. Comfortable living with space to grow--don't miss this one! Selling as is, no repairs
Key facts
- 1,488 sq ft lot
- Built 1974
- Listed 41 days
Property features AI
Finance
- HOA & community: Age-restricted community
Exterior
- Parking: Drive space
- Utilities: Public water; Public sewer
- Home design: Manufactured home; Made by Key West
- Construction: Vinyl siding; Shingle roof
- Exterior features: BBQ; Public water; Public sewer
Interior
- Kitchen: Gas cooktop; Refrigerator
- Flooring: Carpet; Linoleum
- Bathrooms: Two full bathrooms
- Heating & cooling: Forced air heating; Cooling present (type listed as 'Other')
- Interior features: Great room on the first level; One total room listed; Carpet and linoleum flooring; Laundry inside in a common area
- Laundry & utility: Washer included; Dryer included; Laundry located inside/common area
Neighborhood map
What this means for you Summary
Snapshot
- This is a 3-bed/2.0-bath manufactured listed at $89k.
Deal economics
- At list price, monthly cash flow is $2k ($20k/yr) — positive.
- The deal already cash-flows at list — no discount required.
- Meets the 1% rule at list price ($3k rent vs $89k).
- Recommended offer: $86k (3.0% below list) — sets the bar for market timing.
- Cap rate 28.7% vs local median 3.5% in Santa Maria — top-decile yield for the area; either an underpriced asset or a hidden risk that comps aren't pricing in. Stress-test before assuming the spread holds.
Location & tenants
- Location reads 71/100 on livability (#202 in CA) — a middle-class / working-renter tenant base. Strengths: amenities A+, commute A+, health & safety A; Watch: schools F, crime F, cost of living F.
- Santa Maria-Bonita (urban): math 26% / reading 34% proficiency, ranked #1,023 of 1,400 in CA (top 73%) — families likely to look elsewhere, expect single-tenant / working-renter base with shorter leases; 72% free/reduced lunch — lower-income household profile, screen leases tightly.
- Market conditions: 1 active listings in the ZIP; 11 comparable units currently listed for rent nearby; rentals leasing fast (median 14d on market — plan ~1-2 weeks tenant-placement turnaround); 719 units permitted in Santa Barbara County in 2024 (217 in 5+ unit buildings).
Forward outlook
- In year one you build about $3k of equity ($615 loan paydown + $3k appreciation (3.0% local appreciation)).
- Santa Barbara County population projected at +20% by 2050 — long-run rental-demand tailwind backs the buy-and-hold thesis.
- At projected returns (3.0% appreciation + 3.0% rent growth), your $25k cash investment doubles in ~2 years — after that, you're playing with house money.
- By year 10, paydown + projected appreciation supports a ~$32k cash-out refi (75% LTV) — recoverable capital for the next deal without selling this one.
Negotiation context
- It's been on market 41 days — a 3% lower offer ($86k) is reasonable based on typical stale-listing flexibility.
- 8 sale attempts since 24y ago; this cycle's ask has dropped $21k (19%) from the opening price — seller is motivated, your offer sets the floor, not the list.
- Current owner paid $69k; 29% above their basis — modest negotiation headroom, anchor on the comps not their cost.
Questions for the listing agent
- It's been on market 41 days. Have you received any prior offers? Is the seller open to a 3% concession, seller financing, or rate buy-down credit?
- Built in 1974 — when were the roof, HVAC, electrical panel, plumbing, and water heater last replaced?
- Is there a deadline driving the sale (1031 exchange, divorce, estate, relocation)? That informs how much negotiation room exists.
- Schools are F-rated, which usually means shorter tenancies and higher turnover. Who's the typical renter profile here, and what's been the actual vacancy rate?
- Crime grade is F in this area — have there been break-ins, vandalism, or insurance claims at this property in the last 3 years? What carrier currently insures it and at what premium?
- What's the average days-on-market for RENTAL listings here right now (not sales)? A rising rental-DOM trend means longer vacancies and softer asking-rent achievability than the comps imply.
- What's the recent tenant-quality profile in this submarket — average credit score on applications, eviction rate, late-payment / NSF rate, and stable-employment percentage? A property-management company in the area should have these aggregated.
- How much new for-sale + rental construction is in the pipeline within 1–3 miles? Heavy new supply typically softens prices + rents 12–24 months out; constrained supply supports both.
Investment metrics
- 1% rule
- 3.24% ✓
- Cap rate
- 28.72%
- Cash-on-cash
- 80.09%
- DSCR
- 4.56
- GRM
- 2.6
CMA / ARV
- ARV (on-the-fly)
- $188,976
- Comps found
- 4
Show comp detail 4 sales within ~0.75 mi
| Address | Dist | Beds/Ba | Sqft | Sold | Price | $/sf | Match |
|---|---|---|---|---|---|---|---|
| 1701 S Thornburg #156 | 0.13mi | 3/2.0 | 1,434 (-4%) | 9mo | $235,000 | $164 | 80 |
| 1701 S Thornburg St #153 | 0.11mi | 3/2.0 | 1,568 (+5%) | 11mo | $199,000 | $127 | 77 |
| 1701 S Thornburg St #73 | 0.09mi | 2/2.0 (-1) | 1,536 (+3%) | 10mo | $150,000 | $98 | 77 |
| 1701 S Thornburg St #139 | 0.01mi | 2/2.0 (-1) | 1,368 (-8%) | 20mo | $135,000 | $99 | 64 |
Match score weights: distance 35% · size 25% · config 20% · recency 20%. Top-matched comps best support the ARV.
Projected returns pro-forma
3.0% appreciation · 3.0% rent growth · sell at horizon
- IRR
- 84.5%
- Equity multiple
- 5.68×
- Total profit
- $116,693
- Equity at exit
- $40,018
- IRR
- 84.1%
- Equity multiple
- 11.72×
- Total profit
- $267,036
- Equity at exit
- $61,673
Cash invested: $24,920 (down + closing). Projections, not guarantees.
Landlord ↔ Tenant lean methodology
- Overall (STATE)
- 18 Strongly Tenant-Friendly
- State California
- 18 Strongly Tenant-Friendly · D+13
- County
- — inherits STATE
- City
- — inherits STATE
ZIP-level market 93456
- Active inventory
- 1
- Price-to-rent
- 2.6×
Monthly cashflow live
- Estimated rent
- $2,884 high interval (Pro) →
- Mortgage (P&I)
- −$467
- Tax est. 1.5%
- −$111 /mo · $1,335/yr
- Insurance
- −$37
- HOA
- −$0
- Vacancy / Maint / Mgmt
- −$606
- Net cashflow
- $1,663
Break-even live
UW: 25.0% down · 7.5% · 30yr · 1.5% tax · 5.0% vac · 8.0% maint · 8.0% mgmt
Financing live
Cash to close
- Down payment
- $22,250
- Closing costs
- $2,670
- Reserves months
- —
- Total cash needed
- —
Loan-product check · same deal, 3 products live
Conventional
25% down · 7.5% · 30yr
- Down + closing
- —
- Monthly P&I
- —
- Monthly cashflow
- —
- DSCR
- —
- Eligible?
- —
Personal DTI + credit; lowest rate.
DSCR
20% down · 8.5% · 30yr
- Down + closing
- —
- Monthly P&I
- —
- Monthly cashflow
- —
- DSCR
- —
- Eligible?
- —
No personal income docs; deal must DSCR.
Hard money
10% down · 12.0% · 12mo
- Down + closing
- —
- Monthly P&I
- —
- Monthly cashflow
- —
- DSCR
- —
- Eligible?
- —
Short-term bridge; refi at stabilization.
Rent comps 11 comps
| Address | Beds | Baths | Sqft | Rent | $/sqft | DOM | Units | Dist |
|---|---|---|---|---|---|---|---|---|
| 1720 S Depot St Santa Maria, CA | 1.0–4.0 | 1.0–2.0 | 1308 | $2,532 | $1.94 | 13d | 5 | 0.09mi |
| 800 W Battles Rd Santa Maria, CA | 2.0–3.0 | 2.0 | 1104 | $3,258 | $2.95 | 13d | 6 | 0.27mi |
| 983 Dan Blough Dr Santa Maria, CA | 1.0–3.0 | 1.0–3.0 | 1017 | $3,691 | $3.63 | 13d | 45 | 0.46mi |
| 1735 Biscayne St Santa Maria, CA | 3.0 | 2.0 | 1257 | $3,081 | $2.45 | 13d | 9 | 0.56mi |
| 333 E Enos Dr Santa Maria, CA | 1.0–2.0 | 1.0–2.0 | 735 | $2,499 | $3.40 | 13d | 12 | 0.73mi |
| 2299 Carrasco Way Santa Maria, CA | 3.0 | 2.5–3.5 | 1419 | $3,500 | $2.47 | 13d | 2 | 0.84mi |
| 1708 Rio Vista Ln Unit 1 Santa Maria, CA | 2.0 | 2.0 | 1075 | $3,000 | $2.79 | 13d | 1 | 0.87mi |
| 310 E McCoy Ln Santa Maria, CA | 2.0–3.0 | 2.0 | 1130 | $2,995 | $2.65 | 13d | 2 | 1.06mi |
| 620 W Park Ave Santa Maria, CA | 2.0 | 2.0 | 1450 | $2,850 | $1.97 | 13d | 1 | 1.06mi |
| 310 W McCoy Ln Santa Maria, CA | 3.0 | 2.0 | 1130 | $2,600 | $2.30 | 13d | 1 | 1.06mi |
| 703 Meehan St Santa Maria, CA | 3.0 | 1.0–2.0 | 700 | $3,304 | $4.72 | 13d | 14 | 1.13mi |
Listing history 32 events
-
2026-06-18days on market $89,000 Active 41 DOM
-
2026-06-17days on market $89,000 Active 40 DOM
-
2026-06-16days on market $89,000 Active 39 DOM
-
2026-06-15days on market $89,000 Active 38 DOM
-
2026-06-14days on market $89,000 Active 36 DOM
-
2026-06-13days on market $89,000 Active 35 DOM
-
2026-06-10days on market $89,000 Active 33 DOM
-
2026-06-09days on market $89,000 Active 32 DOM
-
2026-06-08days on market $89,000 Active 31 DOM
-
2026-06-07days on market $89,000 Active 30 DOM
-
2026-06-05days on market $89,000 Active 27 DOM
-
2026-06-03days on market $89,000 Active 26 DOM
-
2026-06-02days on market $89,000 Active 25 DOM
-
2026-06-01days on market $89,000 Active 24 DOM
-
2026-05-31days on market $89,000 Active 23 DOM
-
2026-05-30days on market $89,000 Active 22 DOM
-
2026-05-14price $89,000
-
2026-05-05$110,000 Active
-
2017-04-06historical
-
2017-04-06historical
-
2008-11-02historical
-
2008-09-05$47,500
-
2008-09-05$47,500
-
2007-10-22historical
-
2007-10-22soldstatus $69,000
-
2007-06-20$69,000
-
2007-06-20$69,000
-
2007-04-16$1,000
-
2007-04-08historical
-
2007-02-12$69,000
-
2002-12-24soldstatus $50,000
-
2002-11-11$54,900
ⓘ Source: listings_history table (triggers on properties + properties_extension) + one-shot
backfill from property_details.listing_events for pre-trigger history.
Climate risk First Street
- Flood 1/10 Low FEMA zone X (unshaded) · 0% chance over 30 yrs
- Wildfire 1/10 Low
- Heat 3/10 Moderate 7 d/yr ≥84°F today · 16 d/yr by 30 yrs out
- Wind 1/10 Low
- Air quality 6/10 Major 8 unhealthy d/yr today · 10 by 30 yrs out
Nearby sold comps map
Loading sold comps map…
Walkable amenities ~0.75 mi
Loading nearby amenities…
Taxation est. · year 1
- Rental income
- $34,606
- − Mortgage interest
- −$4,985
- − Property taxes
- −$1,335
- − Insurance
- −$445
- − Repairs & maintenance
- −$2,768
- − Management
- −$2,768
- − Depreciation
- −$2,589
- Taxable income
- $19,715
- Est. tax owed @ 24.0%
- −$4,732
- After-tax cash flow
- $15,227/yr
For passive investors: Depreciation is non-cash, so a rental often shows a tax loss while cash-flowing — sheltering income. Rental losses are passive: they offset passive income freely, and up to $25,000/yr can offset ordinary (W-2) income if you actively participate and your MAGI is under $100k (phasing out to $0 by $150k); unused losses carry forward. On sale, claimed depreciation is recaptured at up to 25%, and gains may owe capital-gains tax (a 1031 exchange can defer both). Figures are a year-1 estimate at your 24.0% rate — not tax advice; consult a CPA.
Schools (NCES district)
- District
- Santa Maria-Bonita
- NCES district ID
- 0605580
- Math proficiency
- 26% ▲ 3.00%
- Reading proficiency
- 34% ▲ 3.00%
- Median HH income
- $50,959
- Composite
- 29.11/100
- National rank
- #11891
- State rank
- #1023 of 1400 in CA
Livability — Santa Maria
- Score
- 71/100
- State rank
- #202
- US rank
- #6519
Category grades
Schools grade is shown separately in the Schools card above.
Census & demographics
- Census place
- Santa Maria, CA
Population outlook (Santa Barbara County) Hauer SSP2
- Today (2025)
- 484,679 people
- By 2030
- 505,323 · +4.3%
- By 2040
- 545,783 · +12.6%
- By 2050
- 584,263 · +20.5%
- By 2075
- 682,586 · +40.8%
- By 2100
- 723,188 · +49.2%
Not yet ingested
- Political lean
- —
- Race & ethnicity
- —
- Common origin
- —
- Civics
- —
Market trends
- HPI YoY
- —
- Current HPI
- —
- Rent YoY
- —
- Metro
- —
- State GDP YoY
- ▲ 3.21%
- F500 in state
- 116
Industry mix (Fortune 500 HQ in CA)
| Industry | F500 HQs | Revenue |
|---|---|---|
| Technology | 27 | $1,492B |
|
||
| Financial Services | 3 | $174B |
|
||
| Retail | 3 | $44B |
|
||
| Insurance | 3 | $26B |
|
||
| Media / Entertainment | 2 | $115B |
|
||
| Pharmaceuticals / Biotech | 2 | $62B |
|
||
Price history
+62.1% since first listed16 events — show timeline
- 2026-05-14 Price Changed $89,000 NSBCRMLS
- 2026-05-05 Listed $110,000 NSBCRMLS
- 2017-04-06 Listing Removed — NSBCRMLS
- 2017-04-06 Listing Removed — NSBCRMLS
- 2008-11-02 Listing Removed — CRMLS
- 2008-09-05 Listed $47,500 CRMLS
- 2008-09-05 Listed $47,500 NSBCRMLS
- 2007-10-22 Sold (MLS) $69,000 CRMLS
- 2007-10-22 Listing Removed — NSBCRMLS
- 2007-06-20 Listed $69,000 CRMLS
- 2007-06-20 Listed $69,000 NSBCRMLS
- 2007-04-16 Listed $1,000 NSBCRMLS
- 2007-04-08 Listing Removed — NSBCRMLS
- 2007-02-12 Listed $69,000 NSBCRMLS
- 2002-12-24 Sold (MLS) $50,000 NSBCRMLS
- 2002-11-11 Listed $54,900 NSBCRMLS
Cash-flow waterfall
monthlySold comps — $/sqft
last 12 mo · ≤1 miLoading sold comps…