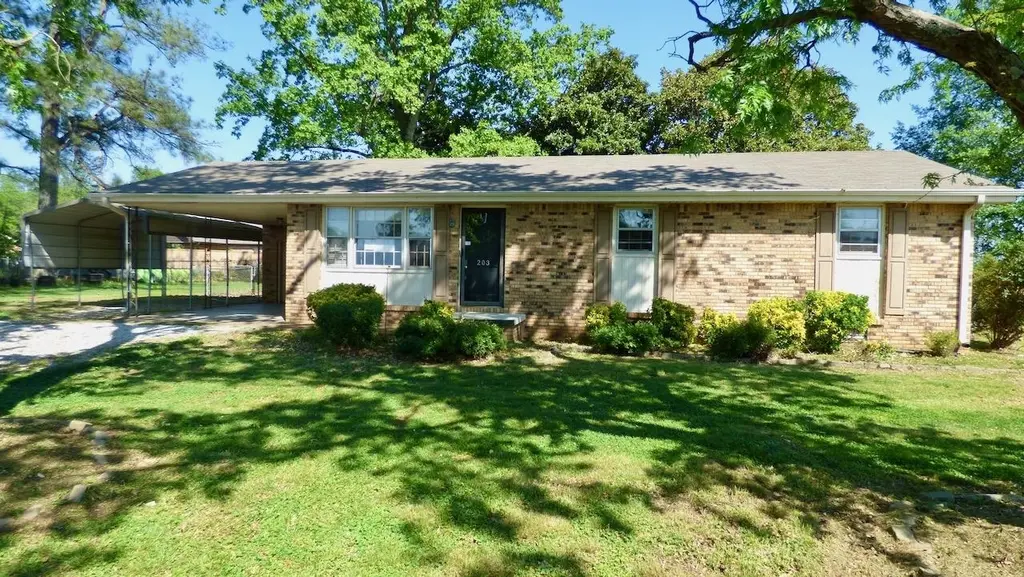
203 James St · Muscle Shoals, AL
Flood risk 1/10 · Minimal
- FEMA flood zone
- X (unshaded)
- Chance of flooding over 30 yrs
- 0.0%
- Est. flood insurance / yr
- $507 – $1,088
Fire risk 1/10 · Minimal
- Est. fire insurance / yr
- $916 – $1,700
Heat risk 6/10 · Moderate
- Hot days now (above 108°F)
- 7 days/yr
- Hot days in 30 yrs
- 21 days/yr
Wind risk 5/10 · Moderate
- Chance of severe wind over 30 yrs
- 25.0%
Air-quality risk 2/10 · Minimal
- Unhealthy air days now
- 0 days/yr
- Unhealthy air days in 30 yrs
- 2 days/yr
Risk factors via First Street. Map © Google.
Why this score? — see what drove the B+ grade
The composite is a weighted blend of 9 inputs, each scored 0–100. Each bar is that input's sub-score; the figure is the points it added to the 100-point composite (weight × sub-score).
- Cash flow +30.0/30.0
- ARV discount +15.0/15.0
- 1% rule +10.0/10.0
- DSCR +10.0/10.0
- Schools +4.4/10.0
- Livability +3.4/5.0
- Rent growth +2.5/5.0
- Condition / age +2.5/5.0
- Appreciation +0.0/10.0
$100,000
🖨 Deal sheet (PDF) 📄 Offer letter ✓ Due diligence
Listing remarks MLS
Located just off River Road and only about 1.5 from Wilson Dam Rd. Brick home on level lot with fenced in back yard. Large eat in kitchen with island. No carpet in this home. Ready for new owners.
Key facts
- 0.35 acre lot
- 2 parking spots
- Built 1972
Neighborhood map
What this means for you Summary
Snapshot
- This is a 3-bed/2.0-bath single-family listed at $100k.
Deal economics
- At list price, monthly cash flow is $970 ($12k/yr) — positive.
- The deal already cash-flows at list — no discount required.
- Meets the 1% rule at list price ($2k rent vs $100k).
- Cap rate 17.9% vs local median 2.6% in Muscle Shoals — top-decile yield for the area; either an underpriced asset or a hidden risk that comps aren't pricing in. Stress-test before assuming the spread holds.
Location & tenants
- Location reads 68/100 on livability (#68 in AL) — a middle-class / working-renter tenant base. Strengths: cost of living A+, housing A+, health & safety A; Watch: amenities F, commute F.
- Muscle Shoals City (urban): math 42% / reading 60% proficiency, ranked #11 of 129 in AL (top 8%) — acceptable for families but not a draw, mixed tenant base, ~2y average lease.
- Zoned schools: Muscle Shoals Middle School (math 37% / reading 59%, grade C-, #29 of 257 statewide, top 12%, 648 students, 48% FRL); Muscle Shoals High School (math 47% / reading 42%, grade F, #22 of 305 statewide, top 8%, 853 students, 40% FRL) — zoned schools average 44% FRL vs 25% district-wide (19 pts higher); higher-poverty schools than district average — tighter screening recommended.
- Market conditions: 255 active listings in the ZIP; 1 comparable units currently listed for rent nearby; 91 units permitted in Colbert County in 2024 (0 in 5+ unit buildings).
Forward outlook
- Local home prices are declining (-3.0%/yr); year-one equity from $691 of loan paydown is wiped out by about $3k of value loss. Plan a longer hold.
- Colbert County population projected to shrink 7% by 2050 — rents likely to lag national; underwrite the cash flow, not the appreciation.
- At projected returns (-3.0% appreciation + 3.0% rent growth), your $28k cash investment doubles in ~3 years — after that, you're playing with house money.
Negotiation context
- Only 10 days on market — expect competitive offers; lowballing is unlikely to land.
- 3 sale attempts since 9y ago with the ask held roughly flat each time — persistent listings suggest the price (not the market) is what's stuck; bring a comps-based counter.
Risks & watch-outs
- Climate carrying-cost: moderate wind risk, 25% chance of damaging wind over 30y; extreme-heat days projected 7→21/yr by 2055 (HVAC capex compounding) — expect insurance premiums to compound above CPI over the hold.
Questions for the listing agent
- Built in 1972 — when were the roof, HVAC, electrical panel, plumbing, and water heater last replaced?
- Is there a deadline driving the sale (1031 exchange, divorce, estate, relocation)? That informs how much negotiation room exists.
- Schools are B-rated — typically a magnet for longer-tenancy family renters. What's the average tenant stay here, and is there a school-zone premium baked into asking?
- What's the average days-on-market for RENTAL listings here right now (not sales)? A rising rental-DOM trend means longer vacancies and softer asking-rent achievability than the comps imply.
- What's the recent tenant-quality profile in this submarket — average credit score on applications, eviction rate, late-payment / NSF rate, and stable-employment percentage? A property-management company in the area should have these aggregated.
- How much new for-sale + rental construction is in the pipeline within 1–3 miles? Heavy new supply typically softens prices + rents 12–24 months out; constrained supply supports both.
Investment metrics
- 1% rule
- 2.00% ✓
- Cap rate
- 17.93%
- Cash-on-cash
- 41.57%
- DSCR
- 2.85
- GRM
- 4.2
CMA / ARV
- ARV (on-the-fly)
- $171,792
- Comps found
- 4
Show comp detail 4 sales within ~0.75 mi
| Address | Dist | Beds/Ba | Sqft | Sold | Price | $/sf | Match |
|---|---|---|---|---|---|---|---|
| 312 Ford Rd | 0.14mi | 2/2.0 (-1) | 1,328 (+11%) | 23mo | $62,500 | $47 | 50 |
| 216 Shannon St | 0.47mi | 2/2.0 (-1) | 1,295 (+8%) | 22mo | $116,000 | $90 | 41 |
| 114 Tennessee River Dr | 0.70mi | 3/2.0 | 1,286 (+8%) | 19mo | $185,000 | $144 | 38 |
| 111 Blake Ave | 0.51mi | 3/2.0 | 1,369 (+15%) | 20mo | $200,000 | $146 | 35 |
Match score weights: distance 35% · size 25% · config 20% · recency 20%. Top-matched comps best support the ARV.
Projected returns pro-forma
-3.0% appreciation · 3.0% rent growth · sell at horizon
- IRR
- 38.2%
- Equity multiple
- 2.63×
- Total profit
- $45,551
- Equity at exit
- $14,910
- IRR
- 44.6%
- Equity multiple
- 5.25×
- Total profit
- $119,130
- Equity at exit
- $8,646
Cash invested: $28,000 (down + closing). Projections, not guarantees.
Landlord ↔ Tenant lean methodology
- Overall (STATE)
- 90 Strongly Landlord-Friendly
- State Alabama
- 90 Strongly Landlord-Friendly · R+15
- County
- — inherits STATE
- City
- — inherits STATE
ZIP-level market 35661
- Active inventory
- 255
- Price-to-rent
- 4.2×
Monthly cashflow live
- Estimated rent
- $2,000 medium interval (Pro) →
- Mortgage (P&I)
- −$524
- Tax from tax record
- −$44 /mo · $528/yr
- Insurance
- −$42
- HOA
- −$0
- Vacancy / Maint / Mgmt
- −$420
- Net cashflow
- $970
Break-even live
Sensitivity live
| Price | -10% $1,027 | -5% $998 | +0% $970 | +5% $942 | +10% $913 |
|---|---|---|---|---|---|
| Rent | -10% $812 | -5% $891 | +0% $970 | +5% $1,049 | +10% $1,128 |
| Rate | -1.0pp $1,020 | -0.5pp $995 | base $970 | +0.5pp $944 | +1.0pp $918 |
UW: 25.0% down · 7.5% · 30yr · 1.5% tax · 5.0% vac · 8.0% maint · 8.0% mgmt
Financing live
Cash to close
- Down payment
- $25,000
- Closing costs
- $3,000
- Reserves months
- —
- Total cash needed
- —
Loan-product check · same deal, 3 products live
Conventional
25% down · 7.5% · 30yr
- Down + closing
- —
- Monthly P&I
- —
- Monthly cashflow
- —
- DSCR
- —
- Eligible?
- —
Personal DTI + credit; lowest rate.
DSCR
20% down · 8.5% · 30yr
- Down + closing
- —
- Monthly P&I
- —
- Monthly cashflow
- —
- DSCR
- —
- Eligible?
- —
No personal income docs; deal must DSCR.
Hard money
10% down · 12.0% · 12mo
- Down + closing
- —
- Monthly P&I
- —
- Monthly cashflow
- —
- DSCR
- —
- Eligible?
- —
Short-term bridge; refi at stabilization.
Rent comps 1 comps
| Address | Beds | Baths | Sqft | Rent | $/sqft | DOM | Units | Dist |
|---|---|---|---|---|---|---|---|---|
| 110 Pinewood Dr Muscle Shoals, AL | 2.0 | 2.0 | 1200 | $2,000 | $1.67 | 45d | 1 | 0.96mi |
Listing history 9 events
-
2026-04-27status Pending
-
2026-04-17$100,000 Active
-
2023-10-13soldstatus $162,500 Closed 196-char remark
Show marketing remark (196 chars)
Located just off River Road and only about 1.5 from Wilson Dam Rd. Brick home on level lot with fenced in back yard. Large eat in kitchen with island. No carpet in this home. Ready for new owners.
-
2023-09-16status Pending 196-char remark
Show marketing remark (196 chars)
Located just off River Road and only about 1.5 from Wilson Dam Rd. Brick home on level lot with fenced in back yard. Large eat in kitchen with island. No carpet in this home. Ready for new owners.
-
2023-09-01price $169,900 196-char remark
Show marketing remark (196 chars)
Located just off River Road and only about 1.5 from Wilson Dam Rd. Brick home on level lot with fenced in back yard. Large eat in kitchen with island. No carpet in this home. Ready for new owners.
-
2023-08-30$159,900 Active 196-char remark
Show marketing remark (196 chars)
Located just off River Road and only about 1.5 from Wilson Dam Rd. Brick home on level lot with fenced in back yard. Large eat in kitchen with island. No carpet in this home. Ready for new owners.
-
2017-08-04soldstatus $91,000
-
2017-08-02soldstatus $91,000 275-char remark
Show marketing remark (275 chars)
THIS HOME IS CONVENIENTLY LOCATED RIGHT OFF OF RIVER ROAD IN MUSCLE SHOALS. NEAT 3 BEDROOM, 2 BATH RANCH STYLE HOME WITH A LARGE OPEN KITCHEN. NICE CARPORT WITH A HUGE RV COVER. YARD FENCED IN THE BACK. PAYMENTS CHEAPER THAN RENT. ALL INFORMATION TO BE VERIFIED BY THE BUYER.
-
2017-05-01$92,900 275-char remark
Show marketing remark (275 chars)
THIS HOME IS CONVENIENTLY LOCATED RIGHT OFF OF RIVER ROAD IN MUSCLE SHOALS. NEAT 3 BEDROOM, 2 BATH RANCH STYLE HOME WITH A LARGE OPEN KITCHEN. NICE CARPORT WITH A HUGE RV COVER. YARD FENCED IN THE BACK. PAYMENTS CHEAPER THAN RENT. ALL INFORMATION TO BE VERIFIED BY THE BUYER.
ⓘ Source: listings_history table (triggers on properties + properties_extension) + one-shot
backfill from property_details.listing_events for pre-trigger history.
Tax reassessment forecast AL · Resets to sale price
- Current annual tax
- $528 · $44/mo
- Projected year-2 tax
- $528 · $44/mo
- Expected delta
- $0/yr ($0/mo · 0.0%)
ⓘ Screening estimate from a state-policy table — verify with the county assessor before closing.
Climate risk First Street
- Flood 1/10 Low FEMA zone X (unshaded) · 0% chance over 30 yrs
- Wildfire 1/10 Low
- Heat 6/10 Major 7 d/yr ≥108°F today · 21 d/yr by 30 yrs out
- Wind 5/10 Major 25% chance of damaging wind over 30 yrs
- Air quality 2/10 Low 0 unhealthy d/yr today · 2 by 30 yrs out
Nearby sold comps map
Loading sold comps map…
Walkable amenities ~0.75 mi
Loading nearby amenities…
Taxation est. · year 1
- Rental income
- $24,000
- − Mortgage interest
- −$5,602
- − Property taxes
- −$528
- − Insurance
- −$500
- − Repairs & maintenance
- −$1,920
- − Management
- −$1,920
- − Depreciation
- −$2,909
- Taxable income
- $10,621
- Est. tax owed @ 24.0%
- −$2,549
- After-tax cash flow
- $9,090/yr
For passive investors: Depreciation is non-cash, so a rental often shows a tax loss while cash-flowing — sheltering income. Rental losses are passive: they offset passive income freely, and up to $25,000/yr can offset ordinary (W-2) income if you actively participate and your MAGI is under $100k (phasing out to $0 by $150k); unused losses carry forward. On sale, claimed depreciation is recaptured at up to 25%, and gains may owe capital-gains tax (a 1031 exchange can defer both). Figures are a year-1 estimate at your 24.0% rate — not tax advice; consult a CPA.
Schools (NCES district)
- District
- Muscle Shoals City
- NCES district ID
- 0102520
- Math proficiency
- 42% ▼ -28.00%
- Reading proficiency
- 60% ▼ -1.00%
- Median HH income
- $50,688
- Composite
- 43.61/100
- National rank
- #2969
- State rank
- #11 of 129 in AL
Livability — Muscle Shoals
- Score
- 68/100
- State rank
- #68
- US rank
- #9422
Category grades
Schools grade is shown separately in the Schools card above.
Census & demographics
- Census place
- Muscle Shoals, AL
- Population (ZIP)
- 18,957
Population outlook (Colbert County) Hauer SSP2
- Today (2025)
- 54,154 people
- By 2030
- 53,746 · -0.8%
- By 2040
- 52,431 · -3.2%
- By 2050
- 50,303 · -7.1%
- By 2075
- 44,789 · -17.3%
- By 2100
- 36,676 · -32.3%
Race, ethnicity, and origin ACS 2023
- Neighborhood character
- Predominantly White (78%)
- Race & ethnicity
- White 78% Black 14% Two or more races 5% Hispanic / Latino 5%
- Common ancestry
- Slovak 2% Serbian 1% Iranian 1%
- Foreign-born
- 2% · Canada
- Languages at home
- 97% English-only · Spanish 2% Other Indo-European 1%
Political lean MEDSL · Colbert
- 2024 margin
- Solid R (+46.4) · D 26.4% · R 72.8%
- 2008→2024 swing
- -26.2pp toward R · 2008: -20.3pp · 2024: -46.4pp
- All cycles
- 2024: R+46.4 2020: R+38.9 2016: R+38.3 2012: R+20.4 2008: R+20.3
Not yet ingested
- Civics
- —
Market trends
- HPI YoY
- ▼ -103.94%
- Current HPI
- 174.6414
- Rent YoY
- —
- Metro
- —
- State GDP YoY
- ▲ 2.94%
- F500 in state
- 4
Industry mix (Fortune 500 HQ in AL)
| Industry | F500 HQs | Revenue |
|---|---|---|
| Financial Services | 1 | $8B |
|
||
| Healthcare | 1 | $5B |
|
||
Price history
+7.6% since first listed9 events — show timeline
- 2026-04-27 Pending — SAARMLS
- 2026-04-17 Listed $100,000 SAARMLS
- 2023-10-13 Sold (MLS) $162,500 SAARMLS
- 2023-09-16 Pending — SAARMLS
- 2023-09-01 Price Changed $169,900 SAARMLS
- 2023-08-30 Listed $159,900 SAARMLS
- 2017-08-04 Sold (Public Records) $91,000 Public Records
- 2017-08-02 Sold (MLS) $91,000 SAARMLS
- 2017-05-01 Listed $92,900 SAARMLS
Property tax history
+6.1%/yrLatest (2025): $528 · +7.8% YoY. Source: county tax records.
Cash-flow waterfall
monthlySold comps — $/sqft
last 12 mo · ≤1 miLoading sold comps…