901 Turtle Creek Dr · Rogers, AR
Flood risk 1/10 · Minimal
- FEMA flood zone
- X (unshaded)
- Chance of flooding over 30 yrs
- 0.0%
- Est. flood insurance / yr
- $507 – $1,088
Fire risk 4/10 · Minor
- Est. fire insurance / yr
- $1,499 – $2,785
Heat risk 5/10 · Moderate
- Hot days now (above 105°F)
- 7 days/yr
- Hot days in 30 yrs
- 21 days/yr
Wind risk 2/10 · Minimal
- Chance of severe wind over 30 yrs
- 2.0%
Air-quality risk 1/10 · Minimal
- Unhealthy air days now
- 0 days/yr
- Unhealthy air days in 30 yrs
- 0 days/yr
Risk factors via First Street. Map © Google.
Why this score? — see what drove the B grade
The composite is a weighted blend of 9 inputs, each scored 0–100. Each bar is that input's sub-score; the figure is the points it added to the 100-point composite (weight × sub-score).
- Cash flow +30.0/30.0
- DSCR +10.0/10.0
- 1% rule +9.5/10.0
- ARV discount +7.5/15.0
- Rent growth +5.0/5.0
- Livability +4.5/5.0
- Schools +3.9/10.0
- Condition / age +2.5/5.0
- Appreciation +0.0/10.0
$100,000
🖨 Deal sheet 📄 Offer letter ✓ Due diligence
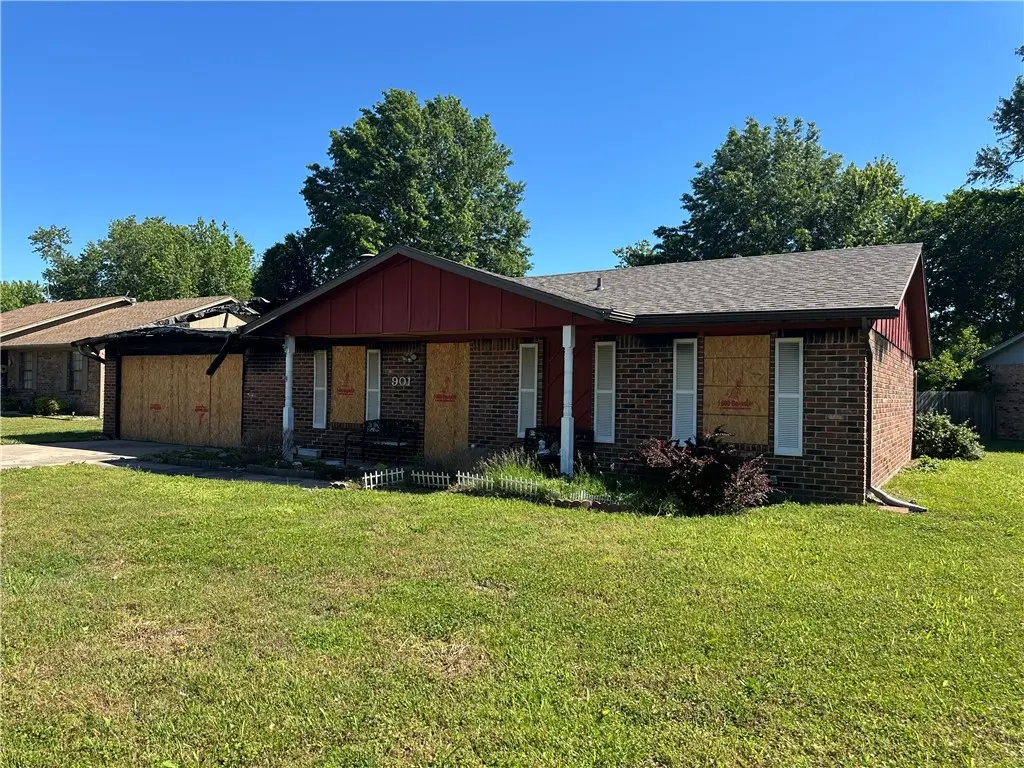
Listing remarks
Opportunity knocks at 901 Turtle Creek Drive in Rogers! This 0.26-acre lot in the established Westridge subdivision is your chance to build equity from the ground up. The existing 3-bedroom, 2-bath brick structure experienced fire damage, making the true value here in the land itself — priced to move at just $100,000. Sitting on a level, curbed lot in a quiet residential neighborhood, the location simply can't be beat. You're minutes from top-rated Rogers schools, major shopping centers, and easy access to NW Arkansas's beloved trail system for biking and walking. Commuters will love the quick jump to I-49, putting the entire NW Arkansas corridor at your fingertips. Whether you're an
Key facts
- 0.26-acre lot
- Level lot
- 0.26 acre lot
Tags
Property features AI
Finance
- Other: Annual tax amount provided in source but excluded from this summary
- Financial info: Financial details beyond HOA frequency not provided
- HOA & community: HOA or association fees billed monthly; Community amenities include biking trails, curbs, proximity to schools, shopping, and trails/paths
Exterior
- Parking: Attached garage; One covered parking space
- Security: No security features listed
- Utilities: Electricity available; Public water; Sewer available
- Home design: Single-story home; Residential property; Entry level information not provided; Facing direction not provided
- Construction: Brick construction; Asphalt shingle roof; Slab foundation; Property is 25 years or older
- Exterior features: Concrete driveway; Patio; Partial privacy wood fencing; Lot is level and within a subdivision; Located on a public paved road; Central business district / city lot setting
Interior
- Kitchen: No kitchen appliance details provided
- Bedrooms: Bedroom details not provided
- Flooring: Flooring details not provided
- Bathrooms: Two full bathrooms
- Heating & cooling: Heating and cooling details not provided
- Interior features: No notable interior features listed
- Laundry & utility: No laundry or utility appliances listed
Neighborhood map
What this means for you Summary
Snapshot
- This is a 3-bed/2.0-bath single-family listed at $100k.
Deal economics
- At list price, monthly cash flow is $456 ($5k/yr) — positive.
- The deal already cash-flows at list — no discount required.
- Meets the 1% rule at list price ($1k rent vs $100k).
- Cap rate 11.8% vs local median 2.6% in Rogers — top-decile yield for the area; either an underpriced asset or a hidden risk that comps aren't pricing in. Stress-test before assuming the spread holds.
Location & tenants
- Location reads 90/100 on livability (#1 in AR, #98 nationally) — a professional / high-income tenant draw. Strengths: amenities A+, commute A+, cost of living A+.
- Rogers School District (urban): math 45% / reading 45% proficiency, ranked #31 of 238 in AR (top 13%) — families likely to look elsewhere, expect single-tenant / working-renter base with shorter leases.
- Market conditions: Rents rising fast (+10.0%/yr); 524 active listings in the ZIP; 25 comparable units currently listed for rent nearby; rentals at typical pace (median 24d on market — plan ~3-4 weeks tenant-placement turnaround); 4,359 units permitted in Benton County in 2024 (402 in 5+ unit buildings).
Forward outlook
- Local home prices are declining (-3.0%/yr); year-one equity from $691 of loan paydown is wiped out by about $3k of value loss. Plan a longer hold.
- Benton County population projected at +56% by 2050 — long-run rental-demand tailwind backs the buy-and-hold thesis.
- At projected returns (-3.0% appreciation + 8.0% rent growth), your $28k cash investment doubles in ~5 years — after that, you're playing with house money.
Negotiation context
- Only 5 days on market — expect competitive offers; lowballing is unlikely to land.
- Current owner paid $53k; list at $100k implies a 89% gain — meaningful room to come down on a strong offer.
Risks & watch-outs
- Climate carrying-cost: extreme-heat days projected 7→21/yr by 2055 (HVAC capex compounding) — expect insurance premiums to compound above CPI over the hold.
Questions for the listing agent
- Is there a deadline driving the sale (1031 exchange, divorce, estate, relocation)? That informs how much negotiation room exists.
- Schools are B-rated — typically a magnet for longer-tenancy family renters. What's the average tenant stay here, and is there a school-zone premium baked into asking?
- What's the average days-on-market for RENTAL listings here right now (not sales)? A rising rental-DOM trend means longer vacancies and softer asking-rent achievability than the comps imply.
- What's the recent tenant-quality profile in this submarket — average credit score on applications, eviction rate, late-payment / NSF rate, and stable-employment percentage? A property-management company in the area should have these aggregated.
- How much new for-sale + rental construction is in the pipeline within 1–3 miles? Heavy new supply typically softens prices + rents 12–24 months out; constrained supply supports both.
Investment metrics
- 1% rule
- 1.45% ✓
- Cap rate
- 11.76%
- Cash-on-cash
- 19.53%
- DSCR
- 1.87
- GRM
- 5.7
CMA / ARV
- ARV (on-the-fly)
- $269,200
- Comps found
- 12
Show comp detail 12 sales within ~0.75 mi
| Address | Dist | Beds/Ba | Sqft | Sold | Price | $/sf | Match |
|---|---|---|---|---|---|---|---|
| 901 Turtle Creek Dr | 0.00mi | 3/2.0 | 1,346 (0%) | 1mo | $90,000 | $67 | 99 |
| 2401 Meadow Ln | 0.13mi | 3/2.0 | 1,349 (+0%) | 9mo | $220,000 | $163 | 86 |
| 2419 W Meadow Dr | 0.18mi | 3/2.0 | 1,316 (-2%) | 3mo | $258,000 | $196 | 85 |
| 2706 W Easy St | 0.41mi | 3/2.0 | 1,426 (+6%) | 4mo | $310,000 | $217 | 68 |
| 2704 W Easy St | 0.40mi | 3/2.0 | 1,456 (+8%) | 2mo | $310,000 | $213 | 66 |
| 2812 Center St | 0.43mi | 3/2.0 | 1,423 (+6%) | 9mo | $285,000 | $200 | 63 |
| 2712 W Easy St | 0.44mi | 3/2.0 | 1,426 (+6%) | 10mo | $300,000 | $210 | 61 |
| 2802 W Sunset Dr | 0.40mi | 3/2.0 | 1,239 (-8%) | 9mo | $244,000 | $197 | 60 |
| 1209 N 31st St | 0.59mi | 3/2.0 | 1,415 (+5%) | 5mo | $299,400 | $212 | 60 |
| 2803 W Bishop Dr | 0.45mi | 3/2.0 | 1,468 (+9%) | 8mo | $269,000 | $183 | 57 |
| 1801 W Wood St | 0.68mi | 3/2.0 | 1,200 (-11%) | 2mo | $265,000 | $221 | 48 |
| 2709 W Sayre Ln | 0.69mi | 3/2.0 | 1,540 (+14%) | 2mo | $297,000 | $193 | 42 |
Match score weights: distance 35% · size 25% · config 20% · recency 20%. Top-matched comps best support the ARV.
Projected returns pro-forma
-3.0% appreciation · 8.0% rent growth · sell at horizon
- IRR
- 17.1%
- Equity multiple
- 1.73×
- Total profit
- $20,511
- Equity at exit
- $14,910
- IRR
- 29.0%
- Equity multiple
- 4.22×
- Total profit
- $90,236
- Equity at exit
- $8,646
Cash invested: $28,000 (down + closing). Projections, not guarantees.
Landlord ↔ Tenant lean methodology
- Overall (STATE)
- 92 Strongly Landlord-Friendly
- State Arkansas
- 92 Strongly Landlord-Friendly · R+14
- County
- — inherits STATE
- City
- — inherits STATE
ZIP-level market 72756
- Home prices YoY
- -18.4%
- Rents YoY
- 10.0%
- Active inventory
- 524
- Price-to-rent
- 5.7×
Monthly cashflow live
- Estimated rent
- $1,452 high interval (Pro) →
- Mortgage (P&I)
- −$524
- Tax est. 1.5%
- −$125 /mo · $1,500/yr
- Insurance
- −$42
- HOA
- −$0
- Vacancy / Maint / Mgmt
- −$305
- Net cashflow
- $456
Break-even live
UW: 25.0% down · 7.5% · 30yr · 1.5% tax · 5.0% vac · 8.0% maint · 8.0% mgmt
Financing live
Cash to close
- Down payment
- $25,000
- Closing costs
- $3,000
- Reserves months
- —
- Total cash needed
- —
Loan-product check · same deal, 3 products live
Conventional
25% down · 7.5% · 30yr
- Down + closing
- —
- Monthly P&I
- —
- Monthly cashflow
- —
- DSCR
- —
- Eligible?
- —
Personal DTI + credit; lowest rate.
DSCR
20% down · 8.5% · 30yr
- Down + closing
- —
- Monthly P&I
- —
- Monthly cashflow
- —
- DSCR
- —
- Eligible?
- —
No personal income docs; deal must DSCR.
Hard money
10% down · 12.0% · 12mo
- Down + closing
- —
- Monthly P&I
- —
- Monthly cashflow
- —
- DSCR
- —
- Eligible?
- —
Short-term bridge; refi at stabilization.
Rent comps 25 comps
| Address | Beds | Baths | Sqft | Rent | $/sqft | DOM | Units | Dist |
|---|---|---|---|---|---|---|---|---|
| 930 Century Dr Rogers, AR | 2.0 | 1.5 | 1100 | $1,350 | $1.23 | 14d | 1 | 0.07mi |
| 1012 N Turtle Creek Dr Rogers, AR | 2.0 | 1.5 | 1150 | $1,295 | $1.13 | 14d | 1 | 0.17mi |
| 700 N 24th St Rogers, AR | 2.0 | 2.0 | 1074 | $1,350 | $1.26 | 23d | 60 | 0.28mi |
| 2306 W Roselawn St Rogers, AR | 2.0 | 2.0 | 1100 | $1,250 | $1.14 | 23d | 1 | 0.50mi |
| 806 N 30th St Rogers, AR | 3.0 | 1.0 | 1248 | $1,350 | $1.08 | 23d | 1 | 0.50mi |
| 2219 W Roselawn St Rogers, AR | 2.0 | 2.0 | 1100 | $1,260 | $1.15 | 23d | 1 | 0.55mi |
| 1302 N 22nd St Rogers, AR | 2.0 | 2.0 | 1121 | $1,550 | $1.38 | 23d | 1 | 0.56mi |
| 2018 W Olive St Rogers, AR | 2.0 | 1.0 | 975 | $1,275 | $1.31 | 23d | 1 | 0.57mi |
| 2814 W Valley W Ct Rogers, AR | 3.0 | 2.0 | 1794 | $1,800 | $1.00 | 23d | 1 | 0.60mi |
| 401 N 35th St Rogers, AR | 2.0 | 2.0 | 960 | $1,218 | $1.27 | 14d | 11 | 0.75mi |
| 3509 W Cedar Cir Rogers, AR | 2.0 | 2.0 | 1160 | $1,272 | $1.10 | 14d | 4 | 0.77mi |
| 801 N 17th Pl Rogers, AR | 2.0 | 1.0 | 1000 | $1,195 | $1.20 | 23d | 1 | 0.80mi |
| 1603 W Walnut St Rogers, AR | 1.0–3.0 | 1.0–2.0 | 918 | $1,519 | $1.65 | 14d | 6 | 0.99mi |
| 815 S 28th St Rogers, AR | 2.0 | 1.0 | 1102 | $1,250 | $1.13 | 23d | 1 | 1.06mi |
| 503 Persimmon Cir Rogers, AR | 2.0 | 2.0 | 1404 | $1,275 | $0.91 | 21d | 1 | 1.08mi |
| 3606 W Lupine Dr Rogers, AR | 3.0 | 2.0 | 1216 | $1,650 | $1.36 | 14d | 1 | 1.12mi |
| 2311 W Willow St Rogers, AR | 3.0 | 2.0 | 1693 | $1,699 | $1.00 | 14d | 1 | 1.16mi |
| 904 Dixson St Rogers, AR | 3.0 | 2.0 | 1570 | $1,650 | $1.05 | 23d | 1 | 1.18mi |
| 401 N 13th Pl Unit 202 Rogers, AR | 3.0 | 2.0 | 1146 | $1,350 | $1.18 | 23d | 1 | 1.22mi |
| 305 N 13th Pl Unit 101 Rogers, AR | 3.0 | 2.0 | 1146 | $1,395 | $1.22 | 14d | 1 | 1.22mi |
| 205 N 13th Pl Unit 201 Rogers, AR | 3.0 | 2.0 | 1146 | $1,350 | $1.18 | 23d | 1 | 1.23mi |
| 306 N 13th St Unit 101 Rogers, AR | 3.0 | 2.0 | 1146 | $1,395 | $1.22 | 14d | 1 | 1.24mi |
| 2409 W Mulberry St Rogers, AR | 3.0 | 2.5 | 1495 | $1,850 | $1.24 | 23d | 1 | 1.25mi |
| 401 N 13th St Unit 202 Rogers, AR | 3.0 | 2.0 | 1146 | $1,350 | $1.18 | 21d | 1 | 1.27mi |
| 205 N 13th St Unit 201 Rogers, AR | 3.0 | 2.0 | 1146 | $1,350 | $1.18 | 21d | 1 | 1.33mi |
Listing history 3 events
-
2026-05-12status Pending
-
2026-05-07$100,000 Active
-
1987-10-01soldstatus $53,000
ⓘ Source: listings_history table (triggers on properties + properties_extension) + one-shot
backfill from property_details.listing_events for pre-trigger history.
Climate risk First Street
- Flood 1/10 Low FEMA zone X (unshaded) · 0% chance over 30 yrs
- Wildfire 4/10 Moderate
- Heat 5/10 Major 7 d/yr ≥105°F today · 21 d/yr by 30 yrs out
- Wind 2/10 Low 2% chance of damaging wind over 30 yrs
- Air quality 1/10 Low 0 unhealthy d/yr today · 0 by 30 yrs out
Nearby sold comps map
Loading sold comps map…
Walkable amenities ~0.75 mi
Loading nearby amenities…
Taxation est. · year 1
- Rental income
- $17,419
- − Mortgage interest
- −$5,602
- − Property taxes
- −$1,500
- − Insurance
- −$500
- − Repairs & maintenance
- −$1,394
- − Management
- −$1,394
- − Depreciation
- −$2,909
- Taxable income
- $4,121
- Est. tax owed @ 24.0%
- −$989
- After-tax cash flow
- $4,479/yr
For passive investors: Depreciation is non-cash, so a rental often shows a tax loss while cash-flowing — sheltering income. Rental losses are passive: they offset passive income freely, and up to $25,000/yr can offset ordinary (W-2) income if you actively participate and your MAGI is under $100k (phasing out to $0 by $150k); unused losses carry forward. On sale, claimed depreciation is recaptured at up to 25%, and gains may owe capital-gains tax (a 1031 exchange can defer both). Figures are a year-1 estimate at your 24.0% rate — not tax advice; consult a CPA.
Schools (NCES district)
- District
- Rogers School District
- NCES district ID
- 0511970
- Math proficiency
- 45% ▼ -9.00%
- Reading proficiency
- 45% ▼ -9.00%
- Median HH income
- $51,712
- Composite
- 38.81/100
- National rank
- #4113
- State rank
- #31 of 238 in AR
Livability — Rogers
- Score
- 90/100
- State rank
- #1
- US rank
- #98
Category grades
Schools grade is shown separately in the Schools card above.
Census & demographics
- Census place
- Rogers, AR
- County
- Benton County · 259,241 people
- City population
- 90,024
- Metro
- Fayetteville-Springdale-Rogers, AR
- Population (ZIP)
- 41,791
- Household income
- $72,230
- Rent vs Own
- Severe rent burden
- 981.0
Population outlook (Benton County) Hauer SSP2
- Today (2025)
- 318,683 people
- By 2030
- 353,481 · +10.9%
- By 2040
- 425,280 · +33.4%
- By 2050
- 497,239 · +56.0%
- By 2075
- 662,114 · +107.8%
- By 2100
- 776,431 · +143.6%
Race, ethnicity, and origin ACS 2023
- Neighborhood character
- Diverse neighborhood (Simpson 0.63)
- Race & ethnicity
- White 49% Hispanic / Latino 36% Two or more races 30% Native American 2% Asian 1%
- Hispanic origin (detail)
- Mexican 25%
- Common ancestry
- Lithuanian 2% Slovak 2% Italian 1%
- Foreign-born
- 19% · Canada
- Languages at home
- 74% English-only · Spanish 25% Other Asian/Pacific 1%
Political lean MEDSL · Benton
- 2024 margin
- Strong R (+27.0) · D 35.2% · R 62.1% · Other 2.7%
- 2008→2024 swing
- +9.6pp toward D · 2008: -36.5pp · 2024: -27.0pp
- All cycles
- 2024: R+27.0 2020: R+26.4 2016: R+34.9 2012: R+40.4 2008: R+36.5
Not yet ingested
- Civics
- —
Market trends
- HPI YoY
- ▼ -82.57%
- Current HPI
- 366.432
- Rent YoY
- ▲ 10.01%
- Metro
- Fayetteville-Springdale-Rogers, AR
- State GDP YoY
- ▲ 3.80%
- F500 in state
- 10
Industry mix (Fortune 500 HQ in AR)
| Industry | F500 HQs | Revenue |
|---|---|---|
| Retail | 1 | $681B |
|
||
| Food / Agriculture | 1 | $53B |
|
||
| Retail / Energy | 1 | $22B |
|
||
| Transportation / Logistics | 1 | $12B |
|
||
| Energy | 1 | $4B |
|
||
Price history
+88.7% since first listed3 events — show timeline
- 2026-05-12 Pending — NWARMLS
- 2026-05-07 Listed $100,000 NWARMLS
- 1987-10-01 Sold (Public Records) $53,000 Public Records
Property tax history
-7.8%/yrLatest (2025): $135 · -41.2% YoY. Source: county tax records.
Cash-flow waterfall
monthlySold comps — $/sqft
last 12 mo · ≤1 miLoading sold comps…