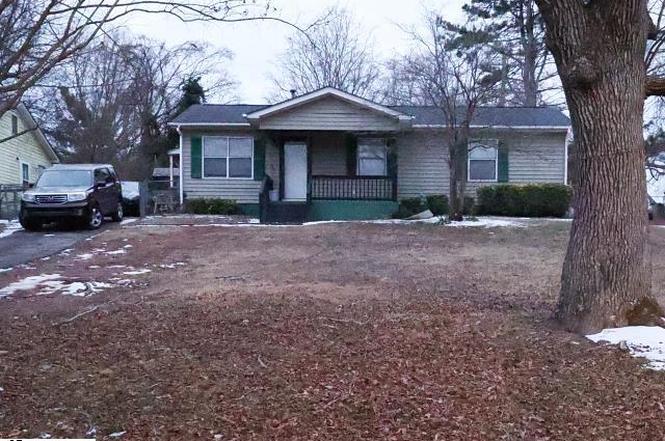
117 Celestial St · Spartanburg, SC
Flood risk 1/10 · Minimal
- FEMA flood zone
- X (unshaded)
- Chance of flooding over 30 yrs
- 0.0%
- Est. flood insurance / yr
- $507 – $1,088
Fire risk 3/10 · Minor
- Est. fire insurance / yr
- $783 – $1,453
Heat risk 6/10 · Moderate
- Hot days now (above 105°F)
- 7 days/yr
- Hot days in 30 yrs
- 16 days/yr
Wind risk 2/10 · Minimal
- Chance of severe wind over 30 yrs
- 3.0%
Air-quality risk 4/10 · Minor
- Unhealthy air days now
- 4 days/yr
- Unhealthy air days in 30 yrs
- 4 days/yr
Risk factors via First Street. Map © Google.
Why this score? — see what drove the C+ grade
The composite is a weighted blend of 9 inputs, each scored 0–100. Each bar is that input's sub-score; the figure is the points it added to the 100-point composite (weight × sub-score).
- Cash flow +23.0/30.0
- ARV discount +15.0/15.0
- DSCR +7.4/10.0
- 1% rule +5.1/10.0
- Livability +3.8/5.0
- Rent growth +3.4/5.0
- Schools +3.1/10.0
- Condition / age +2.5/5.0
- Appreciation +0.0/10.0
$134,000
🖨 Deal sheet 📄 Offer letter ✓ Due diligence
Listing remarks
Welcome to 117 Celestial Street, a value-add investment opportunity located within the city limits of Spartanburg. This property is ideal for investors or savvy buyers looking to renovate and build equity in a growing area. The home does need some updates, but the major systems are already in place, making this a solid foundation for a flip, rental, or long-term hold. A new roof was installed in 2019, and the HVAC system was replaced in 2018, helping reduce immediate capital expenses and allowing buyers to focus on cosmetic improvements and layout optimization. Situated in an established neighborhood with convenient access to downtown Spartanburg, shopping, dining, and major roadways, this
Key facts
- Convenient access
- Hvac system
- New roof
Tags
Property features AI
Finance
- HOA & community: No HOA fees
Exterior
- Parking: Driveway parking; Paved concrete driveway
- Utilities: Public water; Public sewer; Public garbage pickup; Gas water heater; Central forced air cooling
- Home design: Single-story home; Built approximately 31–50 years ago; Slab foundation
- Construction: Composition shingle roof; Vinyl siding exterior; Slab foundation
- Exterior features: Front porch; Sidewalk; Some trees; Vinyl siding
Interior
- Kitchen: Electric cooktop; Electric oven; Microwave; Refrigerator
- Bedrooms: Three bedrooms on the main level; Primary bedroom includes a half bath; Primary bedroom approx. 156; Second bedroom approx. 110; Third bedroom approx. 90
- Flooring: Laminate flooring; Luxury vinyl tile/plank
- Bathrooms: One full bathroom; One half bathroom
- Heating & cooling: Central forced air cooling; Gas water heater; Heating system: other/see remarks
- Interior features: Cable available; Ceiling fans; Front porch; Breakfast area
- Laundry & utility: Washer and dryer included; Main-level laundry in a closet
Neighborhood map
What this means for you Summary
Snapshot
- This is a 3-bed/1.0-bath single-family listed at $134k.
Deal economics
- At list price, monthly cash flow is $238 ($3k/yr) — positive.
- The deal already cash-flows at list — no discount required.
- Meets the 1% rule at list price ($1k rent vs $134k).
- Recommended offer: $118k (12.0% below list) — sets the bar for market timing.
- Cap rate 8.4% vs local median 3.9% in Spartanburg — top-decile yield for the area; either an underpriced asset or a hidden risk that comps aren't pricing in. Stress-test before assuming the spread holds.
Location & tenants
- Location reads 76/100 on livability (#24 in SC, #3,679 nationally) — a middle-class / working-renter tenant base. Strengths: amenities A+, commute A+, cost of living A+; Watch: crime F, employment F.
- Spartanburg 07 (urban): math 34% / reading 41% proficiency, ranked #39 of 80 in SC (top 49%) — families likely to look elsewhere, expect single-tenant / working-renter base with shorter leases; 62% free/reduced lunch — lower-income household profile, screen leases tightly.
- Zoned schools: Mary H. Wright Elementary (math 22% / reading 22%, grade F, #475 of 597 statewide, top 81%, 455 students, 100% FRL) — zoned schools average 100% FRL vs 62% district-wide (38 pts higher); higher-poverty schools than district average — tighter screening recommended.
- Zoned-school proficiency averages 22% at this address vs 38% district-wide (-16 pts) — the specific schools serving this property underperform the Spartanburg 07 average; the district grade overstates school quality for this exact location.
- Market conditions: Rents rising (+3.5%/yr); 234 active listings in the ZIP; 20 comparable units currently listed for rent nearby; rentals at typical pace (median 21d on market — plan ~3-4 weeks tenant-placement turnaround); lower-income renter base — watch delinquency; 3,129 units permitted in Spartanburg County in 2024 (40 in 5+ unit buildings).
- This rent runs 39% of the median local income ($41k/yr) — at the standard rent-burdened threshold; future hikes will face affordability resistance.
Forward outlook
- Local home prices are declining (-3.0%/yr); year-one equity from $926 of loan paydown is wiped out by about $4k of value loss. Plan a longer hold.
- Spartanburg County population projected at +18% by 2050 — long-run rental-demand tailwind backs the buy-and-hold thesis.
Negotiation context
- It's been on market 137 days — a 12% lower offer ($118k) is reasonable based on typical stale-listing flexibility.
- Current owner paid $30k; list at $134k implies a 347% gain — meaningful room to come down on a strong offer.
Risks & watch-outs
- Climate carrying-cost: extreme-heat days projected 7→16/yr by 2055 (HVAC capex compounding) — expect insurance premiums to compound above CPI over the hold.
Questions for the listing agent
- It's been on market 137 days. Have you received any prior offers? Is the seller open to a 12% concession, seller financing, or rate buy-down credit?
- Why hasn't it sold? Are there any deal-killer items the seller is aware of (foundation, flood, title, zoning, code violations)?
- Is there a deadline driving the sale (1031 exchange, divorce, estate, relocation)? That informs how much negotiation room exists.
- Schools are D-rated, which usually means shorter tenancies and higher turnover. Who's the typical renter profile here, and what's been the actual vacancy rate?
- Crime grade is F in this area — have there been break-ins, vandalism, or insurance claims at this property in the last 3 years? What carrier currently insures it and at what premium?
- What's the average days-on-market for RENTAL listings here right now (not sales)? A rising rental-DOM trend means longer vacancies and softer asking-rent achievability than the comps imply.
- What's the recent tenant-quality profile in this submarket — average credit score on applications, eviction rate, late-payment / NSF rate, and stable-employment percentage? A property-management company in the area should have these aggregated.
- How much new for-sale + rental construction is in the pipeline within 1–3 miles? Heavy new supply typically softens prices + rents 12–24 months out; constrained supply supports both.
Investment metrics
- 1% rule
- 1.01% ✓
- Cap rate
- 8.43%
- Cash-on-cash
- 7.63%
- DSCR
- 1.34
- GRM
- 8.2
CMA / ARV
- ARV (on-the-fly)
- $165,025
- Comps found
- 12
Show comp detail 12 sales within ~0.75 mi
| Address | Dist | Beds/Ba | Sqft | Sold | Price | $/sf | Match |
|---|---|---|---|---|---|---|---|
| 119 George St | 0.26mi | 3/1.0 | 1,017 (-1%) | 12mo | $178,000 | $175 | 77 |
| 106 Nevada St | 0.53mi | 3/1.0 | 1,041 (+2%) | 1mo | $119,900 | $115 | 72 |
| 201 South Carolina Ave | 0.40mi | 2/1.5 (-1) | 1,050 (+2%) | 4mo | $167,000 | $159 | 67 |
| 136 Prospect Ave | 0.41mi | 3/2.0 | 1,097 (+7%) | 1mo | $180,600 | $165 | 64 |
| 103 Harvard Dr | 0.25mi | 2/1.0 (-1) | 1,101 (+7%) | 8mo | $159,900 | $145 | 64 |
| 128 Owens St | 0.34mi | 3/2.0 | 960 (-6%) | 10mo | $155,000 | $161 | 61 |
| 382 Caulder Ave Ave | 0.47mi | 2/1.0 (-1) | 1,080 (+5%) | 9mo | $72,500 | $67 | 57 |
| 273 Caulder Cir | 0.59mi | 3/1.0 | 1,057 (+3%) | 13mo | $148,000 | $140 | 56 |
| 163 East Columbia Avenue Ave | 0.68mi | 3/1.0 | 1,064 (+4%) | 11mo | $167,000 | $157 | 53 |
| 208B Collins Ave | 0.59mi | 2/2.0 (-1) | 954 (-7%) | 1mo | $166,000 | $174 | 52 |
| 131 Ponce De Leon Ave | 0.56mi | 2/1.0 (-1) | 1,112 (+8%) | 13mo | $192,650 | $173 | 44 |
| 102 Arlo Ct | 0.64mi | 2/1.0 (-1) | 881 (-14%) | 3mo | $142,500 | $162 | 39 |
Match score weights: distance 35% · size 25% · config 20% · recency 20%. Top-matched comps best support the ARV.
Projected returns pro-forma
-3.0% appreciation · 3.46% rent growth · sell at horizon
- IRR
- -4.2%
- Equity multiple
- 0.84×
- Total profit
- $-5,931
- Equity at exit
- $19,980
- IRR
- 5.9%
- Equity multiple
- 1.45×
- Total profit
- $16,860
- Equity at exit
- $11,586
Cash invested: $37,520 (down + closing). Projections, not guarantees.
Landlord ↔ Tenant lean methodology
- Overall (STATE)
- 90 Strongly Landlord-Friendly
- State South Carolina
- 90 Strongly Landlord-Friendly · R+6
- County
- — inherits STATE
- City
- — inherits STATE
ZIP-level market 29306
- Home prices YoY
- -29.9%
- Rents YoY
- 3.5%
- Active inventory
- 234
- Price-to-rent
- 8.2×
Monthly cashflow live
- Estimated rent
- $1,358 high interval (Pro) →
- Mortgage (P&I)
- −$703
- Tax from tax record
- −$76 /mo · $906/yr
- Insurance
- −$56
- HOA
- −$0
- Vacancy / Maint / Mgmt
- −$285
- Net cashflow
- $238
Break-even live
UW: 25.0% down · 7.5% · 30yr · 1.5% tax · 5.0% vac · 8.0% maint · 8.0% mgmt
Financing live
Cash to close
- Down payment
- $33,500
- Closing costs
- $4,020
- Reserves months
- —
- Total cash needed
- —
Loan-product check · same deal, 3 products live
Conventional
25% down · 7.5% · 30yr
- Down + closing
- —
- Monthly P&I
- —
- Monthly cashflow
- —
- DSCR
- —
- Eligible?
- —
Personal DTI + credit; lowest rate.
DSCR
20% down · 8.5% · 30yr
- Down + closing
- —
- Monthly P&I
- —
- Monthly cashflow
- —
- DSCR
- —
- Eligible?
- —
No personal income docs; deal must DSCR.
Hard money
10% down · 12.0% · 12mo
- Down + closing
- —
- Monthly P&I
- —
- Monthly cashflow
- —
- DSCR
- —
- Eligible?
- —
Short-term bridge; refi at stabilization.
Rent comps 20 comps
| Address | Beds | Baths | Sqft | Rent | $/sqft | DOM | Units | Dist |
|---|---|---|---|---|---|---|---|---|
| 630 S Converse St Spartanburg, SC | 2.0 | 1.0 | 912 | $995 | $1.09 | 21d | 1 | 0.12mi |
| 88 W Park Dr Unit H Spartanburg, SC | 2.0 | 1.0 | 950 | $875 | $0.92 | 21d | 1 | 0.29mi |
| 102 Harvard Dr Spartanburg, SC | 2.0 | 1.0 | 1000 | $1,300 | $1.30 | 13d | 1 | 0.30mi |
| 318 Alexander Ave Spartanburg, SC | 4.0 | 2.0 | 1480 | $1,695 | $1.15 | 21d | 1 | 0.31mi |
| 249 E Hampton Ave Spartanburg, SC | 3.0 | 2.0 | 1450 | $1,475 | $1.02 | 21d | 1 | 0.36mi |
| 327 E Kennedy St Spartanburg, SC | 1.0–2.0 | 1.0–2.0 | 806 | $1,654 | $2.05 | 13d | 7 | 0.75mi |
| 717 Connecticut Ave Spartanburg, SC | 3.0 | 1.0 | 1320 | $1,895 | $1.44 | 13d | 1 | 0.90mi |
| 118 Morningside Dr Spartanburg, SC | 2.0 | 1.0 | 800 | $850 | $1.06 | 21d | 1 | 0.91mi |
| 116 Morningside Dr Spartanburg, SC | 2.0 | 1.0 | 800 | $850 | $1.06 | 21d | 1 | 0.93mi |
| 1097 Union St Spartanburg, SC | 1.0–2.0 | 1.0–2.0 | 951 | $2,009 | $2.11 | 13d | 21 | 0.96mi |
| 334 W Hampton Ave Unit 1 Spartanburg, SC | 2.0 | 1.0 | 895 | $1,100 | $1.23 | 21d | 1 | 0.99mi |
| 174 E Main St Spartanburg, SC | 1.0–2.0 | 1.0–2.0 | 760 | $2,295 | $3.02 | 13d | 8 | 1.01mi |
| 111 Timothy St Spartanburg, SC | 2.0 | 1.0 | 1100 | $1,600 | $1.45 | 21d | 1 | 1.04mi |
| 938 Logan St Unit A Spartanburg, SC | 2.0 | 2.5 | 980 | $1,600 | $1.63 | 21d | 1 | 1.04mi |
| 142 Magnolia St Unit 301 Spartanburg, SC | 2.0 | 2.0 | 937 | $1,850 | $1.97 | 21d | 1 | 1.20mi |
| 196 Silver Hill St Spartanburg, SC | 3.0 | 3.0 | 1492 | $1,900 | $1.27 | 21d | 1 | 1.21mi |
| 152 Avant St Unit A Spartanburg, SC | 2.0 | 1.0 | 850 | $1,250 | $1.47 | 13d | 1 | 1.24mi |
| 135 Oakwood Ave Spartanburg, SC | 1.0–2.0 | 1.0–1.5 | 850 | $995 | $1.17 | 21d | 2 | 1.30mi |
| 201 N Liberty St Spartanburg, SC | 3.0 | 1.0–2.0 | 1153 | $2,330 | $2.02 | 13d | 32 | 1.30mi |
| 624 Crescent Ave Unit 1 Spartanburg, SC | 2.0 | 1.0 | 819 | $1,000 | $1.22 | 21d | 1 | 1.33mi |
Listing history 17 events
-
2026-06-18days on market $134,000 Active 137 DOM
-
2026-06-17days on market $134,000 Active 136 DOM
-
2026-06-16days on market $134,000 Active 135 DOM
-
2026-06-15days on market $134,000 Active 134 DOM
-
2026-06-14days on market $134,000 Active 132 DOM
-
2026-06-13days on market $134,000 Active 131 DOM
-
2026-06-10days on market $134,000 Active 129 DOM
-
2026-06-09days on market $134,000 Active 128 DOM
-
2026-06-08days on market $134,000 Active 127 DOM
-
2026-06-07days on market $134,000 Active 126 DOM
-
2026-06-02days on market $134,000 Active 121 DOM
-
2026-06-01days on market $134,000 Active 120 DOM
-
2026-05-31days on market $134,000 Active 119 DOM
-
2026-05-30days on market $134,000 Active 118 DOM
-
2026-02-26price $134,000
-
2026-02-01$149,900 Active
-
2003-07-01soldstatus $30,000
ⓘ Source: listings_history table (triggers on properties + properties_extension) + one-shot
backfill from property_details.listing_events for pre-trigger history.
Tax reassessment forecast SC · Resets to sale price
- Current annual tax
- $906 · $76/mo
- Projected year-2 tax
- $906 · $76/mo
- Expected delta
- $0/yr ($0/mo · 0.0%)
ⓘ Screening estimate from a state-policy table — verify with the county assessor before closing.
Climate risk First Street
- Flood 1/10 Low FEMA zone X (unshaded) · 0% chance over 30 yrs
- Wildfire 3/10 Moderate
- Heat 6/10 Major 7 d/yr ≥105°F today · 16 d/yr by 30 yrs out
- Wind 2/10 Low 3% chance of damaging wind over 30 yrs
- Air quality 4/10 Moderate 4 unhealthy d/yr today · 4 by 30 yrs out
Nearby sold comps map
Loading sold comps map…
Walkable amenities ~0.75 mi
Loading nearby amenities…
Taxation est. · year 1
- Rental income
- $16,291
- − Mortgage interest
- −$7,506
- − Property taxes
- −$906
- − Insurance
- −$670
- − Repairs & maintenance
- −$1,303
- − Management
- −$1,303
- − Depreciation
- −$3,898
- Taxable income
- $704
- Est. tax owed @ 24.0%
- −$169
- After-tax cash flow
- $2,692/yr
For passive investors: Depreciation is non-cash, so a rental often shows a tax loss while cash-flowing — sheltering income. Rental losses are passive: they offset passive income freely, and up to $25,000/yr can offset ordinary (W-2) income if you actively participate and your MAGI is under $100k (phasing out to $0 by $150k); unused losses carry forward. On sale, claimed depreciation is recaptured at up to 25%, and gains may owe capital-gains tax (a 1031 exchange can defer both). Figures are a year-1 estimate at your 24.0% rate — not tax advice; consult a CPA.
Schools (NCES district)
- District
- Spartanburg 07
- NCES district ID
- 4503660
- Math proficiency
- 34% ▼ -1.00%
- Reading proficiency
- 41% ▼ -1.00%
- Median HH income
- $35,825
- Composite
- 31.04/100
- National rank
- #6087
- State rank
- #39 of 80 in SC
Livability — Spartanburg
- Score
- 76/100
- State rank
- #24
- US rank
- #3679
Category grades
Schools grade is shown separately in the Schools card above.
Census & demographics
- Census place
- Spartanburg, SC
- County
- Spartanburg County · 258,607 people
- City population
- 120,406
- Metro
- Spartanburg, SC
- Population (ZIP)
- 16,714
- Household income
- $41,356
- Rent vs Own
- Severe rent burden
- 1064.0
Population outlook (Spartanburg County) Hauer SSP2
- Today (2025)
- 325,495 people
- By 2030
- 338,800 · +4.1%
- By 2040
- 363,471 · +11.7%
- By 2050
- 384,156 · +18.0%
- By 2075
- 430,137 · +32.1%
- By 2100
- 442,733 · +36.0%
Race, ethnicity, and origin ACS 2023
- Neighborhood character
- Diverse neighborhood (Simpson 0.61)
- Race & ethnicity
- Black 50% White 36% Hispanic / Latino 10% Two or more races 9% Asian 1%
- Hispanic origin (detail)
- Mexican 7% Puerto Rican 2%
- Common ancestry
- Slovak 1% Serbian 1% Iranian 1%
- Foreign-born
- 7% · Canada
- Languages at home
- 90% English-only · Spanish 7% Other Indo-European 2%
Political lean MEDSL · Spartanburg
- 2024 margin
- Solid R (+33.6) · D 32.6% · R 66.2% · Other 1.2%
- 2008→2024 swing
- -12.0pp toward R · 2008: -21.6pp · 2024: -33.6pp
- All cycles
- 2024: R+33.6 2020: R+27.3 2016: R+30.0 2012: R+23.1 2008: R+21.6
Not yet ingested
- Civics
- —
Market trends
- HPI YoY
- ▼ -90.67%
- Current HPI
- 213.1266
- Rent YoY
- ▲ 3.46%
- Metro
- Spartanburg, SC
- State GDP YoY
- ▲ 4.51%
- F500 in state
- 2
Industry mix (Fortune 500 HQ in SC)
| Industry | F500 HQs | Revenue |
|---|---|---|
| Packaging | 1 | $7B |
|
||
Price history
+346.7% since first listed3 events — show timeline
- 2026-02-26 Price Changed $134,000 Greater Greenville MLS
- 2026-02-01 Listed $149,900 Greater Greenville MLS
- 2003-07-01 Sold (Public Records) $30,000 Public Records
Property tax history
+4.1%/yrLatest (2025): $906 · +1.1% YoY. Source: county tax records.
Cash-flow waterfall
monthlySold comps — $/sqft
last 12 mo · ≤1 miLoading sold comps…