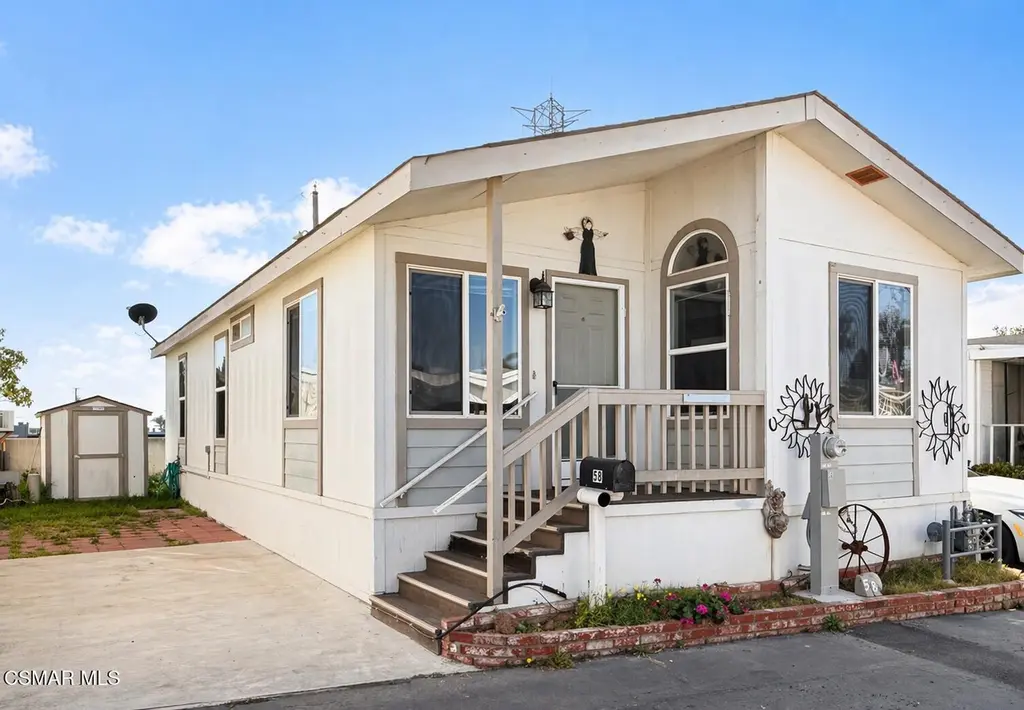
3900 E Main St #58 · San Buenaventura (Ventura), CA
Flood risk 1/10 · Minimal
- FEMA flood zone
- X (shaded)
- Chance of flooding over 30 yrs
- 0.0%
- Est. flood insurance / yr
- $507 – $1,088
Fire risk 1/10 · Minimal
- Est. fire insurance / yr
- $659 – $1,223
Heat risk 5/10 · Moderate
- Hot days now (above 85°F)
- 7 days/yr
- Hot days in 30 yrs
- 17 days/yr
Wind risk 1/10 · Minimal
- Chance of severe wind over 30 yrs
- —
Air-quality risk 7/10 · Major
- Unhealthy air days now
- 12 days/yr
- Unhealthy air days in 30 yrs
- 12 days/yr
Risk factors via First Street. Map © Google.
Why this score? — see what drove the C grade
The composite is a weighted blend of 9 inputs, each scored 0–100. Each bar is that input's sub-score; the figure is the points it added to the 100-point composite (weight × sub-score).
- Cash flow +27.6/30.0
- DSCR +9.7/10.0
- 1% rule +7.5/10.0
- Rent growth +4.0/5.0
- Schools +3.7/10.0
- Livability +2.5/5.0
- Condition / age +2.5/5.0
- ARV discount +0.2/15.0
- Appreciation +0.0/10.0
$220,000
🖨 Deal sheet 📄 Offer letter ✓ Due diligence
Listing remarks MLS
Welcome to this well-maintained home located at 3900 E Main Street in the desirable 55+ community of Sea Esta Village. Built in 2003, this 2-bedroom, 2-bath residence offers a bright and open layout with vaulted ceilings in the living room and kitchen, creating an inviting sense of space. The home features wood-like flooring throughout, fresh interior paint, and the convenience of indoor laundry. Enjoy added value with a Nuvo water filtration system, a Tuff Shed with electrical--perfect for storage or a workspace--and dedicated parking. Ideally situated in midtown Ventura, this home offers easy access to shopping, dining, and major retailers, along with convenient proximity to the 101 and 126 freeways. Just a short drive to Ventura's beaches and harbor, you'll enjoy coastal living and ocean breezes year-round. Residents of Sea Esta Village recently benefited from community road improvements within the park. This is a wonderful opportunity to enjoy comfortable, low-maintenance living in a central and highly accessible Ventura location- perfect for everyday living or a beachside getaway.
Key facts
- Dedicated parking
- Built 2003
- Listed 43 days
Tags
Property features AI
Finance
- Other: Includes Tuff Shed; Standard listing conditions
- Financial info: Listing accepts Cash, Conventional financing, or Cash to existing loan; property offered as-is; land lease type: Lease
Exterior
- Parking: No garage
- Home design: Residential property, single-story; Entry level: 2
- Construction: Built in 2003
- Exterior features: Ground-level entry with steps; No private pool or spa; Located in a senior community; No significant view
Interior
- Bedrooms: 2 bedrooms
- Flooring: Sheet vinyl
- Bathrooms: 2 full bathrooms
- Heating & cooling: Ceiling fan(s)
- Interior features: 880 sq ft living area (public records); No fireplace; Sheet vinyl flooring; Ceiling fan(s)
Neighborhood map
What this means for you Summary
Snapshot
- This is a 2-bed/2.0-bath manufactured listed at $220k.
Deal economics
- At list price, monthly cash flow is $658 ($8k/yr) — positive.
- The deal already cash-flows at list — no discount required.
- Meets the 1% rule at list price ($3k rent vs $220k).
- Recommended offer: $213k (3.0% below list) — sets the bar for market timing.
- Cap rate 9.9% vs local median 2.4% in San Buenaventura (Ventura) — top-decile yield for the area; either an underpriced asset or a hidden risk that comps aren't pricing in. Stress-test before assuming the spread holds.
Location & tenants
- Location reads: area grade C — affects rentability + tenant quality, not the cash-flow math above.
- Ventura Unified (urban): math 33% / reading 48% proficiency, ranked #218 of 517 in CA (top 42%) — families likely to look elsewhere, expect single-tenant / working-renter base with shorter leases.
- Market conditions: Rents rising fast (+5.9%/yr); 92 active listings in the ZIP; 24 comparable units currently listed for rent nearby; rentals at typical pace (median 22d on market — plan ~3-4 weeks tenant-placement turnaround); solid renter incomes; 1,759 units permitted in Ventura County in 2024 (1,196 in 5+ unit buildings).
- This rent runs 32% of the median local income ($104k/yr) — at the standard rent-burdened threshold; future hikes will face affordability resistance.
Forward outlook
- Local home prices are declining (-3.0%/yr); year-one equity from $2k of loan paydown is wiped out by about $7k of value loss. Plan a longer hold.
- Ventura County population projected at +4% by 2050 — modest demand growth; plan on rents tracking national, not racing it.
- At projected returns (-3.0% appreciation + 5.9% rent growth), your $62k cash investment doubles in ~8 years — after that, you're playing with house money.
Negotiation context
- It's been on market 43 days — a 3% lower offer ($213k) is reasonable based on typical stale-listing flexibility.
- 2 sale attempts with the ask held roughly flat each time — persistent listings suggest the price (not the market) is what's stuck; bring a comps-based counter.
Risks & watch-outs
- Climate carrying-cost: extreme-heat days projected 7→17/yr by 2055 (HVAC capex compounding) — expect insurance premiums to compound above CPI over the hold.
Questions for the listing agent
- It's been on market 43 days. Have you received any prior offers? Is the seller open to a 3% concession, seller financing, or rate buy-down credit?
- Is there a deadline driving the sale (1031 exchange, divorce, estate, relocation)? That informs how much negotiation room exists.
- What's the average days-on-market for RENTAL listings here right now (not sales)? A rising rental-DOM trend means longer vacancies and softer asking-rent achievability than the comps imply.
- What's the recent tenant-quality profile in this submarket — average credit score on applications, eviction rate, late-payment / NSF rate, and stable-employment percentage? A property-management company in the area should have these aggregated.
- How much new for-sale + rental construction is in the pipeline within 1–3 miles? Heavy new supply typically softens prices + rents 12–24 months out; constrained supply supports both.
Investment metrics
- 1% rule
- 1.25% ✓
- Cap rate
- 9.88%
- Cash-on-cash
- 12.81%
- DSCR
- 1.57
- GRM
- 6.6
CMA / ARV
- ARV (median comp)
- $189,469
- List price
- $220,000
- Delta
- 16.11%
- Verdict
- OVERPRICED
- Comps
- 2 within 1.0 mi
Show comp detail 3 sales within ~0.75 mi
| Address | Dist | Beds/Ba | Sqft | Sold | Price | $/sf | Match |
|---|---|---|---|---|---|---|---|
| 3900 E MAIN St #21 | 0.02mi | 2/1.0 | 1,008 (+14%) | 7mo | $207,000 | $205 | 65 |
| 3900 E Main St #36 | 0.02mi | 2/1.0 | 756 (-14%) | 17mo | $110,000 | $146 | 57 |
| 3900 E Main St #70 | 0.05mi | 2/1.5 | 750 (-15%) | 24mo | $100,000 | $133 | 51 |
Match score weights: distance 35% · size 25% · config 20% · recency 20%. Top-matched comps best support the ARV.
Projected returns pro-forma
-3.0% appreciation · 5.88% rent growth · sell at horizon
- IRR
- 5.9%
- Equity multiple
- 1.24×
- Total profit
- $14,499
- Equity at exit
- $32,803
- IRR
- 17.7%
- Equity multiple
- 2.66×
- Total profit
- $102,515
- Equity at exit
- $19,022
Cash invested: $61,600 (down + closing). Projections, not guarantees.
Landlord ↔ Tenant lean methodology
- Overall (STATE)
- 18 Strongly Tenant-Friendly
- State California
- 18 Strongly Tenant-Friendly · D+13
- County
- — inherits STATE
- City
- — inherits STATE
ZIP-level market 93003
- Rents YoY
- 5.9%
- Active inventory
- 92
- Price-to-rent
- 6.6×
Monthly cashflow live
- Estimated rent
- $2,757 high interval (Pro) →
- Mortgage (P&I)
- −$1,154
- Tax est. 1.5%
- −$275 /mo · $3,300/yr
- Insurance
- −$92
- HOA
- −$0
- Vacancy / Maint / Mgmt
- −$579
- Net cashflow
- $658
Break-even live
UW: 25.0% down · 7.5% · 30yr · 1.5% tax · 5.0% vac · 8.0% maint · 8.0% mgmt
Financing live
Cash to close
- Down payment
- $55,000
- Closing costs
- $6,600
- Reserves months
- —
- Total cash needed
- —
Loan-product check · same deal, 3 products live
Conventional
25% down · 7.5% · 30yr
- Down + closing
- —
- Monthly P&I
- —
- Monthly cashflow
- —
- DSCR
- —
- Eligible?
- —
Personal DTI + credit; lowest rate.
DSCR
20% down · 8.5% · 30yr
- Down + closing
- —
- Monthly P&I
- —
- Monthly cashflow
- —
- DSCR
- —
- Eligible?
- —
No personal income docs; deal must DSCR.
Hard money
10% down · 12.0% · 12mo
- Down + closing
- —
- Monthly P&I
- —
- Monthly cashflow
- —
- DSCR
- —
- Eligible?
- —
Short-term bridge; refi at stabilization.
Rent comps 24 comps
| Address | Beds | Baths | Sqft | Rent | $/sqft | DOM | Units | Dist |
|---|---|---|---|---|---|---|---|---|
| 3462 Preble Ave Unit 3462 Ventura, CA | 1.0 | 1.0 | 642 | $2,095 | $3.26 | 43d | 1 | 0.36mi |
| 618 Kirk Ave Unit 618 Ventura, CA | 2.0 | 1.0 | 910 | $2,395 | $2.63 | 23d | 1 | 0.41mi |
| 3364 Preble Ave Ventura, CA | 2.0 | 2.0 | 930 | $2,895 | $3.11 | 43d | 1 | 0.44mi |
| 609 Kirk Ave Unit 609 Ventura, CA | 1.0 | 1.0 | 642 | $1,995 | $3.11 | 3d | 1 | 0.44mi |
| 3357 Rexford St Ventura, CA | 2.0 | 2.0 | 1050 | $2,675 | $2.55 | 3d | 1 | 0.45mi |
| 3357 Rexford St Ventura, CA | 2.0 | 2.0 | 1050 | $2,675 | $2.55 | 2d | 1 | 0.45mi |
| 3357 Rexford St Ventura, CA | 2.0 | 2.0 | 1050 | $2,795 | $2.66 | 43d | 1 | 0.45mi |
| 3351 Rexford St Ventura, CA | 2.0 | 2.0 | 1050 | $2,675 | $2.55 | 3d | 1 | 0.46mi |
| 862 Empire Ave Unit 862 Ventura, CA | 1.0 | 1.0 | 786 | $2,050 | $2.61 | 2d | 1 | 0.46mi |
| 848 Weber Cir Ventura, CA | 1.0–2.0 | 1.0–2.0 | 845 | $4,169 | $4.93 | 1d | 47 | 0.71mi |
| 61 Redwood Ave Ventura, CA | 2.0 | 1.0 | 765 | $2,850 | $3.73 | 43d | 1 | 0.78mi |
| 61 Redwood Ave Ventura, CA | 2.0 | 1.0 | 785 | $3,050 | $3.89 | 23d | 1 | 0.78mi |
| 3098 Channel Dr Ventura, CA | 2.0 | 1.0 | 995 | $2,795 | $2.81 | 1d | 1 | 0.82mi |
| 3901 Sheldon Dr Ventura, CA | 1.0 | 1.0 | 625 | $2,295 | $3.67 | 16d | 2 | 0.91mi |
| 3438 San Luis St Unit 3438 Ventura, CA | 2.0 | 1.0 | 950 | $2,800 | $2.95 | 23d | 1 | 0.93mi |
| 1212 Chalmette Ave Ventura, CA | 2.0 | 1.0 | 882 | $2,350 | $2.66 | 43d | 1 | 1.12mi |
| 401 Rancho Dr Ventura, CA | 3.0 | 2.0 | 1093 | $5,500 | $5.03 | 43d | 1 | 1.19mi |
| 1300 Saratoga Ave #500 Ventura, CA | 2.0 | 1.0 | 873 | $2,900 | $3.32 | 3d | 1 | 1.26mi |
| 2767 Harbor Blvd Ventura, CA | 2.0 | 1.5 | 1046 | $3,500 | $3.35 | 43d | 1 | 1.27mi |
| 930 Pacific Strand Pl Ventura, CA | 1.0–2.0 | 1.0–2.0 | 946 | $3,245 | $3.43 | 2d | 11 | 1.27mi |
| 1300 Saratoga Ave Ventura, CA | 2.0–3.0 | 1.0–2.0 | 1004 | $2,295 | $2.29 | 43d | 2 | 1.35mi |
| 1300 Saratoga Ave Ventura, CA | 2.0 | 1.0–1.5 | 918 | $2,648 | $2.88 | 21d | 2 | 1.35mi |
| 5525 Ralston St Ventura, CA | 1.0 | 1.0 | 714 | $2,524 | $3.53 | 2d | 3 | 1.45mi |
| 1241 Cypress Point Ln Ventura, CA | 1.0–2.0 | 1.0–2.0 | 870 | $3,186 | $3.66 | 1d | 11 | 1.45mi |
Listing history 8 events
-
2026-06-07statusdays on market $220,000 Pending 43 DOM
-
2026-06-05days on market $220,000 Active 42 DOM
Show marketing remark (1108 chars)
Welcome to this well-maintained home located at 3900 E Main Street in the desirable 55+ community of Sea Esta Village. Built in 2003, this 2-bedroom, 2-bath residence offers a bright and open layout with vaulted ceilings in the living room and kitchen, creating an inviting sense of space. The home features wood-like flooring throughout, fresh interior paint, and the convenience of indoor laundry. Enjoy added value with a Nuvo water filtration system, a Tuff Shed with electrical--perfect for storage or a workspace--and dedicated parking. Ideally situated in midtown Ventura, this home offers easy access to shopping, dining, and major retailers, along with convenient proximity to the 101 and 126 freeways. Just a short drive to Ventura's beaches and harbor, you'll enjoy coastal living and ocean breezes year-round. Residents of Sea Esta Village recently benefited from community road improvements within the park. This is a wonderful opportunity to enjoy comfortable, low-maintenance living in a central and highly accessible Ventura location- perfect for everyday living or a beachside getaway.
-
2026-06-03days on market $220,000 Active 41 DOM
-
2026-06-02days on market $220,000 Active 40 DOM
-
2026-06-01days on market $220,000 Active 39 DOM
-
2026-05-31days on market $220,000 Active 38 DOM
-
2026-04-23$220,000 Active 1109-char remark
-
2026-04-22$220,000 Active 1108-char remark
Show marketing remark (1108 chars)
Welcome to this well-maintained home located at 3900 E Main Street in the desirable 55+ community of Sea Esta Village. Built in 2003, this 2-bedroom, 2-bath residence offers a bright and open layout with vaulted ceilings in the living room and kitchen, creating an inviting sense of space. The home features wood-like flooring throughout, fresh interior paint, and the convenience of indoor laundry. Enjoy added value with a Nuvo water filtration system, a Tuff Shed with electrical--perfect for storage or a workspace--and dedicated parking. Ideally situated in midtown Ventura, this home offers easy access to shopping, dining, and major retailers, along with convenient proximity to the 101 and 126 freeways. Just a short drive to Ventura's beaches and harbor, you'll enjoy coastal living and ocean breezes year-round. Residents of Sea Esta Village recently benefited from community road improvements within the park. This is a wonderful opportunity to enjoy comfortable, low-maintenance living in a central and highly accessible Ventura location- perfect for everyday living or a beachside getaway.
ⓘ Source: listings_history table (triggers on properties + properties_extension) + one-shot
backfill from property_details.listing_events for pre-trigger history.
Climate risk First Street
- Flood 1/10 Low FEMA zone X (shaded) · 0% chance over 30 yrs
- Wildfire 1/10 Low
- Heat 5/10 Major 7 d/yr ≥85°F today · 17 d/yr by 30 yrs out
- Wind 1/10 Low
- Air quality 7/10 Severe 12 unhealthy d/yr today · 12 by 30 yrs out
Nearby sold comps map
Loading sold comps map…
Walkable amenities ~0.75 mi
Loading nearby amenities…
Taxation est. · year 1
- Rental income
- $33,084
- − Mortgage interest
- −$12,323
- − Property taxes
- −$3,300
- − Insurance
- −$1,100
- − Repairs & maintenance
- −$2,647
- − Management
- −$2,647
- − Depreciation
- −$6,400
- Taxable income
- $4,667
- Est. tax owed @ 24.0%
- −$1,120
- After-tax cash flow
- $6,772/yr
For passive investors: Depreciation is non-cash, so a rental often shows a tax loss while cash-flowing — sheltering income. Rental losses are passive: they offset passive income freely, and up to $25,000/yr can offset ordinary (W-2) income if you actively participate and your MAGI is under $100k (phasing out to $0 by $150k); unused losses carry forward. On sale, claimed depreciation is recaptured at up to 25%, and gains may owe capital-gains tax (a 1031 exchange can defer both). Figures are a year-1 estimate at your 24.0% rate — not tax advice; consult a CPA.
Schools (NCES district)
- District
- Ventura Unified
- NCES district ID
- 0640980
- Math proficiency
- 33% ▼ -11.00%
- Reading proficiency
- 48% ▼ -7.00%
- Median HH income
- $67,362
- Composite
- 36.51/100
- National rank
- #4646
- State rank
- #218 of 517 in CA
Livability — San Buenaventura (Ventura)
No livability data for this city. (Only ~50 U.S. cities are tracked.)
Census & demographics
- Census place
- San Buenaventura (Ventura), CA
- County
- Ventura County · 829,955 people
- City population
- 83,837
- Metro
- Oxnard-Thousand Oaks-Ventura, CA
- Population (ZIP)
- 52,906
- Household income
- $103,761
- Rent vs Own
- Severe rent burden
- 2414.0
Population outlook (Ventura County) Hauer SSP2
- Today (2025)
- 895,754 people
- By 2030
- 912,134 · +1.8%
- By 2040
- 931,454 · +4.0%
- By 2050
- 934,609 · +4.3%
- By 2075
- 924,899 · +3.3%
- By 2100
- 864,712 · -3.5%
Race, ethnicity, and origin ACS 2023
- Neighborhood character
- Diverse neighborhood (Simpson 0.56)
- Race & ethnicity
- White 57% Hispanic / Latino 33% Two or more races 15% Asian 4% Black 1%
- Hispanic origin (detail)
- Mexican 27%
- Common ancestry
- Lithuanian 3% Italian 2% Slovak 2%
- Foreign-born
- 12% · Canada, Jamaica, China
- Languages at home
- 78% English-only · Spanish 17% Other Indo-European 1% Arabic 1%
Political lean MEDSL · Ventura
- 2024 margin
- D (+15.1) · D 56.1% · R 41.0% · Other 2.9%
- 2008→2024 swing
- +2.8pp toward D · 2008: 12.3pp · 2024: 15.1pp
- All cycles
- 2024: D+15.1 2020: D+21.1 2016: D+16.8 2012: D+5.3 2008: D+12.3
Not yet ingested
- Civics
- —
Market trends
- HPI YoY
- ▼ -1074.56%
- Current HPI
- 308.6282
- Rent YoY
- ▲ 5.88%
- Metro
- Oxnard-Thousand Oaks-Ventura, CA
- State GDP YoY
- ▲ 3.21%
- F500 in state
- 116
Industry mix (Fortune 500 HQ in CA)
| Industry | F500 HQs | Revenue |
|---|---|---|
| Technology | 27 | $1,492B |
|
||
| Financial Services | 3 | $174B |
|
||
| Retail | 3 | $44B |
|
||
| Insurance | 3 | $26B |
|
||
| Media / Entertainment | 2 | $115B |
|
||
| Pharmaceuticals / Biotech | 2 | $62B |
|
||
Price history
+0.0% since first listed4 events — show timeline
- 2026-06-05 Pending — CSMAR
- 2026-06-05 Pending — CSMAR
- 2026-04-23 Listed $220,000 CSMAR
- 2026-04-22 Listed $220,000 CSMAR
Cash-flow waterfall
monthlySold comps — $/sqft
last 12 mo · ≤1 miLoading sold comps…