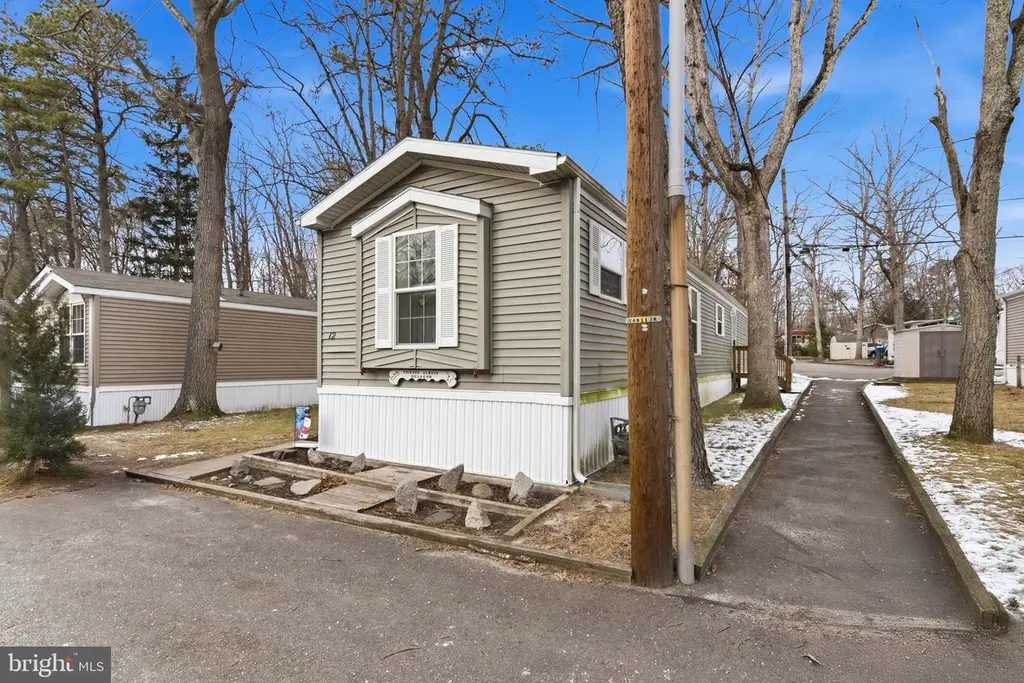
12 Lace Bark Ln · Vista Center, NJ
Flood risk 3/10 · Minor
- FEMA flood zone
- X (unshaded)
- Chance of flooding over 30 yrs
- 0.2%
- Est. flood insurance / yr
- $507 – $1,088
Fire risk 4/10 · Minor
- Est. fire insurance / yr
- $526 – $976
Heat risk 6/10 · Moderate
- Hot days now (above 101°F)
- 7 days/yr
- Hot days in 30 yrs
- 15 days/yr
Wind risk 6/10 · Moderate
- Chance of severe wind over 30 yrs
- 54.0%
Air-quality risk 4/10 · Minor
- Unhealthy air days now
- 4 days/yr
- Unhealthy air days in 30 yrs
- 5 days/yr
Risk factors via First Street. Map © Google.
Why this score? — see what drove the B- grade
The composite is a weighted blend of 9 inputs, each scored 0–100. Each bar is that input's sub-score; the figure is the points it added to the 100-point composite (weight × sub-score).
- Cash flow +30.0/30.0
- 1% rule +10.0/10.0
- DSCR +10.0/10.0
- ARV discount +8.9/15.0
- Schools +3.5/10.0
- Livability +2.9/5.0
- Condition / age +2.2/5.0
- Rent growth +2.1/5.0
- Appreciation +0.0/10.0
$115,000
🖨 Deal sheet 📄 Offer letter ✓ Due diligence
Listing remarks MLS
Don't miss your opportunity to call this charming 2 bedroom 1 bath, well maintained mobile home your new home. This home is situated on a dead end street in the welcoming community of Land O Pines in Jackson Township. Upon entering the home you are greeted with the livingroom/eat-in kitchen area. As you proceed down the hallway, you will find the 2nd bedroom with a large closet, the bathroom with deep tub and a stand up shower and the laundry area. The main bedroom sits at the far end with a large closet that has two doors for easier access to your belongings. Note: Land O Pines has a strict (2) person max occupancy limit per park rules
Key facts
- Large closet
- Deep tub
- Laundry area
Tags
Neighborhood map
What this means for you Summary
Snapshot
- This is a 2-bed/1.0-bath single-family listed at $115k. Condition is rated fair.
Deal economics
- At list price, monthly cash flow is $1k ($15k/yr) — positive.
- The deal already cash-flows at list — no discount required.
- Meets the 1% rule at list price ($3k rent vs $115k).
- Recommended offer: $101k (12.0% below list) — sets the bar for market timing.
- Cap rate 19.7% vs local median 3.3% in Vista Center — top-decile yield for the area; either an underpriced asset or a hidden risk that comps aren't pricing in. Stress-test before assuming the spread holds.
Location & tenants
- Location reads 58/100 on livability (#507 in NJ) — a working-class tenant base; expect higher turnover. Strengths: crime A+, employment A+, housing A+; Watch: schools D-, amenities F, commute F.
- Jackson Township School District (suburban): math 26% / reading 48% proficiency, ranked #228 of 472 in NJ (top 48%) — families likely to look elsewhere, expect single-tenant / working-renter base with shorter leases; only 15% free/reduced lunch — higher-income household profile.
- Market conditions: Rents soft (-1.7%/yr); 564 active listings in the ZIP; high-income renter base; 4,434 units permitted in Ocean County in 2024 (868 in 5+ unit buildings).
Forward outlook
- Local home prices are declining (-3.0%/yr); year-one equity from $795 of loan paydown is wiped out by about $3k of value loss. Plan a longer hold.
- Ocean County population projected to shrink 8% by 2050 — rents likely to lag national; underwrite the cash flow, not the appreciation.
- At projected returns (-3.0% appreciation + 0.0% rent growth), your $32k cash investment doubles in ~3 years — after that, you're playing with house money.
Negotiation context
- It's been on market 139 days — a 12% lower offer ($101k) is reasonable based on typical stale-listing flexibility.
- 2 sale attempts with the ask held roughly flat each time — persistent listings suggest the price (not the market) is what's stuck; bring a comps-based counter.
Risks & watch-outs
- Climate carrying-cost: major wind risk, 54% chance of damaging wind over 30y; extreme-heat days projected 7→15/yr by 2055 (HVAC capex compounding) — expect insurance premiums to compound above CPI over the hold.
Questions for the listing agent
- It's been on market 139 days. Have you received any prior offers? Is the seller open to a 12% concession, seller financing, or rate buy-down credit?
- Have any recent inspections been done? Can we get a copy of the seller's disclosures and any deferred-maintenance estimates?
- Why hasn't it sold? Are there any deal-killer items the seller is aware of (foundation, flood, title, zoning, code violations)?
- Is there a deadline driving the sale (1031 exchange, divorce, estate, relocation)? That informs how much negotiation room exists.
- Schools are D-rated, which usually means shorter tenancies and higher turnover. Who's the typical renter profile here, and what's been the actual vacancy rate?
- What's the average days-on-market for RENTAL listings here right now (not sales)? A rising rental-DOM trend means longer vacancies and softer asking-rent achievability than the comps imply.
- What's the recent tenant-quality profile in this submarket — average credit score on applications, eviction rate, late-payment / NSF rate, and stable-employment percentage? A property-management company in the area should have these aggregated.
- How much new for-sale + rental construction is in the pipeline within 1–3 miles? Heavy new supply typically softens prices + rents 12–24 months out; constrained supply supports both.
Investment metrics
- 1% rule
- 2.29% ✓
- Cap rate
- 19.67%
- Cash-on-cash
- 47.78%
- DSCR
- 3.13
- GRM
- 3.6
CMA / ARV
- ARV (median comp)
- $118,720
- List price
- $115,000
- Delta
- -3.13%
- Verdict
- FAIR
- Comps
- 7 within 1.0 mi
Show comp detail 4 sales within ~0.75 mi
| Address | Dist | Beds/Ba | Sqft | Sold | Price | $/sf | Match |
|---|---|---|---|---|---|---|---|
| 39 Marcia Memorial Cir | 0.00mi | 2/1.0 | 970 (+8%) | 7mo | $115,000 | $119 | 81 |
| 41 Marcia Memorial Cir | 0.06mi | 2/1.0 | 980 (+9%) | 14mo | $55,000 | $56 | 70 |
| 24 Lace Bark Ln | 0.01mi | 2/1.0 | 800 (-11%) | 14mo | $117,500 | $147 | 69 |
| 6 Lace Bark Ln | 0.00mi | 2/2.0 | 800 (-11%) | 23mo | $149,900 | $187 | 58 |
Match score weights: distance 35% · size 25% · config 20% · recency 20%. Top-matched comps best support the ARV.
Projected returns pro-forma
-3.0% appreciation · 0.0% rent growth · sell at horizon
- IRR
- 41.8%
- Equity multiple
- 2.72×
- Total profit
- $55,358
- Equity at exit
- $17,147
- IRR
- 46.5%
- Equity multiple
- 4.84×
- Total profit
- $123,738
- Equity at exit
- $9,943
Cash invested: $32,200 (down + closing). Projections, not guarantees.
Landlord ↔ Tenant lean methodology
- Overall (STATE)
- 21 Tenant-Leaning
- State New Jersey
- 21 Tenant-Leaning · D+6
- County
- — inherits STATE
- City
- — inherits STATE
ZIP-level market 08527
- Rents YoY
- -1.7%
- Active inventory
- 564
- Price-to-rent
- 3.6×
Monthly cashflow live
- Estimated rent
- $2,629 medium interval (Pro) →
- Mortgage (P&I)
- −$603
- Tax est. 1.5%
- −$144 /mo · $1,725/yr
- Insurance
- −$48
- HOA
- −$0
- Vacancy / Maint / Mgmt
- −$552
- Net cashflow
- $1,282
Break-even live
UW: 25.0% down · 7.5% · 30yr · 1.5% tax · 5.0% vac · 8.0% maint · 8.0% mgmt
Financing live
Cash to close
- Down payment
- $28,750
- Closing costs
- $3,450
- Reserves months
- —
- Total cash needed
- —
Loan-product check · same deal, 3 products live
Conventional
25% down · 7.5% · 30yr
- Down + closing
- —
- Monthly P&I
- —
- Monthly cashflow
- —
- DSCR
- —
- Eligible?
- —
Personal DTI + credit; lowest rate.
DSCR
20% down · 8.5% · 30yr
- Down + closing
- —
- Monthly P&I
- —
- Monthly cashflow
- —
- DSCR
- —
- Eligible?
- —
No personal income docs; deal must DSCR.
Hard money
10% down · 12.0% · 12mo
- Down + closing
- —
- Monthly P&I
- —
- Monthly cashflow
- —
- DSCR
- —
- Eligible?
- —
Short-term bridge; refi at stabilization.
Listing history 16 events
-
2026-06-18days on market $115,000 Active 139 DOM
-
2026-06-17days on market $115,000 Active 138 DOM
-
2026-06-16days on market $115,000 Active 137 DOM
-
2026-06-15days on market $115,000 Active 136 DOM
-
2026-06-13days on market $115,000 Active 134 DOM
-
2026-06-13days on market $115,000 Active 133 DOM
-
2026-06-09days on market $115,000 Active 130 DOM
-
2026-06-08days on market $115,000 Active 129 DOM
-
2026-06-07days on market $115,000 Active 128 DOM
-
2026-06-04days on market $115,000 Active 125 DOM
-
2026-06-03days on market $115,000 Active 124 DOM
-
2026-06-02days on market $115,000 Active 123 DOM
-
2026-06-01days on market $115,000 Active 122 DOM
-
2026-05-31days on market $115,000 Active 121 DOM
-
2026-01-30$115,000 Active 644-char remark
Show marketing remark (644 chars)
Don't miss your opportunity to call this charming 2 bedroom 1 bath, well maintained mobile home your new home. This home is situated on a dead end street in the welcoming community of Land O Pines in Jackson Township. Upon entering the home you are greeted with the livingroom/eat-in kitchen area. As you proceed down the hallway, you will find the 2nd bedroom with a large closet, the bathroom with deep tub and a stand up shower and the laundry area. The main bedroom sits at the far end with a large closet that has two doors for easier access to your belongings. Note: Land O Pines has a strict (2) person max occupancy limit per park rules
-
2026-01-28$115,000 Active 663-char remark
Show marketing remark (663 chars)
Motivated Seller!! Don't miss your opportunity to call this charming 2 bedroom 1 bath, well maintained mobile home your new home. This home is situated on a dead end street in the welcoming community of Land O Pines in Jackson Township. Upon entering the home you are greeted with the livingroom/eat-in kitchen area. As you proceed down the hallway, you will find the 2nd bedroom with a large closet, the bathroom with deep tub and a stand up shower and the laundry area. The main bedroom sits at the far end with a large closet that has two doors for easier access to your belongings. Note: Land O Pines has a strict (2) person max occupancy limit per park rules
ⓘ Source: listings_history table (triggers on properties + properties_extension) + one-shot
backfill from property_details.listing_events for pre-trigger history.
Climate risk First Street
- Flood 3/10 Moderate FEMA zone X (unshaded) · 20% chance over 30 yrs
- Wildfire 4/10 Moderate
- Heat 6/10 Major 7 d/yr ≥101°F today · 15 d/yr by 30 yrs out
- Wind 6/10 Major 54% chance of damaging wind over 30 yrs
- Air quality 4/10 Moderate 4 unhealthy d/yr today · 5 by 30 yrs out
Nearby sold comps map
Loading sold comps map…
Walkable amenities ~0.75 mi
Loading nearby amenities…
Taxation est. · year 1
- Rental income
- $31,547
- − Mortgage interest
- −$6,442
- − Property taxes
- −$1,725
- − Insurance
- −$575
- − Repairs & maintenance
- −$2,524
- − Management
- −$2,524
- − Depreciation
- −$3,345
- Taxable income
- $14,412
- Est. tax owed @ 24.0%
- −$3,459
- After-tax cash flow
- $11,926/yr
For passive investors: Depreciation is non-cash, so a rental often shows a tax loss while cash-flowing — sheltering income. Rental losses are passive: they offset passive income freely, and up to $25,000/yr can offset ordinary (W-2) income if you actively participate and your MAGI is under $100k (phasing out to $0 by $150k); unused losses carry forward. On sale, claimed depreciation is recaptured at up to 25%, and gains may owe capital-gains tax (a 1031 exchange can defer both). Figures are a year-1 estimate at your 24.0% rate — not tax advice; consult a CPA.
Condition & rehab AI · 12 photos
This mobile home requires moderate repairs and maintenance to improve its condition and increase its value.
Repairs flagged
- Major wooden deck — rotting and unstable
- Major exterior siding — gray siding appears worn
Value-add opportunities
- Both paint interior walls — enhances curb appeal and interior aesthetics
- Both replace carpeted flooring — improves comfort and reduces maintenance
- Both repair wooden deck — restores functionality and enhances curb appeal
Renovation cost estimate screening
| Repair item | Severity | Est. cost |
|---|---|---|
| wooden deck · rotting and unstable | Major | $15,000–50,000 |
| exterior siding · gray siding appears worn | Major | $15,000–50,000 |
| Total estimated repair cost · 2 items | $30,000–100,000 |
Value-add ROI direction
- Both paint interior walls — enhances curb appeal and interior aesthetics ↑
- Both replace carpeted flooring — improves comfort and reduces maintenance ↑
- Both repair wooden deck — restores functionality and enhances curb appeal ↑
ⓘ Cost ranges are severity-bucket heuristics (US national rule-of-thumb). Get contractor quotes + a written scope before underwriting a rehab budget.
Schools (NCES district)
- District
- Jackson Township School District
- NCES district ID
- 3407740
- Math proficiency
- 26% ▼ -22.00%
- Reading proficiency
- 48% ▼ -8.00%
- Median HH income
- $86,012
- Composite
- 35.36/100
- National rank
- #4956
- State rank
- #228 of 472 in NJ
Livability — Vista Center
- Score
- 58/100
- State rank
- #507
- US rank
- #21522
Category grades
Schools grade is shown separately in the Schools card above.
Census & demographics
- County
- Ocean County · 439,426 people
- Metro
- New York-Newark-Jersey City, NY-NJ-PA
- Population (ZIP)
- 58,991
- Household income
- $115,487
- Rent vs Own
- Severe rent burden
- 1031.0
Population outlook (Ocean County) Hauer SSP2
- Today (2025)
- 586,991 people
- By 2030
- 581,403 · -1.0%
- By 2040
- 564,913 · -3.8%
- By 2050
- 538,149 · -8.3%
- By 2075
- 468,845 · -20.1%
- By 2100
- 350,297 · -40.3%
Race, ethnicity, and origin ACS 2023
- Neighborhood character
- Predominantly White (76%)
- Race & ethnicity
- White 76% Hispanic / Latino 14% Two or more races 8% Black 4% Asian 3%
- Hispanic origin (detail)
- Mexican 1% Puerto Rican 6%
- Common ancestry
- Romanian 9% Scotch-Irish 2% Italian 2%
- Foreign-born
- 9% · Canada, China, Jamaica
- Languages at home
- 88% English-only · Spanish 6% Other Indo-European 2% German/W. Germanic 1%
Political lean MEDSL · Ocean
- 2024 margin
- Solid R (+36.0) · D 31.4% · R 67.4% · Other 1.2%
- 2008→2024 swing
- -17.6pp toward R · 2008: -18.4pp · 2024: -36.0pp
- All cycles
- 2024: R+36.0 2020: R+28.7 2016: R+34.0 2012: R+17.7 2008: R+18.4
Not yet ingested
- Civics
- —
Market trends
- HPI YoY
- ▼ -349.94%
- Current HPI
- 338.3328
- Rent YoY
- ▼ -1.71%
- Metro
- New York-Newark-Jersey City, NY-NJ-PA
- State GDP YoY
- ▲ 2.05%
- F500 in state
- 34
Industry mix (Fortune 500 HQ in NJ)
| Industry | F500 HQs | Revenue |
|---|---|---|
| Consumer Goods | 3 | $31B |
|
||
| Pharmaceuticals | 2 | $153B |
|
||
| Technology | 2 | $21B |
|
||
| Insurance | 2 | $20B |
|
||
| Healthcare | 2 | $19B |
|
||
| Financial Services | 1 | $70B |
|
||
Price history
+0.0% since first listed2 events — show timeline
- 2026-01-30 Listed $115,000 BRIGHT MLS
- 2026-01-28 Listed $115,000 MOMLS
Cash-flow waterfall
monthlySold comps — $/sqft
last 12 mo · ≤1 miLoading sold comps…