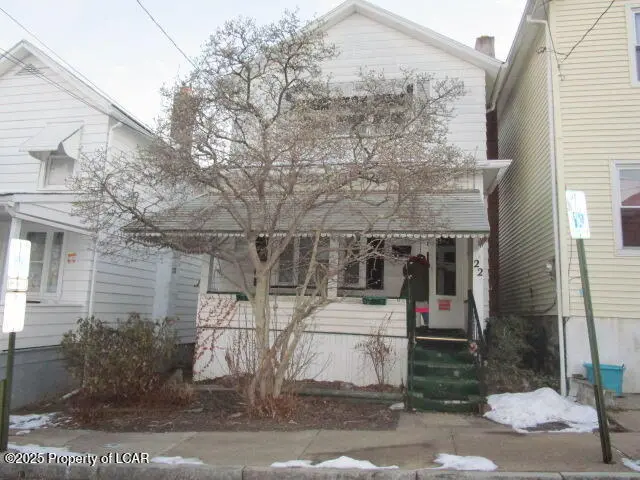
22 John St · Wilkes-Barre, PA
Flood risk 1/10 · Minimal
- FEMA flood zone
- X (unshaded)
- Chance of flooding over 30 yrs
- 0.0%
- Est. flood insurance / yr
- $507 – $1,088
Fire risk 2/10 · Minimal
- Est. fire insurance / yr
- $511 – $949
Heat risk 4/10 · Minor
- Hot days now (above 95°F)
- 7 days/yr
- Hot days in 30 yrs
- 16 days/yr
Wind risk 3/10 · Minor
- Chance of severe wind over 30 yrs
- 5.0%
Air-quality risk 3/10 · Minor
- Unhealthy air days now
- 2 days/yr
- Unhealthy air days in 30 yrs
- 4 days/yr
Risk factors via First Street. Map © Google.
Why this score? — see what drove the B+ grade
The composite is a weighted blend of 9 inputs, each scored 0–100. Each bar is that input's sub-score; the figure is the points it added to the 100-point composite (weight × sub-score).
- Cash flow +30.0/30.0
- ARV discount +15.0/15.0
- 1% rule +10.0/10.0
- DSCR +10.0/10.0
- Rent growth +4.2/5.0
- Livability +2.5/5.0
- Condition / age +2.5/5.0
- Schools +2.1/10.0
- Appreciation +0.0/10.0
$85,500
🖨 Deal sheet 📄 Offer letter ✓ Due diligence
Listing remarks MLS
Three bedroom one bath single, gas heat, small yard, storage shed. Property is HUD owned and being sold in as is condition, buyer pays all transfer tax, occupancy fees and deed prep, for additional information and to place a bid go too www. hudhomestore. gov case # 441-919952
Key facts
- Listed 142 days
Neighborhood map
What this means for you Summary
Snapshot
- This is a 3-bed/1.0-bath single-family listed at $86k.
Deal economics
- At list price, monthly cash flow is $578 ($7k/yr) — positive.
- The deal already cash-flows at list — no discount required.
- Meets the 1% rule at list price ($1k rent vs $86k).
- Recommended offer: $75k (12.0% below list) — sets the bar for market timing.
- Cap rate 14.4% vs local median 5.7% in Wilkes-Barre — top-decile yield for the area; either an underpriced asset or a hidden risk that comps aren't pricing in. Stress-test before assuming the spread holds.
Location & tenants
- Location reads: area grade B — affects rentability + tenant quality, not the cash-flow math above.
- Wilkes-Barre Area SD (urban): math 19% / reading 32% proficiency, ranked #469 of 539 in PA (top 87%) — low school quality limits family demand, transient renter base, plan for 1-2y turnover; 61% free/reduced lunch — lower-income household profile, screen leases tightly.
- Market conditions: Rents rising fast (+6.8%/yr); 221 active listings in the ZIP; 26 comparable units currently listed for rent nearby; rentals at typical pace (median 22d on market — plan ~3-4 weeks tenant-placement turnaround); 42% of comp listings sitting > 30 days — soft ceiling on asking rent; 349 units permitted in Luzerne County in 2024 (16 in 5+ unit buildings).
- This rent runs 31% of the median local income ($56k/yr) — at the standard rent-burdened threshold; future hikes will face affordability resistance.
Forward outlook
- Local home prices are declining (-3.0%/yr); year-one equity from $591 of loan paydown is wiped out by about $3k of value loss. Plan a longer hold.
- Luzerne County population projected at +4% by 2050 — modest demand growth; plan on rents tracking national, not racing it.
- At projected returns (-3.0% appreciation + 6.8% rent growth), your $24k cash investment doubles in ~4 years — after that, you're playing with house money.
Negotiation context
- It's been on market 142 days — a 12% lower offer ($75k) is reasonable based on typical stale-listing flexibility.
Risks & watch-outs
- Watch-outs: built in 1928 — expect roof / HVAC / electrical / plumbing capex.
Questions for the listing agent
- It's been on market 142 days. Have you received any prior offers? Is the seller open to a 12% concession, seller financing, or rate buy-down credit?
- Built in 1928 — when were the roof, HVAC, electrical panel, plumbing, and water heater last replaced?
- Why hasn't it sold? Are there any deal-killer items the seller is aware of (foundation, flood, title, zoning, code violations)?
- Is there a deadline driving the sale (1031 exchange, divorce, estate, relocation)? That informs how much negotiation room exists.
- What's the average days-on-market for RENTAL listings here right now (not sales)? A rising rental-DOM trend means longer vacancies and softer asking-rent achievability than the comps imply.
- What's the recent tenant-quality profile in this submarket — average credit score on applications, eviction rate, late-payment / NSF rate, and stable-employment percentage? A property-management company in the area should have these aggregated.
- How much new for-sale + rental construction is in the pipeline within 1–3 miles? Heavy new supply typically softens prices + rents 12–24 months out; constrained supply supports both.
Investment metrics
- 1% rule
- 1.73% ✓
- Cap rate
- 14.40%
- Cash-on-cash
- 28.96%
- DSCR
- 2.29
- GRM
- 4.8
CMA / ARV
- ARV (median comp)
- $141,527
- List price
- $85,500
- Delta
- -39.59%
- Verdict
- UNDERPRICED
- Comps
- 20 within 1.0 mi
Show comp detail 12 sales within ~0.75 mi
| Address | Dist | Beds/Ba | Sqft | Sold | Price | $/sf | Match |
|---|---|---|---|---|---|---|---|
| 16 Ralph St | 0.09mi | 3/1.5 | 1,280 (-1%) | 5mo | $137,000 | $107 | 88 |
| 124 Wyoming St | 0.30mi | 3/1.0 | 1,274 (-1%) | 0mo | $130,000 | $102 | 84 |
| 59 Bowman St | 0.32mi | 3/1.0 | 1,300 (+1%) | 3mo | $176,000 | $135 | 82 |
| 34 Kidder St | 0.34mi | 3/1.0 | 1,235 (-4%) | 2mo | $140,000 | $113 | 75 |
| 97 Kidder St | 0.27mi | 3/1.0 | 1,214 (-6%) | 8mo | $135,000 | $111 | 72 |
| 178 Kidder St | 0.21mi | 3/2.0 | 1,394 (+8%) | 3mo | $187,000 | $134 | 70 |
| 27 Harry St | 0.12mi | 3/1.0 | 1,460 (+13%) | 6mo | $138,500 | $95 | 67 |
| 43 Kidder St | 0.33mi | 3/1.5 | 1,400 (+9%) | 2mo | $160,000 | $114 | 66 |
| 734 Pennsylvania Ave | 0.46mi | 3/1.0 | 1,220 (-5%) | 5mo | $140,000 | $115 | 66 |
| 281 Kidder St | 0.32mi | 3/1.0 | 1,450 (+12%) | 2mo | $150,000 | $103 | 62 |
| 294 Kidder St | 0.32mi | 3/1.0 | 1,462 (+13%) | 2mo | $190,000 | $130 | 61 |
| 116 Darling St | 0.50mi | 3/1.0 | 1,428 (+11%) | 1mo | $170,000 | $119 | 58 |
Match score weights: distance 35% · size 25% · config 20% · recency 20%. Top-matched comps best support the ARV.
Projected returns pro-forma
-3.0% appreciation · 6.84% rent growth · sell at horizon
- IRR
- 27.6%
- Equity multiple
- 2.21×
- Total profit
- $28,897
- Equity at exit
- $12,748
- IRR
- 37.3%
- Equity multiple
- 5.14×
- Total profit
- $98,996
- Equity at exit
- $7,392
Cash invested: $23,940 (down + closing). Projections, not guarantees.
Landlord ↔ Tenant lean methodology
- Overall (STATE)
- 62 Landlord-Friendly
- State Pennsylvania
- 62 Landlord-Friendly · EVEN
- County
- — inherits STATE
- City
- — inherits STATE
ZIP-level market 18702
- Rents YoY
- 6.8%
- Active inventory
- 221
- Price-to-rent
- 4.8×
Monthly cashflow live
- Estimated rent
- $1,479 high interval (Pro) →
- Mortgage (P&I)
- −$448
- Tax est. 1.5%
- −$107 /mo · $1,282/yr
- Insurance
- −$36
- HOA
- −$0
- Vacancy / Maint / Mgmt
- −$311
- Net cashflow
- $578
Break-even live
UW: 25.0% down · 7.5% · 30yr · 1.5% tax · 5.0% vac · 8.0% maint · 8.0% mgmt
Financing live
Cash to close
- Down payment
- $21,375
- Closing costs
- $2,565
- Reserves months
- —
- Total cash needed
- —
Loan-product check · same deal, 3 products live
Conventional
25% down · 7.5% · 30yr
- Down + closing
- —
- Monthly P&I
- —
- Monthly cashflow
- —
- DSCR
- —
- Eligible?
- —
Personal DTI + credit; lowest rate.
DSCR
20% down · 8.5% · 30yr
- Down + closing
- —
- Monthly P&I
- —
- Monthly cashflow
- —
- DSCR
- —
- Eligible?
- —
No personal income docs; deal must DSCR.
Hard money
10% down · 12.0% · 12mo
- Down + closing
- —
- Monthly P&I
- —
- Monthly cashflow
- —
- DSCR
- —
- Eligible?
- —
Short-term bridge; refi at stabilization.
Rent comps 26 comps
| Address | Beds | Baths | Sqft | Rent | $/sqft | DOM | Units | Dist |
|---|---|---|---|---|---|---|---|---|
| 535 N Franklin St Wilkes Barre, PA | 3.0 | 1.0 | 1148 | $1,359 | $1.18 | 21d | 1 | 0.36mi |
| 301 N Main St Unit 2 Wilkes-Barre, PA | 3.0 | 1.0 | 1050 | $1,300 | $1.24 | 21d | 1 | 0.37mi |
| 423 Scott St Apt 1 Wilkes-Barre, PA | 3.0 | 1.0 | 1100 | $1,450 | $1.32 | 44d | 1 | 0.39mi |
| 131 Scott St Wilkes-Barre Township, PA | 2.0 | 1.0 | 1144 | $1,300 | $1.14 | 44d | 1 | 0.41mi |
| 572 N Franklin St Wilkes Barre, PA | 2.0 | 1.0 | 1042 | $1,050 | $1.01 | 21d | 1 | 0.42mi |
| 572 N Franklin St Wilkes Barre, PA | 2.0 | 1.0 | 1042 | $1,100 | $1.06 | 44d | 1 | 0.42mi |
| 261 N Washington St Wilkes Barre, PA | 3.0 | 1.0 | 1050 | $1,400 | $1.33 | 44d | 1 | 0.43mi |
| 37 Wyoming St Wilkes Barre, PA | 4.0 | 1.0 | 1300 | $2,200 | $1.69 | 21d | 1 | 0.44mi |
| 746 N Washington St Unit 1 Wilkes-Barre, PA | 3.0 | 2.0 | 1573 | $1,500 | $0.95 | 21d | 1 | 0.57mi |
| 13 E Chestnut St Unit 1 Wilkes-Barre, PA | 3.0 | 1.0 | 900 | $1,195 | $1.33 | 44d | 1 | 0.62mi |
| 2 N Diamond St Wilkes-Barre, PA | 3.0 | 1.0 | 1000 | $1,500 | $1.50 | 21d | 1 | 0.64mi |
| 98 N Franklin St Unit 2 Wilkes-Barre, PA | 2.0 | 2.0 | 1254 | $1,650 | $1.32 | 14d | 1 | 0.81mi |
| 67-69 Public Sq Wilkes-Barre, PA | 2.0 | 1.0 | 910 | $1,875 | $2.06 | 44d | 1 | 0.96mi |
| 100 Parkway Blvd Kingston, PA | 2.0 | 1.0 | 650 | $1,400 | $2.15 | 14d | 1 | 0.96mi |
| 19 N River St Unit 308 Wilkes-Barre, PA | 2.0 | 1.5 | 910 | $1,600 | $1.76 | 14d | 1 | 0.97mi |
| 67-69 Public Sq #1203 Wilkes Barre, PA | 2.0 | 1.0 | 875 | $1,825 | $2.09 | 44d | 1 | 0.97mi |
| 38 W Market St Unit 3 Wilkes-Barre, PA | 2.0 | 1.0 | 1388 | $1,295 | $0.93 | 14d | 1 | 0.99mi |
| 36 Logan St Wilkes-Barre, PA | 3.0 | 1.0 | 1200 | $1,125 | $0.94 | 44d | 1 | 1.00mi |
| 51 S Welles St Wilkes Barre, PA | 4.0 | 1.0 | 1344 | $1,600 | $1.19 | 44d | 1 | 1.03mi |
| 115 1st Ave Unit 115 Kingston, PA | 3.0 | 1.0 | 1200 | $1,495 | $1.25 | 14d | 1 | 1.11mi |
| 40 N Dawes Ave Kingston, PA | 3.0 | 1.5 | 1450 | $1,800 | $1.24 | 21d | 1 | 1.13mi |
| 400 N Gates Ave Unit 1 Kingston, PA | 2.0 | 2.0 | 1198 | $1,300 | $1.09 | 44d | 1 | 1.18mi |
| 73 2nd Ave Kingston, PA | 2.0 | 1.0 | 1200 | $950 | $0.79 | 21d | 1 | 1.20mi |
| 92 S Diamond St Wilkes-Barre, PA | 3.0 | 1.0 | 1150 | $1,400 | $1.22 | 44d | 1 | 1.34mi |
| 11 Holiday Dr Kingston, PA | 1.0–3.0 | 1.0–2.5 | 1083 | $2,639 | $2.44 | 14d | 14 | 1.38mi |
| 27 S Gates Ave Kingston, PA | 3.0 | 2.0 | 1200 | $1,750 | $1.46 | 21d | 1 | 1.47mi |
Listing history 5 events
-
2026-05-11status Pending 278-char remark
Show marketing remark (278 chars)
Three bedroom one bath single, gas heat, small yard, storage shed. Property is HUD owned and being sold in as is condition, buyer pays all transfer tax, occupancy fees and deed prep, for additional information and to place a bid go too www. hudhomestore. gov case # 441-919952
-
2026-05-01price $85,500 278-char remark
Show marketing remark (278 chars)
Three bedroom one bath single, gas heat, small yard, storage shed. Property is HUD owned and being sold in as is condition, buyer pays all transfer tax, occupancy fees and deed prep, for additional information and to place a bid go too www. hudhomestore. gov case # 441-919952
-
2026-03-31price $94,500 278-char remark
Show marketing remark (278 chars)
Three bedroom one bath single, gas heat, small yard, storage shed. Property is HUD owned and being sold in as is condition, buyer pays all transfer tax, occupancy fees and deed prep, for additional information and to place a bid go too www. hudhomestore. gov case # 441-919952
-
2026-02-04price $104,500 278-char remark
Show marketing remark (278 chars)
Three bedroom one bath single, gas heat, small yard, storage shed. Property is HUD owned and being sold in as is condition, buyer pays all transfer tax, occupancy fees and deed prep, for additional information and to place a bid go too www. hudhomestore. gov case # 441-919952
-
2025-12-20$116,000 Active 278-char remark
Show marketing remark (278 chars)
Three bedroom one bath single, gas heat, small yard, storage shed. Property is HUD owned and being sold in as is condition, buyer pays all transfer tax, occupancy fees and deed prep, for additional information and to place a bid go too www. hudhomestore. gov case # 441-919952
ⓘ Source: listings_history table (triggers on properties + properties_extension) + one-shot
backfill from property_details.listing_events for pre-trigger history.
Climate risk First Street
- Flood 1/10 Low FEMA zone X (unshaded) · 0% chance over 30 yrs
- Wildfire 2/10 Low
- Heat 4/10 Moderate 7 d/yr ≥95°F today · 16 d/yr by 30 yrs out
- Wind 3/10 Moderate 5% chance of damaging wind over 30 yrs
- Air quality 3/10 Moderate 2 unhealthy d/yr today · 4 by 30 yrs out
Nearby sold comps map
Loading sold comps map…
Walkable amenities ~0.75 mi
Loading nearby amenities…
Taxation est. · year 1
- Rental income
- $17,751
- − Mortgage interest
- −$4,789
- − Property taxes
- −$1,282
- − Insurance
- −$428
- − Repairs & maintenance
- −$1,420
- − Management
- −$1,420
- − Depreciation
- −$2,487
- Taxable income
- $5,924
- Est. tax owed @ 24.0%
- −$1,422
- After-tax cash flow
- $5,511/yr
For passive investors: Depreciation is non-cash, so a rental often shows a tax loss while cash-flowing — sheltering income. Rental losses are passive: they offset passive income freely, and up to $25,000/yr can offset ordinary (W-2) income if you actively participate and your MAGI is under $100k (phasing out to $0 by $150k); unused losses carry forward. On sale, claimed depreciation is recaptured at up to 25%, and gains may owe capital-gains tax (a 1031 exchange can defer both). Figures are a year-1 estimate at your 24.0% rate — not tax advice; consult a CPA.
Schools (NCES district)
- District
- Wilkes-Barre Area SD
- NCES district ID
- 4226300
- Math proficiency
- 19% ▼ -2.00%
- Reading proficiency
- 32% ▼ -9.00%
- Median HH income
- $37,420
- Composite
- 21.22/100
- National rank
- #8409
- State rank
- #469 of 539 in PA
Livability — Wilkes-Barre
No livability data for this city. (Only ~50 U.S. cities are tracked.)
Census & demographics
- Census place
- Wilkes-Barre, PA
- County
- Luzerne County · 118,885 people
- City population
- 73,981
- Metro
- Scranton--Wilkes-Barre, PA
- Population (ZIP)
- 41,970
- Household income
- $56,378
- Rent vs Own
- Severe rent burden
- 1632.0
Population outlook (Luzerne County) Hauer SSP2
- Today (2025)
- 319,505 people
- By 2030
- 319,943 · +0.1%
- By 2040
- 322,643 · +1.0%
- By 2050
- 330,817 · +3.5%
- By 2075
- 379,145 · +18.7%
- By 2100
- 431,908 · +35.2%
Race, ethnicity, and origin ACS 2023
- Neighborhood character
- Diverse neighborhood (Simpson 0.59)
- Race & ethnicity
- White 58% Hispanic / Latino 25% Black 12% Two or more races 11% Asian 2%
- Hispanic origin (detail)
- Mexican 6% Puerto Rican 6% Dominican 9%
- Common ancestry
- Romanian 14% Scotch-Irish 2% Iranian 1%
- Foreign-born
- 13% · Canada, Jamaica
- Languages at home
- 79% English-only · Spanish 17% Other Asian/Pacific 1% Other Indo-European 1%
Political lean MEDSL · Luzerne
- 2024 margin
- R (+19.2) · D 40.0% · R 59.2%
- 2008→2024 swing
- -27.6pp toward R · 2008: 8.4pp · 2024: -19.2pp
- All cycles
- 2024: R+19.2 2020: R+14.4 2016: R+19.6 2012: D+4.8 2008: D+8.4
Not yet ingested
- Civics
- —
Market trends
- HPI YoY
- ▼ -156.99%
- Current HPI
- 216.9373
- Rent YoY
- ▲ 6.84%
- Metro
- Scranton--Wilkes-Barre, PA
- State GDP YoY
- ▲ 1.68%
- F500 in state
- 34
Industry mix (Fortune 500 HQ in PA)
| Industry | F500 HQs | Revenue |
|---|---|---|
| Healthcare | 2 | $309B |
|
||
| Insurance | 2 | $27B |
|
||
| Telecommunications / Media | 1 | $124B |
|
||
| Industrial Distribution | 1 | $22B |
|
||
| Financial Services | 1 | $20B |
|
||
| Chemicals / Materials | 1 | $18B |
|
||
Price history
-26.3% since first listed5 events — show timeline
- 2026-05-11 Pending — LCAR
- 2026-05-01 Price Changed $85,500 LCAR
- 2026-03-31 Price Changed $94,500 LCAR
- 2026-02-04 Price Changed $104,500 LCAR
- 2025-12-20 Listed $116,000 LCAR
Property tax history
+20.4%/yrLatest (2026): $9,458 · +0.1% YoY. Source: county tax records.
Cash-flow waterfall
monthlySold comps — $/sqft
last 12 mo · ≤1 miLoading sold comps…