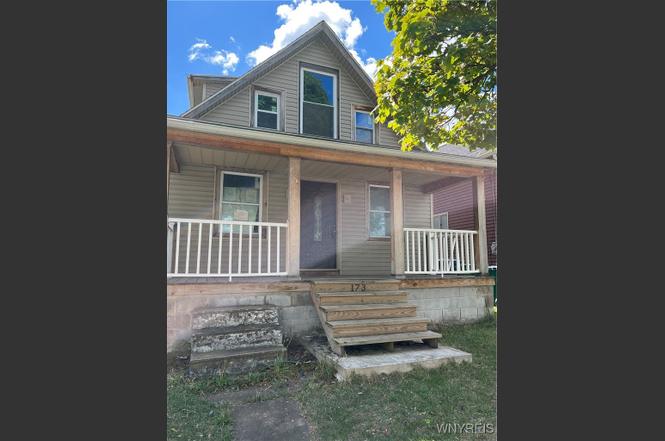
173 Grace St · Buffalo, NY
Flood risk 6/10 · Moderate
- FEMA flood zone
- X (unshaded)
- Chance of flooding over 30 yrs
- 0.73%
- Est. flood insurance / yr
- $507 – $1,088
Fire risk 1/10 · Minimal
- Est. fire insurance / yr
- $691 – $1,283
Heat risk 3/10 · Minor
- Hot days now (above 93°F)
- 7 days/yr
- Hot days in 30 yrs
- 15 days/yr
Wind risk 1/10 · Minimal
- Chance of severe wind over 30 yrs
- —
Air-quality risk 4/10 · Minor
- Unhealthy air days now
- 4 days/yr
- Unhealthy air days in 30 yrs
- 9 days/yr
Risk factors via First Street. Map © Google.
Why this score? — see what drove the B+ grade
The composite is a weighted blend of 9 inputs, each scored 0–100. Each bar is that input's sub-score; the figure is the points it added to the 100-point composite (weight × sub-score).
- Cash flow +30.0/30.0
- ARV discount +15.0/15.0
- 1% rule +10.0/10.0
- DSCR +10.0/10.0
- Rent growth +4.5/5.0
- Livability +3.9/5.0
- Schools +3.3/10.0
- Condition / age +2.5/5.0
- Appreciation +0.0/10.0
$80,000
🖨 Deal sheet (PDF) 📄 Offer letter ✓ Due diligence
Listing remarks MLS
Priced to sell!!! This single family home sits on a good size lot on a quiet dead end street. Great opportunity for owner occupy or investment with a little elbow grease. Newer heating system.
Key facts
- Shopping plazas
- New porch
- Private yard
Tags
Neighborhood map
What this means for you Summary
Snapshot
- This is a 2-bed/1.0-bath single-family listed at $80k.
Deal economics
- At list price, monthly cash flow is $525 ($6k/yr) — positive.
- The deal already cash-flows at list — no discount required.
- Meets the 1% rule at list price ($1k rent vs $80k).
- Recommended offer: $70k (12.0% below list) — sets the bar for market timing.
- Cap rate 14.2% vs local median 8.0% in Buffalo — top-decile yield for the area; either an underpriced asset or a hidden risk that comps aren't pricing in. Stress-test before assuming the spread holds.
Location & tenants
- Location reads 77/100 on livability (#195 in NY, #3,011 nationally) — a middle-class / working-renter tenant base. Strengths: commute A+, housing A+, health & safety A+; Watch: crime F, employment D-.
- Buffalo City School District (urban): math 41% / reading 40% proficiency, ranked #535 of 590 in NY (top 91%) — families likely to look elsewhere, expect single-tenant / working-renter base with shorter leases; 75% free/reduced lunch — lower-income household profile, screen leases tightly.
- Zoned schools: International School (math 8% / reading 17%, grade F, #2,048 of 2,108 statewide, top 97%, 981 students, 92% FRL); Hutchinson Central Technical High School (math 96% / reading 32%, grade B-, #807 of 1,100 statewide, top 73%, 1,175 students, 78% FRL).
- Market conditions: Rents rising fast (+8.2%/yr); 199 active listings in the ZIP; 31 comparable units currently listed for rent nearby; rentals at typical pace (median 25d on market — plan ~3-4 weeks tenant-placement turnaround); lower-income renter base — watch delinquency; 1,244 units permitted in Erie County in 2024 (563 in 5+ unit buildings).
- This rent runs 38% of the median local income ($40k/yr) — at the standard rent-burdened threshold; future hikes will face affordability resistance.
Forward outlook
- Local home prices are declining (-3.0%/yr); year-one equity from $553 of loan paydown is wiped out by about $2k of value loss. Plan a longer hold.
- At projected returns (-3.0% appreciation + 8.0% rent growth), your $22k cash investment doubles in ~4 years — after that, you're playing with house money.
Negotiation context
- It's been on market 125 days — a 12% lower offer ($70k) is reasonable based on typical stale-listing flexibility.
- 3 sale attempts since 16y ago; this cycle's ask has dropped $5k (6%) from the opening price — seller is motivated, your offer sets the floor, not the list.
- Current owner paid $10k; list at $80k implies a 700% gain — meaningful room to come down on a strong offer.
Risks & watch-outs
- Watch-outs: built in 1900 — expect roof / HVAC / electrical / plumbing capex.
- Climate carrying-cost: major flood risk — expect insurance premiums to compound above CPI over the hold.
Questions for the listing agent
- It's been on market 125 days. Have you received any prior offers? Is the seller open to a 12% concession, seller financing, or rate buy-down credit?
- Built in 1900 — when were the roof, HVAC, electrical panel, plumbing, and water heater last replaced?
- Why hasn't it sold? Are there any deal-killer items the seller is aware of (foundation, flood, title, zoning, code violations)?
- Is there a deadline driving the sale (1031 exchange, divorce, estate, relocation)? That informs how much negotiation room exists.
- Crime grade is F in this area — have there been break-ins, vandalism, or insurance claims at this property in the last 3 years? What carrier currently insures it and at what premium?
- What's the average days-on-market for RENTAL listings here right now (not sales)? A rising rental-DOM trend means longer vacancies and softer asking-rent achievability than the comps imply.
- What's the recent tenant-quality profile in this submarket — average credit score on applications, eviction rate, late-payment / NSF rate, and stable-employment percentage? A property-management company in the area should have these aggregated.
- How much new for-sale + rental construction is in the pipeline within 1–3 miles? Heavy new supply typically softens prices + rents 12–24 months out; constrained supply supports both.
Investment metrics
- 1% rule
- 1.58% ✓
- Cap rate
- 14.17%
- Cash-on-cash
- 28.12%
- DSCR
- 2.25
- GRM
- 5.3
CMA / ARV
- ARV (on-the-fly)
- $148,230
- Comps found
- 12
Show comp detail 12 sales within ~0.75 mi
| Address | Dist | Beds/Ba | Sqft | Sold | Price | $/sf | Match |
|---|---|---|---|---|---|---|---|
| 94 Farmer St | 0.27mi | 3/1.0 (+1) | 1,100 (+0%) | 6mo | $35,000 | $32 | 77 |
| 195 Hertel Ave | 0.07mi | 3/1.0 (+1) | 1,236 (+13%) | 2mo | $110,000 | $89 | 70 |
| 133 Mayer Ave | 0.37mi | 3/1.0 (+1) | 1,134 (+3%) | 6mo | $195,000 | $172 | 67 |
| 298 Dearborn St | 0.50mi | 2/1.0 | 1,053 (-4%) | 6mo | $50,000 | $47 | 65 |
| 56 Gallatin Ave | 0.42mi | 3/1.5 (+1) | 1,052 (-4%) | 2mo | $178,000 | $169 | 65 |
| 42 Progressive Ave | 0.32mi | 3/1.0 (+1) | 1,019 (-7%) | 6mo | $68,000 | $67 | 63 |
| 149 Howell St | 0.64mi | 3/2.0 (+1) | 1,097 (-0%) | 7mo | $155,000 | $141 | 55 |
| 63 Briggs Ave | 0.56mi | 3/1.0 (+1) | 974 (-11%) | 1mo | $180,000 | $185 | 50 |
| 88 Progressive Ave | 0.34mi | 3/2.0 (+1) | 1,257 (+14%) | 6mo | $170,000 | $135 | 46 |
| 144 Dearborn St | 0.74mi | 3/1.0 (+1) | 1,209 (+10%) | 3mo | $161,000 | $133 | 41 |
| 82 Bush St | 0.74mi | 3/1.5 (+1) | 1,024 (-7%) | 8mo | $70,000 | $68 | 41 |
| 268 Riverside Ave | 0.57mi | 3/1.0 (+1) | 936 (-15%) | 5mo | $150,000 | $160 | 39 |
Match score weights: distance 35% · size 25% · config 20% · recency 20%. Top-matched comps best support the ARV.
Projected returns pro-forma
-3.0% appreciation · 8.0% rent growth · sell at horizon
- IRR
- 27.5%
- Equity multiple
- 2.21×
- Total profit
- $27,133
- Equity at exit
- $11,928
- IRR
- 37.7%
- Equity multiple
- 5.33×
- Total profit
- $97,035
- Equity at exit
- $6,917
Cash invested: $22,400 (down + closing). Projections, not guarantees.
Landlord ↔ Tenant lean methodology
- Overall (STATE)
- 15 Strongly Tenant-Friendly
- State New York
- 15 Strongly Tenant-Friendly · D+10
- County
- — inherits STATE
- City
- — inherits STATE
ZIP-level market 14207
- Home prices YoY
- -18.9%
- Rents YoY
- 8.2%
- Active inventory
- 199
- Price-to-rent
- 5.3×
Monthly cashflow live
- Estimated rent
- $1,267 high interval (Pro) →
- Mortgage (P&I)
- −$420
- Tax from tax record
- −$23 /mo · $280/yr
- Insurance
- −$33
- HOA
- −$0
- Vacancy / Maint / Mgmt
- −$266
- Net cashflow
- $525
Break-even live
Sensitivity live
| Price | -10% $570 | -5% $547 | +0% $525 | +5% $502 | +10% $480 |
|---|---|---|---|---|---|
| Rent | -10% $425 | -5% $475 | +0% $525 | +5% $575 | +10% $625 |
| Rate | -1.0pp $565 | -0.5pp $545 | base $525 | +0.5pp $504 | +1.0pp $483 |
UW: 25.0% down · 7.5% · 30yr · 1.5% tax · 5.0% vac · 8.0% maint · 8.0% mgmt
Financing live
Cash to close
- Down payment
- $20,000
- Closing costs
- $2,400
- Reserves months
- —
- Total cash needed
- —
Loan-product check · same deal, 3 products live
Conventional
25% down · 7.5% · 30yr
- Down + closing
- —
- Monthly P&I
- —
- Monthly cashflow
- —
- DSCR
- —
- Eligible?
- —
Personal DTI + credit; lowest rate.
DSCR
20% down · 8.5% · 30yr
- Down + closing
- —
- Monthly P&I
- —
- Monthly cashflow
- —
- DSCR
- —
- Eligible?
- —
No personal income docs; deal must DSCR.
Hard money
10% down · 12.0% · 12mo
- Down + closing
- —
- Monthly P&I
- —
- Monthly cashflow
- —
- DSCR
- —
- Eligible?
- —
Short-term bridge; refi at stabilization.
Rent comps 31 comps
| Address | Beds | Baths | Sqft | Rent | $/sqft | DOM | Units | Dist |
|---|---|---|---|---|---|---|---|---|
| 215 Thompson St Buffalo, NY | 1.0 | 1.0 | 700 | $800 | $1.14 | 5d | 1 | 0.28mi |
| 336 East St Buffalo, NY | 1.0 | 1.0 | 795 | $1,000 | $1.26 | 16d | 1 | 0.31mi |
| 118 Rano St Buffalo, NY | 3.0 | 1.0 | 1050 | $1,200 | $1.14 | 22d | 1 | 0.31mi |
| 356 Hertel Ave Buffalo, NY | 2.0 | 1.5 | 800 | $2,300 | $2.88 | 4d | 1 | 0.32mi |
| 2099 Niagara St Unit A Buffalo, NY | 2.0 | 1.0 | 1000 | $1,197 | $1.20 | 45d | 1 | 0.33mi |
| 15 Ontario St Unit 1 Buffalo, NY | 3.0 | 1.0 | 1000 | $1,500 | $1.50 | 3d | 1 | 0.38mi |
| 155 Germain St Apt 1 Buffalo, NY | 2.0 | 1.0 | 1000 | $1,000 | $1.00 | 12d | 1 | 0.54mi |
| 68 Laforce Pl Unit U Buffalo, NY | 2.0 | 1.0 | 900 | $1,099 | $1.22 | 45d | 1 | 0.60mi |
| 239 Crowley Ave Buffalo, NY | 2.0 | 1.0 | 966 | $1,025 | $1.06 | 5d | 1 | 0.65mi |
| 62 Germain St Buffalo, NY | 3.0 | 1.0 | 1320 | $1,250 | $0.95 | 25d | 1 | 0.66mi |
| 68 Peter St Buffalo, NY | 2.0 | 1.0 | 900 | $900 | $1.00 | 25d | 1 | 0.68mi |
| 72 Reservation St Unit 2 Buffalo, NY | 3.0 | 1.0 | 950 | $1,150 | $1.21 | 25d | 1 | 0.72mi |
| 37 Holmes St Buffalo, NY | 1.0 | 1.0 | 900 | $1,095 | $1.22 | 16d | 1 | 0.76mi |
| 15 Beatrice Ave Buffalo, NY | 2.0 | 1.0 | 950 | $1,150 | $1.21 | 16d | 1 | 0.90mi |
| 134 Philadelphia St Buffalo, NY | 3.0 | 1.0 | 871 | $1,100 | $1.26 | 4d | 1 | 0.93mi |
| 293 Grote St Buffalo, NY | 1.0–2.0 | 1.0–2.0 | 817 | $2,345 | $2.87 | 3d | 1 | 1.01mi |
| 100 Forest Ave Buffalo, NY | 2.0–4.0 | 2.0–4.0 | 1304 | $640 | $0.49 | 3d | 14 | 1.10mi |
| 1558 Elmwood Ave Unit 4 Buffalo, NY | 2.0 | 1.0 | 800 | $1,100 | $1.38 | 45d | 1 | 1.12mi |
| 46 Hawley St #1 Buffalo, NY | 2.0 | 1.0 | 900 | $1,300 | $1.44 | 45d | 1 | 1.13mi |
| 139 Fordham Dr Buffalo, NY | 3.0 | 1.0 | 1453 | $1,700 | $1.17 | 25d | 1 | 1.18mi |
| 480 W Hazeltine Ave Buffalo, NY | 3.0 | 1.0 | 989 | $1,900 | $1.92 | 25d | 1 | 1.21mi |
| 1485 Niagara St Buffalo, NY | 1.0–2.0 | 1.0 | 925 | $2,174 | $2.35 | 3d | 1 | 1.33mi |
| 2075 Kenmore Ave Unit 611 Buffalo, NY | 2.0 | 2.0 | 981 | $1,950 | $1.99 | 3d | 1 | 1.33mi |
| 57 Abbottsford Pl Buffalo, NY | 2.0 | 1.0 | 1000 | $1,550 | $1.55 | 25d | 1 | 1.41mi |
| 305 Bird Ave Unit 3 Buffalo, NY | 3.0 | 1.5 | 1128 | $2,300 | $2.04 | 45d | 1 | 1.41mi |
| 309 Bird Ave Unit 1 Buffalo, NY | 3.0 | 1.0 | 1100 | $2,200 | $2.00 | 45d | 1 | 1.41mi |
| 185 Potomac Ave Buffalo, NY | 2.0 | 1.0 | 1200 | $1,300 | $1.08 | 25d | 1 | 1.44mi |
| 37 Abbottsford Pl Buffalo, NY | 3.0 | 1.0 | 1130 | $1,650 | $1.46 | 45d | 1 | 1.44mi |
| 232 Dewitt St Buffalo, NY | 3.0 | 1.0 | 1200 | $1,300 | $1.08 | 25d | 1 | 1.45mi |
| 374 Baynes St Buffalo, NY | 3.0 | 1.0 | 1126 | $1,550 | $1.38 | 45d | 1 | 1.47mi |
| 891 Richmond Ave Buffalo, NY | 3.0 | 1.0 | 1176 | $1,800 | $1.53 | 45d | 1 | 1.50mi |
Listing history 7 events
-
2025-12-30status Pending
-
2025-10-28price $80,000
-
2025-08-27$85,000 Active
-
2025-06-11historical
-
2024-12-11$79,900 Active
-
2010-11-05soldstatus $10,000 192-char remark
Show marketing remark (192 chars)
Priced to sell!!! This single family home sits on a good size lot on a quiet dead end street. Great opportunity for owner occupy or investment with a little elbow grease. Newer heating system.
-
2010-08-18$12,900 192-char remark
Show marketing remark (192 chars)
Priced to sell!!! This single family home sits on a good size lot on a quiet dead end street. Great opportunity for owner occupy or investment with a little elbow grease. Newer heating system.
ⓘ Source: listings_history table (triggers on properties + properties_extension) + one-shot
backfill from property_details.listing_events for pre-trigger history.
Tax reassessment forecast NY · Partial reset (capped growth)
- Current annual tax
- $280 · $23/mo
- Projected year-2 tax
- $816 · $68/mo
- Expected delta
- +$536/yr (+$45/mo · 191.2%)
ⓘ Screening estimate from a state-policy table — verify with the county assessor before closing.
Climate risk First Street
- Flood 6/10 Major FEMA zone X (unshaded) · 73% chance over 30 yrs
- Wildfire 1/10 Low
- Heat 3/10 Moderate 7 d/yr ≥93°F today · 15 d/yr by 30 yrs out
- Wind 1/10 Low
- Air quality 4/10 Moderate 4 unhealthy d/yr today · 9 by 30 yrs out
Nearby sold comps map
Loading sold comps map…
Walkable amenities ~0.75 mi
Loading nearby amenities…
Taxation est. · year 1
- Rental income
- $15,206
- − Mortgage interest
- −$4,481
- − Property taxes
- −$280
- − Insurance
- −$400
- − Repairs & maintenance
- −$1,216
- − Management
- −$1,216
- − Depreciation
- −$2,327
- Taxable income
- $5,284
- Est. tax owed @ 24.0%
- −$1,268
- After-tax cash flow
- $5,030/yr
For passive investors: Depreciation is non-cash, so a rental often shows a tax loss while cash-flowing — sheltering income. Rental losses are passive: they offset passive income freely, and up to $25,000/yr can offset ordinary (W-2) income if you actively participate and your MAGI is under $100k (phasing out to $0 by $150k); unused losses carry forward. On sale, claimed depreciation is recaptured at up to 25%, and gains may owe capital-gains tax (a 1031 exchange can defer both). Figures are a year-1 estimate at your 24.0% rate — not tax advice; consult a CPA.
Schools (NCES district)
- District
- Buffalo City School District
- NCES district ID
- 3605850
- Math proficiency
- 41% ▲ 11.00%
- Reading proficiency
- 40% ▲ 7.00%
- Median HH income
- $31,665
- Composite
- 33.17/100
- National rank
- #5544
- State rank
- #535 of 590 in NY
Livability — Buffalo
- Score
- 77/100
- State rank
- #195
- US rank
- #3011
Category grades
Schools grade is shown separately in the Schools card above.
Census & demographics
- Census place
- Buffalo, NY
- County
- Erie County · 714,559 people
- City population
- 440,021
- Metro
- Buffalo-Cheektowaga, NY
- Population (ZIP)
- 26,327
- Household income
- $39,753
- Rent vs Own
- Severe rent burden
- 2177.0
Population outlook (Erie County) Hauer SSP2
- Today (2025)
- 933,037 people
- By 2030
- 935,181 · +0.2%
- By 2040
- 928,531 · -0.5%
- By 2050
- 905,725 · -2.9%
- By 2075
- 834,037 · -10.6%
- By 2100
- 708,033 · -24.1%
Race, ethnicity, and origin ACS 2023
- Neighborhood character
- Highly diverse neighborhood (Simpson 0.74)
- Race & ethnicity
- White 40% Hispanic / Latino 23% Black 16% Asian 15% Two or more races 14%
- Hispanic origin (detail)
- Puerto Rican 18% Dominican 2%
- Common ancestry
- Romanian 8% Portuguese 1% Arab 1%
- Foreign-born
- 19% · Philippines, Canada, India
- Languages at home
- 65% English-only · Spanish 14% Other Asian/Pacific 10% Other Indo-European 5%
Political lean MEDSL · Erie
- 2024 margin
- Lean D (+9.7) · D 54.8% · R 45.2%
- 2008→2024 swing
- -7.9pp toward R · 2008: 17.5pp · 2024: 9.7pp
- All cycles
- 2024: D+9.7 2020: D+14.7 2016: D+4.8 2012: D+15.6 2008: D+17.5
Not yet ingested
- Civics
- —
Market trends
- HPI YoY
- ▼ -54.42%
- Current HPI
- 233.0902
- Rent YoY
- ▲ 8.19%
- Metro
- Buffalo-Cheektowaga, NY
- State GDP YoY
- ▲ 2.60%
- F500 in state
- 92
Industry mix (Fortune 500 HQ in NY)
| Industry | F500 HQs | Revenue |
|---|---|---|
| Financial Services | 10 | $950B |
|
||
| Consumer Goods | 9 | $162B |
|
||
| Insurance | 4 | $225B |
|
||
| Telecommunications | 2 | $144B |
|
||
| Pharmaceuticals | 2 | $112B |
|
||
| Media / Entertainment | 2 | $69B |
|
||
Price history
+520.2% since first listed7 events — show timeline
- 2025-12-30 Pending — WNYREIS
- 2025-10-28 Price Changed $80,000 WNYREIS
- 2025-08-27 Listed $85,000 WNYREIS
- 2025-06-11 Listing Removed — WNYREIS
- 2024-12-11 Listed $79,900 WNYREIS
- 2010-11-05 Sold (MLS) $10,000 WNYREIS
- 2010-08-18 Listed $12,900 WNYREIS
Property tax history
+5.7%/yrLatest (2025): $280 · +0.0% YoY. Source: county tax records.
Cash-flow waterfall
monthlySold comps — $/sqft
last 12 mo · ≤1 miLoading sold comps…