122 Sunset Dr · Winfield, WV
Flood risk No data
- FEMA flood zone
- —
- Chance of flooding over 30 yrs
- —
- Est. flood insurance / yr
- —
Fire risk No data
- Est. fire insurance / yr
- —
Heat risk No data
- Hot days now (above threshold)
- —
- Hot days in 30 yrs
- —
Wind risk No data
- Chance of severe wind over 30 yrs
- —
Air-quality risk No data
- Unhealthy air days now
- —
- Unhealthy air days in 30 yrs
- —
Risk factors via First Street. Map © Google.
Why this score? — see what drove the B- grade
The composite is a weighted blend of 9 inputs, each scored 0–100. Each bar is that input's sub-score; the figure is the points it added to the 100-point composite (weight × sub-score).
- Cash flow +30.0/30.0
- DSCR +10.0/10.0
- 1% rule +9.3/10.0
- ARV discount +7.5/15.0
- Schools +3.9/10.0
- Livability +3.6/5.0
- Rent growth +2.5/5.0
- Condition / age +2.2/5.0
- Appreciation +0.0/10.0
$82,000
🖨 Deal sheet 📄 Offer letter ✓ Due diligence
Key facts
- 0.24 acre lot
- Listed 84 days
Property features AI
Finance
- Other: Property listed by Berkshire Hathaway Home Services Professional Real
- HOA & community: Ranch Lake Estates subdivision
Exterior
- Utilities: Public water; Septic tank
- Home design: Single family residence; Two-story home
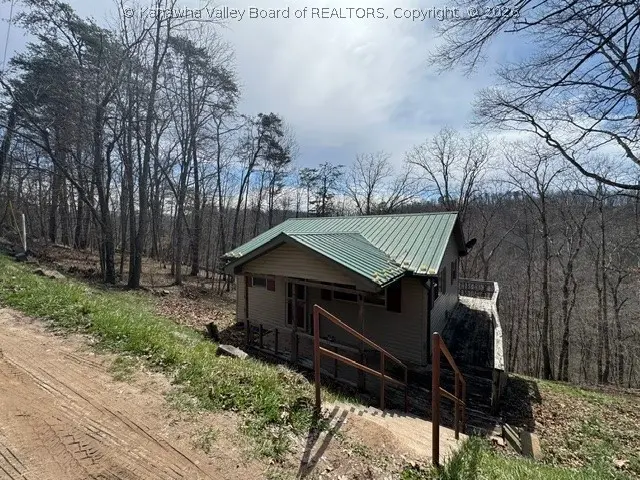
- Construction: Frame construction; Vinyl siding; Metal roof
- Exterior features: Deck; Porch; Wooded lot
Interior
- Kitchen: Electric range; Refrigerator
- Bedrooms: 6 total rooms (includes bedrooms and living spaces)
- Flooring: Carpet; Laminate; Tile
- Bathrooms: 1 full bathroom; 1 half bathroom
- Heating & cooling: Heat pump with forced air; Electric heating; Central electric air conditioning
- Interior features: Insulated windows; Full basement
Neighborhood map
What this means for you Summary
Snapshot
- This is a 2-bed/1.5-bath single-family listed at $82k. Condition is rated fair.
Deal economics
- At list price, monthly cash flow is $362 ($4k/yr) — positive.
- The deal already cash-flows at list — no discount required.
- Meets the 1% rule at list price ($1k rent vs $82k).
- Recommended offer: $77k (6.0% below list) — sets the bar for market timing.
Location & tenants
- Location reads 72/100 on livability (#54 in WV) — a middle-class / working-renter tenant base. Strengths: crime A+, cost of living A+, housing A+; Watch: amenities F, commute F, health & safety F.
- Putnam County Schools (suburban): math 40% / reading 50% proficiency, ranked #2 of 55 in WV (top 4%) — families likely to look elsewhere, expect single-tenant / working-renter base with shorter leases.
- Zoned schools: Eastbrook Elementary School (math 37% / reading 47%, grade F, #87 of 377 statewide, top 28%, 246 students, 0% FRL); Winfield Middle School (math 47% / reading 53%, grade C, #5 of 109 statewide, top 4%, 556 students, 0% FRL); Winfield High School (math 37% / reading 62%, grade D, #7 of 110 statewide, top 6%, 793 students, 0% FRL) — zoned schools average 0% FRL vs 33% district-wide (33 pts lower); this property's tenant base skews higher-income than the district average.
- Market conditions: 68 active listings in the ZIP; 111 units permitted in Putnam County in 2024 (0 in 5+ unit buildings).
Forward outlook
- Local home prices are declining (-3.0%/yr); year-one equity from $567 of loan paydown is wiped out by about $2k of value loss. Plan a longer hold.
- At projected returns (-3.0% appreciation + 3.0% rent growth), your $23k cash investment doubles in ~7 years — after that, you're playing with house money.
Negotiation context
- It's been on market 85 days — a 6% lower offer ($77k) is reasonable based on typical stale-listing flexibility.
- 4 sale attempts since 3y ago with the ask held roughly flat each time — persistent listings suggest the price (not the market) is what's stuck; bring a comps-based counter.
Questions for the listing agent
- It's been on market 85 days. Have you received any prior offers? Is the seller open to a 6% concession, seller financing, or rate buy-down credit?
- Have any recent inspections been done? Can we get a copy of the seller's disclosures and any deferred-maintenance estimates?
- Why hasn't it sold? Are there any deal-killer items the seller is aware of (foundation, flood, title, zoning, code violations)?
- Is there a deadline driving the sale (1031 exchange, divorce, estate, relocation)? That informs how much negotiation room exists.
- What's the average days-on-market for RENTAL listings here right now (not sales)? A rising rental-DOM trend means longer vacancies and softer asking-rent achievability than the comps imply.
- What's the recent tenant-quality profile in this submarket — average credit score on applications, eviction rate, late-payment / NSF rate, and stable-employment percentage? A property-management company in the area should have these aggregated.
- How much new for-sale + rental construction is in the pipeline within 1–3 miles? Heavy new supply typically softens prices + rents 12–24 months out; constrained supply supports both.
Investment metrics
- 1% rule
- 1.43% ✓
- Cap rate
- 11.59%
- Cash-on-cash
- 18.93%
- DSCR
- 1.84
- GRM
- 5.8
CMA / ARV
No comps found within radius.
Projected returns pro-forma
-3.0% appreciation · 3.0% rent growth · sell at horizon
- IRR
- 10.8%
- Equity multiple
- 1.43×
- Total profit
- $9,793
- Equity at exit
- $12,226
- IRR
- 19.8%
- Equity multiple
- 2.67×
- Total profit
- $38,297
- Equity at exit
- $7,090
Cash invested: $22,960 (down + closing). Projections, not guarantees.
Landlord ↔ Tenant lean methodology
- Overall (STATE)
- 83 Strongly Landlord-Friendly
- State West Virginia
- 83 Strongly Landlord-Friendly · R+22
- County
- — inherits STATE
- City
- — inherits STATE
ZIP-level market 25560
- Active inventory
- 68
- Price-to-rent
- 5.8×
Monthly cashflow live
- Estimated rent
- $1,176 medium interval (Pro) →
- Mortgage (P&I)
- −$430
- Tax est. 1.5%
- −$102 /mo · $1,230/yr
- Insurance
- −$34
- HOA
- −$0
- Vacancy / Maint / Mgmt
- −$247
- Net cashflow
- $362
Break-even live
UW: 25.0% down · 7.5% · 30yr · 1.5% tax · 5.0% vac · 8.0% maint · 8.0% mgmt
Financing live
Cash to close
- Down payment
- $20,500
- Closing costs
- $2,460
- Reserves months
- —
- Total cash needed
- —
Loan-product check · same deal, 3 products live
Conventional
25% down · 7.5% · 30yr
- Down + closing
- —
- Monthly P&I
- —
- Monthly cashflow
- —
- DSCR
- —
- Eligible?
- —
Personal DTI + credit; lowest rate.
DSCR
20% down · 8.5% · 30yr
- Down + closing
- —
- Monthly P&I
- —
- Monthly cashflow
- —
- DSCR
- —
- Eligible?
- —
No personal income docs; deal must DSCR.
Hard money
10% down · 12.0% · 12mo
- Down + closing
- —
- Monthly P&I
- —
- Monthly cashflow
- —
- DSCR
- —
- Eligible?
- —
Short-term bridge; refi at stabilization.
Listing history 22 events
-
2026-06-19days on market $82,000 Active 85 DOM
-
2026-06-18days on market $82,000 Active 84 DOM
-
2026-06-17days on market $82,000 Active 83 DOM
-
2026-06-16days on market $82,000 Active 82 DOM
-
2026-06-15days on market $82,000 Active 81 DOM
-
2026-06-14days on market $82,000 Active 79 DOM
-
2026-06-12days on market $82,000 Active 78 DOM
-
2026-06-09days on market $82,000 Active 75 DOM
-
2026-06-08days on market $82,000 Active 74 DOM
-
2026-06-07days on market $82,000 Active 73 DOM
-
2026-06-03days on market $82,000 Active 69 DOM
-
2026-06-02days on market $82,000 Active 68 DOM
-
2026-06-01days on market $82,000 Active 67 DOM
-
2026-05-31days on market $82,000 Active 66 DOM
-
2026-05-30days on market $82,000 Active 65 DOM
-
2026-03-24$82,000 Active
-
2024-06-19historical $950
-
2024-05-24$950
-
2024-05-16historical $950
-
2024-04-23$950
-
2023-11-11historical
-
2023-10-25
ⓘ Source: listings_history table (triggers on properties + properties_extension) + one-shot
backfill from property_details.listing_events for pre-trigger history.
Nearby sold comps map
Loading sold comps map…
Walkable amenities ~0.75 mi
Loading nearby amenities…
Taxation est. · year 1
- Rental income
- $14,108
- − Mortgage interest
- −$4,593
- − Property taxes
- −$1,230
- − Insurance
- −$410
- − Repairs & maintenance
- −$1,129
- − Management
- −$1,129
- − Depreciation
- −$2,385
- Taxable income
- $3,232
- Est. tax owed @ 24.0%
- −$776
- After-tax cash flow
- $3,570/yr
For passive investors: Depreciation is non-cash, so a rental often shows a tax loss while cash-flowing — sheltering income. Rental losses are passive: they offset passive income freely, and up to $25,000/yr can offset ordinary (W-2) income if you actively participate and your MAGI is under $100k (phasing out to $0 by $150k); unused losses carry forward. On sale, claimed depreciation is recaptured at up to 25%, and gains may owe capital-gains tax (a 1031 exchange can defer both). Figures are a year-1 estimate at your 24.0% rate — not tax advice; consult a CPA.
Condition & rehab AI · 7 photos
This property requires significant repairs and maintenance to improve its condition and value. The exterior, roof, and HVAC system are in poor condition and need immediate attention.
Repairs flagged
- Major siding — Severe weathering and peeling
- Major roof — Missing shingles and visible damage
- Major deck — Worn and uneven
- Major HVAC unit — Rusty and old
Value-add opportunities
- Both paint exterior walls — Enhances curb appeal and value
- Both repair roof — Prevents further damage and improves value
- Both replace HVAC unit — Improves comfort and energy efficiency
Renovation cost estimate screening
| Repair item | Severity | Est. cost |
|---|---|---|
| siding · Severe weathering and peeling | Major | $15,000–50,000 |
| roof · Missing shingles and visible damage | Major | $15,000–50,000 |
| deck · Worn and uneven | Major | $15,000–50,000 |
| HVAC unit · Rusty and old | Major | $15,000–50,000 |
| Total estimated repair cost · 4 items | $60,000–200,000 |
Value-add ROI direction
- Both paint exterior walls — Enhances curb appeal and value ↑
- Both repair roof — Prevents further damage and improves value ↑
- Both replace HVAC unit — Improves comfort and energy efficiency ↑
ⓘ Cost ranges are severity-bucket heuristics (US national rule-of-thumb). Get contractor quotes + a written scope before underwriting a rehab budget.
Schools (NCES district)
- District
- Putnam County Schools
- NCES district ID
- 5401200
- Math proficiency
- 40% ▼ -13.00%
- Reading proficiency
- 50% ▼ -6.00%
- Median HH income
- $54,783
- Composite
- 39.06/100
- National rank
- #4060
- State rank
- #2 of 55 in WV
Livability — Winfield
- Score
- 72/100
- State rank
- #54
- US rank
- #6514
Category grades
Schools grade is shown separately in the Schools card above.
Census & demographics
- Population (ZIP)
- 8,292
Population outlook (Putnam County) Hauer SSP2
- Today (2025)
- 58,915 people
- By 2030
- 59,400 · +0.8%
- By 2040
- 59,444 · +0.9%
- By 2050
- 58,510 · -0.7%
- By 2075
- 54,603 · -7.3%
- By 2100
- 46,202 · -21.6%
Race, ethnicity, and origin ACS 2023
- Neighborhood character
- Predominantly White (91%)
- Race & ethnicity
- White 91% Two or more races 5% Hispanic / Latino 3% Black 1% Asian 1%
- Common ancestry
- Serbian 3% Slovak 2% Italian 2%
- Foreign-born
- 1%
Political lean MEDSL · Putnam
- 2024 margin
- Solid R (+46.3) · D 25.9% · R 72.2% · Other 1.9%
- 2008→2024 swing
- -22.8pp toward R · 2008: -23.5pp · 2024: -46.3pp
- All cycles
- 2024: R+46.3 2020: R+42.6 2016: R+47.8 2012: R+37.1 2008: R+23.5
Not yet ingested
- Civics
- —
Market trends
- HPI YoY
- ▼ -89.48%
- Current HPI
- 163.837
- Rent YoY
- —
- Metro
- —
- State GDP YoY
- —
- F500 in state
- 0
Price history
7 events — show timeline
- 2026-03-24 Listed $82,000 KVBOR
- 2024-06-19 Rental Removed $950 APPFOLIO
- 2024-05-24 Listed for Rent $950 APPFOLIO
- 2024-05-16 Rental Removed $950 APPFOLIO
- 2024-04-23 Listed for Rent $950 APPFOLIO
- 2023-11-11 Rental Removed — APPFOLIO
- 2023-10-25 Listed for Rent — APPFOLIO
Cash-flow waterfall
monthlySold comps — $/sqft
last 12 mo · ≤1 miLoading sold comps…