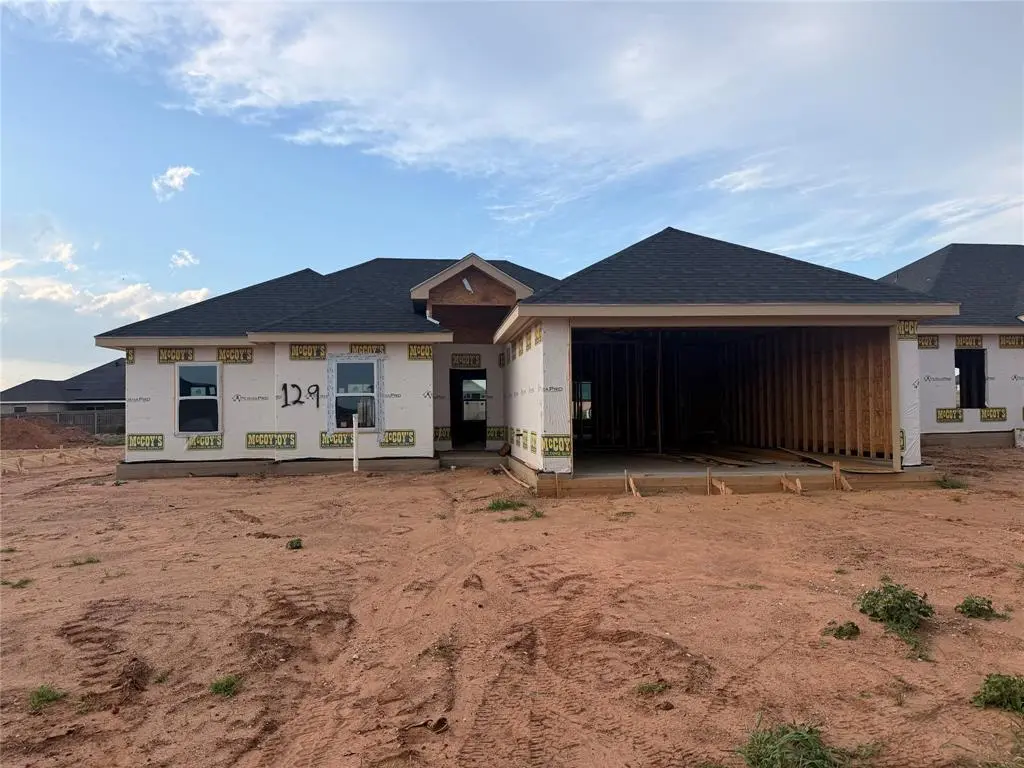
129 Copper · Abilene, TX
Flood risk No data
- FEMA flood zone
- —
- Chance of flooding over 30 yrs
- —
- Est. flood insurance / yr
- —
Fire risk No data
- Est. fire insurance / yr
- —
Heat risk No data
- Hot days now (above threshold)
- —
- Hot days in 30 yrs
- —
Wind risk No data
- Chance of severe wind over 30 yrs
- —
Air-quality risk No data
- Unhealthy air days now
- —
- Unhealthy air days in 30 yrs
- —
Risk factors via First Street. Map © Google.
Why this score? — see what drove the C- grade
The composite is a weighted blend of 9 inputs, each scored 0–100. Each bar is that input's sub-score; the figure is the points it added to the 100-point composite (weight × sub-score).
- Cash flow +17.2/30.0
- ARV discount +6.0/15.0
- Schools +5.6/10.0
- DSCR +5.4/10.0
- Rent growth +5.0/5.0
- Condition / age +5.0/5.0
- 1% rule +4.7/10.0
- Livability +3.8/5.0
- Appreciation +0.0/10.0
$325,000
🖨 Deal sheet 📄 Offer letter ✓ Due diligence
Listing remarks
Welcome to this stunning new construction home in Carriage Hills, located in the highly sought-after Wylie ISD. This thoughtfully designed 4-bedroom, 2-bathroom home offers 1,598 square feet of modern living space with an open-concept layout perfect for everyday living and entertaining. Step inside to find luxury vinyl plank flooring, a spacious living area with ceiling fan, and a bright kitchen featuring granite countertops, a large island, stainless appliances, and ample cabinet space. The open floor plan flows seamlessly into the dining and living areas, creating a warm and inviting atmosphere. he private primary suite includes a walk-in closet, dual sinks, and a separate shower, providi
Key facts
- Bright kitchen
- Large island
- Granite countertops
Tags
Neighborhood map
What this means for you Summary
Snapshot
- This is a 4-bed/2.0-bath single-family listed at $325k. Condition is rated excellent.
Deal economics
- At list price, monthly cash flow is $231 ($3k/yr) — positive.
- The deal already cash-flows at list — no discount required.
- To meet the 1% rule (rent ≥ 1% of price), the offer needs to be $316k (2.7% below list).
- Recommended offer: $316k (2.7% below list) — sets the bar for 1% rule.
Location & tenants
- Location reads 75/100 on livability (#142 in TX, #4,037 nationally) — a middle-class / working-renter tenant base. Strengths: cost of living A+, housing A+, health & safety A+; Watch: crime D, commute F.
- Wylie ISD (rural): math 63% / reading 62% proficiency, ranked #32 of 826 in TX (top 4%) — acceptable for families but not a draw, mixed tenant base, ~2y average lease; only 17% free/reduced lunch — higher-income household profile.
- Zoned schools: Wylie East El (math 58% / reading 58%, grade C+, #480 of 4,322 statewide, top 11%, 789 students, 30% FRL).
- Market conditions: Rents rising fast (+33.5%/yr); 370 active listings in the ZIP; 23 comparable units currently listed for rent nearby; rentals leasing fast (median 12d on market — plan ~1-2 weeks tenant-placement turnaround); solid renter incomes; 508 units permitted in Taylor County in 2024 (0 in 5+ unit buildings).
- This rent runs 42% of the median local income ($90k/yr) — at the standard rent-burdened threshold; future hikes will face affordability resistance.
Forward outlook
- Local home prices are declining (-3.0%/yr); year-one equity from $2k of loan paydown is wiped out by about $10k of value loss. Plan a longer hold.
- Taylor County population projected at +16% by 2050 — long-run rental-demand tailwind backs the buy-and-hold thesis.
- At projected returns (-3.0% appreciation + 8.0% rent growth), your $91k cash investment doubles in ~10 years — after that, you're playing with house money.
Negotiation context
- Only 5 days on market — expect competitive offers; lowballing is unlikely to land.
Questions for the listing agent
- What does the HOA fee cover, when was the last increase, and are there any pending special assessments or reserve-fund shortfalls?
- Is there a deadline driving the sale (1031 exchange, divorce, estate, relocation)? That informs how much negotiation room exists.
- Schools are D-rated, which usually means shorter tenancies and higher turnover. Who's the typical renter profile here, and what's been the actual vacancy rate?
- Crime grade is D in this area — have there been break-ins, vandalism, or insurance claims at this property in the last 3 years? What carrier currently insures it and at what premium?
- What's the average days-on-market for RENTAL listings here right now (not sales)? A rising rental-DOM trend means longer vacancies and softer asking-rent achievability than the comps imply.
- What's the recent tenant-quality profile in this submarket — average credit score on applications, eviction rate, late-payment / NSF rate, and stable-employment percentage? A property-management company in the area should have these aggregated.
- How much new for-sale + rental construction is in the pipeline within 1–3 miles? Heavy new supply typically softens prices + rents 12–24 months out; constrained supply supports both.
Investment metrics
- 1% rule
- 0.97% ✗
- Cap rate
- 7.15%
- Cash-on-cash
- 3.05%
- DSCR
- 1.14
- GRM
- 8.6
CMA / ARV
- ARV (on-the-fly)
- $314,806
- Comps found
- 12
Show comp detail 12 sales within ~0.75 mi
| Address | Dist | Beds/Ba | Sqft | Sold | Price | $/sf | Match |
|---|---|---|---|---|---|---|---|
| 7654 Hudson Way | 0.05mi | 4/2.0 | 1,577 (-1%) | 1mo | $335,000 | $212 | 95 |
| 7584 Wildflower | 0.14mi | 3/2.0 (-1) | 1,522 (-5%) | 0mo | $304,900 | $200 | 80 |
| 7685 Lake Ridge Pkwy | 0.20mi | 3/2.0 (-1) | 1,650 (+3%) | 0mo | $325,000 | $197 | 80 |
| 7580 Wildflower | 0.15mi | 3/2.0 (-1) | 1,522 (-5%) | 0mo | $304,900 | $200 | 80 |
| 7689 Lake Ridge Pkwy | 0.20mi | 3/2.0 (-1) | 1,650 (+3%) | 1mo | $325,000 | $197 | 80 |
| 7693 Lake Ridge Pkwy | 0.21mi | 3/2.0 (-1) | 1,650 (+3%) | 0mo | $325,000 | $197 | 79 |
| 132 Lake Ridge Ct | 0.26mi | 3/2.0 (-1) | 1,662 (+4%) | 1mo | $350,000 | $211 | 76 |
| 7633 Wildflower Way | 0.19mi | 4/2.0 | 1,764 (+10%) | 1mo | $348,000 | $197 | 73 |
| 250 Martis Way | 0.55mi | 4/2.0 | 1,650 (+3%) | 1mo | $325,000 | $197 | 68 |
| 149 Spring Park Way | 0.33mi | 3/2.0 (-1) | 1,714 (+7%) | 1mo | $289,000 | $169 | 67 |
| 331 Sophia Ln | 0.58mi | 3/2.0 (-1) | 1,632 (+2%) | 0mo | $329,000 | $202 | 64 |
| 7321 Wildflower Way | 0.61mi | 4/2.0 | 1,737 (+9%) | 1mo | $335,000 | $193 | 56 |
Match score weights: distance 35% · size 25% · config 20% · recency 20%. Top-matched comps best support the ARV.
Projected returns pro-forma
-3.0% appreciation · 8.0% rent growth · sell at horizon
- IRR
- -6.0%
- Equity multiple
- 0.77×
- Total profit
- $-21,159
- Equity at exit
- $48,459
- IRR
- 9.0%
- Equity multiple
- 1.84×
- Total profit
- $76,857
- Equity at exit
- $28,100
Cash invested: $91,000 (down + closing). Projections, not guarantees.
Landlord ↔ Tenant lean methodology
- Overall (STATE)
- 87 Strongly Landlord-Friendly
- State Texas
- 87 Strongly Landlord-Friendly · R+5
- County
- — inherits STATE
- City
- — inherits STATE
ZIP-level market 79602
- Home prices YoY
- -19.6%
- Rents YoY
- 33.5%
- Active inventory
- 370
- Price-to-rent
- 8.6×
Monthly cashflow live
- Estimated rent
- $3,162 high interval (Pro) →
- Mortgage (P&I)
- −$1,704
- Tax est. 1.5%
- −$406 /mo · $4,875/yr
- Insurance
- −$135
- HOA
- −$21
- Vacancy / Maint / Mgmt
- −$664
- Net cashflow
- $231
Break-even live
UW: 25.0% down · 7.5% · 30yr · 1.5% tax · 5.0% vac · 8.0% maint · 8.0% mgmt
Financing live
Cash to close
- Down payment
- $81,250
- Closing costs
- $9,750
- Reserves months
- —
- Total cash needed
- —
Loan-product check · same deal, 3 products live
Conventional
25% down · 7.5% · 30yr
- Down + closing
- —
- Monthly P&I
- —
- Monthly cashflow
- —
- DSCR
- —
- Eligible?
- —
Personal DTI + credit; lowest rate.
DSCR
20% down · 8.5% · 30yr
- Down + closing
- —
- Monthly P&I
- —
- Monthly cashflow
- —
- DSCR
- —
- Eligible?
- —
No personal income docs; deal must DSCR.
Hard money
10% down · 12.0% · 12mo
- Down + closing
- —
- Monthly P&I
- —
- Monthly cashflow
- —
- DSCR
- —
- Eligible?
- —
Short-term bridge; refi at stabilization.
Rent comps 23 comps
| Address | Beds | Baths | Sqft | Rent | $/sqft | DOM | Units | Dist |
|---|---|---|---|---|---|---|---|---|
| 7650 Hudson Way Abilene, TX | 4.0 | 2.0 | 1577 | $3,295 | $2.09 | 13d | 1 | 0.02mi |
| 7646 Hudson Way Abilene, TX | 4.0 | 2.0 | 1577 | $3,295 | $2.09 | 20d | 1 | 0.03mi |
| 7627 Hudson Way Abilene, TX | 4.0 | 2.0 | 1598 | $8,900 | $5.57 | 13d | 1 | 0.04mi |
| 7625 Wildflower Way Abilene, TX | 4.0 | 3.0 | 1800 | $3,300 | $1.83 | 4d | 1 | 0.07mi |
| 7717 Sawdust Trl Abilene, TX | 3.0 | 2.0 | 1502 | $3,375 | $2.25 | 11d | 1 | 0.10mi |
| 7709 Sawdust Trl Abilene, TX | 3.0 | 2.0 | 1502 | $3,200 | $2.13 | 43d | 1 | 0.10mi |
| 7949 Sawdust Trl Abilene, TX | 3.0 | 2.0 | 1508 | $2,995 | $1.99 | 43d | 1 | 0.12mi |
| 385 Kristie Path Abilene, TX | 3.0 | 2.0 | 1449 | $2,700 | $1.86 | 3d | 1 | 0.12mi |
| 8001 Sawdust Trl Abilene, TX | 3.0 | 2.0 | 1508 | $2,995 | $1.99 | 43d | 1 | 0.15mi |
| 8009 Sawdust Trl Abilene, TX | 3.0 | 2.0 | 1508 | $2,995 | $1.99 | 43d | 1 | 0.16mi |
| 385 Kristi Path Abilene, TX | 3.0 | 2.0 | 1449 | $2,700 | $1.86 | 3d | 1 | 0.17mi |
| 409 Kristie Path Abilene, TX | 3.0 | 2.0 | 1409 | $2,895 | $2.05 | 5d | 1 | 0.18mi |
| 405 Kristie Path Abilene, TX | 3.0 | 2.0 | 1439 | $2,895 | $2.01 | 7d | 1 | 0.18mi |
| 273 Martis Way Abilene, TX | 4.0 | 2.0 | 1660 | $3,200 | $1.93 | 13d | 1 | 0.55mi |
| 331 Sophia Ln Abilene, TX | 3.0 | 2.0 | 1632 | $3,195 | $1.96 | 4d | 1 | 0.61mi |
| 7328 Mountain View Rd Abilene, TX | 3.0 | 2.0 | 1481 | $2,995 | $2.02 | 11d | 1 | 0.66mi |
| 7326 Mountain View Rd Unit 7328 Abilene, TX | 3.0 | 2.0 | 1481 | $2,995 | $2.02 | 11d | 1 | 0.67mi |
| 7319 Mountain View Rd Abilene, TX | 3.0 | 2.0 | 1502 | $4,000 | $2.66 | 43d | 1 | 0.68mi |
| 7309 Wildflower Way Abilene, TX | 3.0 | 2.0 | 1578 | $3,195 | $2.02 | 24d | 1 | 0.68mi |
| 250 Southlake Dr Abilene, TX | 4.0 | 2.0 | 2006 | $3,400 | $1.69 | 3d | 1 | 0.92mi |
| 349 Whiterock Dr Abilene, TX | 4.0 | 2.0 | 1809 | $6,000 | $3.32 | 17d | 1 | 0.94mi |
| 350 Miss Ellie Ln Abilene, TX | 3.0 | 2.0 | 1414 | $2,600 | $1.84 | 7d | 1 | 1.25mi |
| 350 Miss Ellie Ln Abilene, TX | 3.0 | 2.0 | 1414 | $2,600 | $1.84 | 3d | 1 | 1.25mi |
HOA detail
- Monthly dues
- $21 · $252/yr
Listing history 2 events
-
2026-04-20status Pending
-
2026-04-15$325,000 Active
ⓘ Source: listings_history table (triggers on properties + properties_extension) + one-shot
backfill from property_details.listing_events for pre-trigger history.
Nearby sold comps map
Loading sold comps map…
Walkable amenities ~0.75 mi
Loading nearby amenities…
Taxation est. · year 1
- Rental income
- $37,949
- − Mortgage interest
- −$18,205
- − Property taxes
- −$4,875
- − Insurance
- −$1,625
- − Repairs & maintenance
- −$3,036
- − Management
- −$3,036
- − HOA
- −$252
- − Depreciation
- −$9,455
- Taxable loss
- −$2,535
- Est. tax savings @ 24.0%
- +$608
- After-tax cash flow
- $3,384/yr
For passive investors: Depreciation is non-cash, so a rental often shows a tax loss while cash-flowing — sheltering income. Rental losses are passive: they offset passive income freely, and up to $25,000/yr can offset ordinary (W-2) income if you actively participate and your MAGI is under $100k (phasing out to $0 by $150k); unused losses carry forward. On sale, claimed depreciation is recaptured at up to 25%, and gains may owe capital-gains tax (a 1031 exchange can defer both). Figures are a year-1 estimate at your 24.0% rate — not tax advice; consult a CPA.
Condition & rehab AI · 4 photos
This new construction home in Carriage Hills is move-in ready with excellent condition and modern finishes.
Value-add opportunities
- Both Landscaping and curb appeal — Enhances curb appeal and adds value
- Both Interior finishing touches — Improves aesthetics and functionality
- Both Appliance upgrades — Enhances functionality and appeal
Renovation cost estimate screening
Value-add ROI direction
- Both Landscaping and curb appeal — Enhances curb appeal and adds value ↑
- Both Interior finishing touches — Improves aesthetics and functionality ↑
- Both Appliance upgrades — Enhances functionality and appeal ↑
ⓘ Cost ranges are severity-bucket heuristics (US national rule-of-thumb). Get contractor quotes + a written scope before underwriting a rehab budget.
Schools (NCES district)
- District
- Wylie ISD
- NCES district ID
- 4846500
- Math proficiency
- 63% ▼ -12.00%
- Reading proficiency
- 62% ▼ -4.00%
- Median HH income
- $78,248
- Composite
- 55.86/100
- National rank
- #1206
- State rank
- #32 of 826 in TX
Livability — Abilene
- Score
- 75/100
- State rank
- #142
- US rank
- #4037
Category grades
Schools grade is shown separately in the Schools card above.
Census & demographics
- Census place
- Abilene, TX
- County
- Taylor County · 136,672 people
- City population
- 136,672
- Metro
- Abilene, TX
- Population (ZIP)
- 27,425
- Household income
- $89,551
- Rent vs Own
- Severe rent burden
- 338.0
Population outlook (Taylor County) Hauer SSP2
- Today (2025)
- 145,270 people
- By 2030
- 150,050 · +3.3%
- By 2040
- 159,417 · +9.7%
- By 2050
- 168,883 · +16.3%
- By 2075
- 194,436 · +33.8%
- By 2100
- 203,163 · +39.9%
Race, ethnicity, and origin ACS 2023
- Neighborhood character
- Majority White (64%)
- Race & ethnicity
- White 64% Hispanic / Latino 22% Two or more races 12% Black 10% Asian 2%
- Hispanic origin (detail)
- Mexican 19%
- Common ancestry
- Romanian 2% Italian 2% Portuguese 2%
- Foreign-born
- 6% · Canada, Vietnam, Jamaica
- Languages at home
- 87% English-only · Spanish 9% Other Asian/Pacific 1% French/Haitian/Cajun 1%
Political lean MEDSL · Taylor
- 2024 margin
- Solid R (+49.8) · D 24.6% · R 74.4% · Other 1.0%
- 2008→2024 swing
- -4.2pp toward R · 2008: -45.6pp · 2024: -49.8pp
- All cycles
- 2024: R+49.8 2020: R+45.3 2016: R+51.1 2012: R+53.6 2008: R+45.6
Not yet ingested
- Civics
- —
Market trends
- HPI YoY
- ▼ -46.04%
- Current HPI
- 189.3098
- Rent YoY
- ▲ 33.46%
- Metro
- Abilene, TX
- State GDP YoY
- ▲ 3.95%
- F500 in state
- 110
Industry mix (Fortune 500 HQ in TX)
| Industry | F500 HQs | Revenue |
|---|---|---|
| Energy | 16 | $1,198B |
|
||
| Technology | 5 | $198B |
|
||
| Engineering / Construction | 4 | $72B |
|
||
| Energy Services | 3 | $60B |
|
||
| Utilities | 3 | $41B |
|
||
| Healthcare | 2 | $330B |
|
||
Price history
2 events — show timeline
- 2026-04-20 Pending — NTREIS
- 2026-04-15 Listed $325,000 NTREIS
Cash-flow waterfall
monthlySold comps — $/sqft
last 12 mo · ≤1 miLoading sold comps…