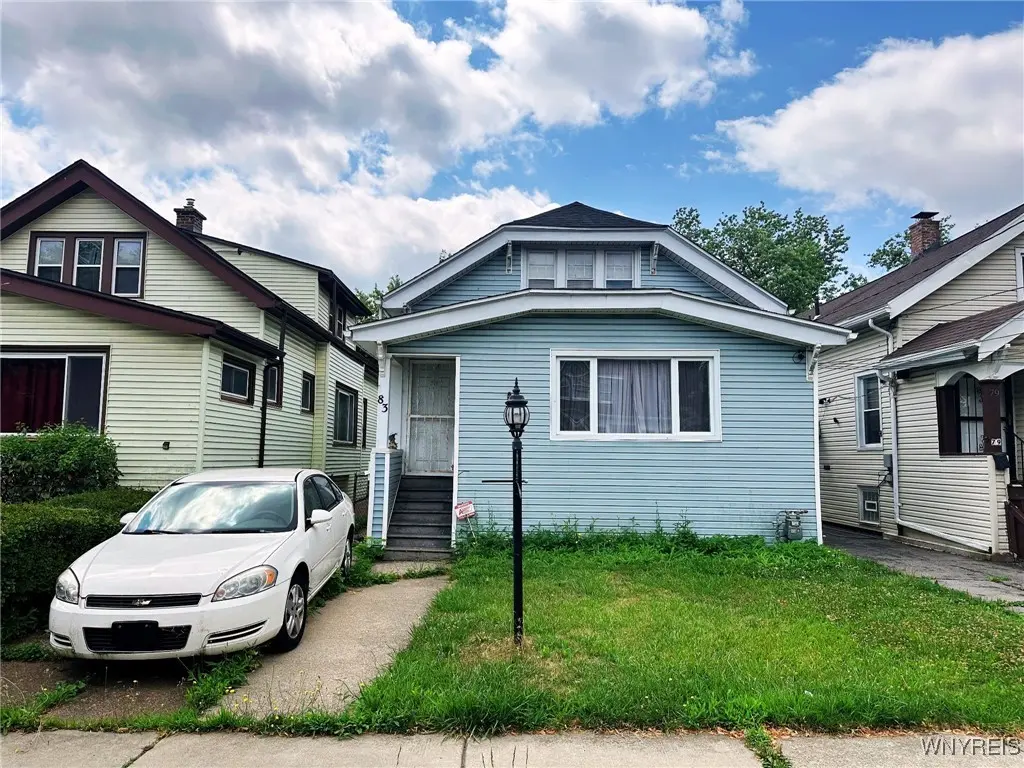
83 Collingwood Ave · Buffalo, NY
Flood risk 1/10 · Minimal
- FEMA flood zone
- X (unshaded)
- Chance of flooding over 30 yrs
- 0.0%
- Est. flood insurance / yr
- $473 – $860
Fire risk 1/10 · Minimal
- Est. fire insurance / yr
- $691 – $1,283
Heat risk 3/10 · Minor
- Hot days now (above 93°F)
- 7 days/yr
- Hot days in 30 yrs
- 15 days/yr
Wind risk 1/10 · Minimal
- Chance of severe wind over 30 yrs
- —
Air-quality risk 3/10 · Minor
- Unhealthy air days now
- 2 days/yr
- Unhealthy air days in 30 yrs
- 3 days/yr
Risk factors via First Street. Map © Google.
Why this score? — see what drove the B+ grade
The composite is a weighted blend of 9 inputs, each scored 0–100. Each bar is that input's sub-score; the figure is the points it added to the 100-point composite (weight × sub-score).
- Cash flow +30.0/30.0
- ARV discount +15.0/15.0
- DSCR +10.0/10.0
- 1% rule +7.8/10.0
- Livability +3.9/5.0
- Schools +3.3/10.0
- Rent growth +2.7/5.0
- Condition / age +2.5/5.0
- Appreciation +0.0/10.0
$110,000
🖨 Deal sheet 📄 Offer letter ✓ Due diligence
Listing remarks
Welcome to 83 Collingwood! Nestled in the heart of Buffalo, this single-family home offers unbeatable convenience with quick access to the thruway and just minutes from shopping and dining in both Cheektowaga and Amherst. The home features two bedrooms on the first floor and two additional bedrooms upstairs. The second floor was originally one spacious bedroom and has been converted into two separate bedrooms perfect for larger households or additional office space. A full bathroom is located on the main level for easy access. You'll also find a full basement providing ample storage and flexibility. Major updates include a full tear-off roof completed just four years ago. With a few cosmeti
Key facts
- Full basement
- Full tear-off roof
- 3,255 sq ft lot
Tags
Neighborhood map
What this means for you Summary
Snapshot
- This is a 3-bed/1.0-bath single-family listed at $110k.
Deal economics
- At list price, monthly cash flow is $467 ($6k/yr) — positive.
- The deal already cash-flows at list — no discount required.
- Meets the 1% rule at list price ($1k rent vs $110k).
- Recommended offer: $108k (1.5% below list) — sets the bar for market timing.
- Cap rate 11.4% vs local median 8.0% in Buffalo — top-decile yield for the area; either an underpriced asset or a hidden risk that comps aren't pricing in. Stress-test before assuming the spread holds.
Location & tenants
- Location reads 77/100 on livability (#195 in NY, #3,011 nationally) — a middle-class / working-renter tenant base. Strengths: commute A+, housing A+, health & safety A+; Watch: crime F, employment D-.
- Buffalo City School District (urban): math 41% / reading 40% proficiency, ranked #535 of 590 in NY (top 91%) — families likely to look elsewhere, expect single-tenant / working-renter base with shorter leases; 75% free/reduced lunch — lower-income household profile, screen leases tightly.
- Market conditions: Rents flat; 237 active listings in the ZIP; 24 comparable units currently listed for rent nearby; rentals lingering (median 44d on market — plan ~5-8 weeks vacancy on turnover, expect pricing pressure); 50% of comp listings sitting > 30 days — soft ceiling on asking rent; lower-income renter base — watch delinquency; 1,244 units permitted in Erie County in 2024 (563 in 5+ unit buildings).
- This rent runs 38% of the median local income ($45k/yr) — at the standard rent-burdened threshold; future hikes will face affordability resistance.
Forward outlook
- Local home prices are declining (-3.0%/yr); year-one equity from $761 of loan paydown is wiped out by about $3k of value loss. Plan a longer hold.
- At projected returns (-3.0% appreciation + 0.7% rent growth), your $31k cash investment doubles in ~8 years — after that, you're playing with house money.
Negotiation context
- It's been on market 25 days — a 2% lower offer ($108k) is reasonable based on typical stale-listing flexibility.
Risks & watch-outs
- Watch-outs: built in 1925 — expect roof / HVAC / electrical / plumbing capex.
Questions for the listing agent
- Built in 1925 — when were the roof, HVAC, electrical panel, plumbing, and water heater last replaced?
- Is there a deadline driving the sale (1031 exchange, divorce, estate, relocation)? That informs how much negotiation room exists.
- Crime grade is F in this area — have there been break-ins, vandalism, or insurance claims at this property in the last 3 years? What carrier currently insures it and at what premium?
- What's the average days-on-market for RENTAL listings here right now (not sales)? A rising rental-DOM trend means longer vacancies and softer asking-rent achievability than the comps imply.
- What's the recent tenant-quality profile in this submarket — average credit score on applications, eviction rate, late-payment / NSF rate, and stable-employment percentage? A property-management company in the area should have these aggregated.
- How much new for-sale + rental construction is in the pipeline within 1–3 miles? Heavy new supply typically softens prices + rents 12–24 months out; constrained supply supports both.
Investment metrics
- 1% rule
- 1.28% ✓
- Cap rate
- 11.39%
- Cash-on-cash
- 18.19%
- DSCR
- 1.81
- GRM
- 6.5
CMA / ARV
- ARV (on-the-fly)
- $153,759
- Comps found
- 12
Show comp detail 12 sales within ~0.75 mi
| Address | Dist | Beds/Ba | Sqft | Sold | Price | $/sf | Match |
|---|---|---|---|---|---|---|---|
| 597 Norfolk Ave | 0.31mi | 3/1.0 | 1,490 (+4%) | 4mo | $160,000 | $107 | 76 |
| 84 Elmer Ave | 0.33mi | 3/1.0 | 1,510 (+5%) | 1mo | $125,000 | $83 | 75 |
| 59 Martha Ave | 0.20mi | 3/1.0 | 1,282 (-11%) | 1mo | $149,000 | $116 | 72 |
| 37 Elmer Ave | 0.25mi | 4/1.0 (+1) | 1,327 (-8%) | 0mo | $170,000 | $128 | 70 |
| 353 Warwick Ave | 0.30mi | 3/1.0 | 1,611 (+12%) | 1mo | $161,800 | $100 | 65 |
| 461 Stockbridge Ave | 0.53mi | 3/1.0 | 1,336 (-7%) | 4mo | $96,500 | $72 | 60 |
| 90 Alma Ave | 0.51mi | 2/2.0 (-1) | 1,360 (-5%) | 3mo | $105,000 | $77 | 56 |
| 496 Berkshire Ave | 0.54mi | 3/1.0 | 1,266 (-12%) | 1mo | $125,000 | $99 | 55 |
| 141 Millicent Ave | 0.36mi | 4/2.0 (+1) | 1,620 (+13%) | 2mo | $142,000 | $88 | 51 |
| 153 Stockbridge Ave | 0.54mi | 3/1.0 | 1,248 (-13%) | 3mo | $150,000 | $120 | 50 |
| 243 Berkshire Ave | 0.43mi | 4/2.0 (+1) | 1,617 (+12%) | 1mo | $220,000 | $136 | 49 |
| 212 Easton Ave | 0.67mi | 4/1.0 (+1) | 1,248 (-13%) | 3mo | $220,000 | $176 | 39 |
Match score weights: distance 35% · size 25% · config 20% · recency 20%. Top-matched comps best support the ARV.
Projected returns pro-forma
-3.0% appreciation · 0.67% rent growth · sell at horizon
- IRR
- 7.4%
- Equity multiple
- 1.28×
- Total profit
- $8,627
- Equity at exit
- $16,401
- IRR
- 14.7%
- Equity multiple
- 2.07×
- Total profit
- $32,944
- Equity at exit
- $9,511
Cash invested: $30,800 (down + closing). Projections, not guarantees.
Landlord ↔ Tenant lean methodology
- Overall (STATE)
- 15 Strongly Tenant-Friendly
- State New York
- 15 Strongly Tenant-Friendly · D+10
- County
- — inherits STATE
- City
- — inherits STATE
ZIP-level market 14215
- Home prices YoY
- -30.0%
- Rents YoY
- 0.7%
- Active inventory
- 237
- Price-to-rent
- 6.5×
Monthly cashflow live
- Estimated rent
- $1,411 high interval (Pro) →
- Mortgage (P&I)
- −$577
- Tax from tax record
- −$25 /mo · $303/yr
- Insurance
- −$46
- HOA
- −$0
- Vacancy / Maint / Mgmt
- −$296
- Net cashflow
- $467
Break-even live
UW: 25.0% down · 7.5% · 30yr · 1.5% tax · 5.0% vac · 8.0% maint · 8.0% mgmt
Financing live
Cash to close
- Down payment
- $27,500
- Closing costs
- $3,300
- Reserves months
- —
- Total cash needed
- —
Loan-product check · same deal, 3 products live
Conventional
25% down · 7.5% · 30yr
- Down + closing
- —
- Monthly P&I
- —
- Monthly cashflow
- —
- DSCR
- —
- Eligible?
- —
Personal DTI + credit; lowest rate.
DSCR
20% down · 8.5% · 30yr
- Down + closing
- —
- Monthly P&I
- —
- Monthly cashflow
- —
- DSCR
- —
- Eligible?
- —
No personal income docs; deal must DSCR.
Hard money
10% down · 12.0% · 12mo
- Down + closing
- —
- Monthly P&I
- —
- Monthly cashflow
- —
- DSCR
- —
- Eligible?
- —
Short-term bridge; refi at stabilization.
Rent comps 24 comps
| Address | Beds | Baths | Sqft | Rent | $/sqft | DOM | Units | Dist |
|---|---|---|---|---|---|---|---|---|
| 97 Davidson Ave Buffalo, NY | 3.0 | 1.0 | 925 | $1,495 | $1.62 | 1d | 1 | 0.30mi |
| 140 Parkridge Ave Buffalo, NY | 3.0 | 1.0 | 990 | $1,500 | $1.52 | 43d | 1 | 0.43mi |
| 189 Westminster Ave Buffalo, NY | 4.0 | 1.5 | 1065 | $1,595 | $1.50 | 10d | 1 | 0.59mi |
| 17 Proctor Ave Unit 1 Buffalo, NY | 2.0 | 1.0 | 900 | $1,100 | $1.22 | 43d | 1 | 0.59mi |
| 74 Dorris Ave Buffalo, NY | 3.0 | 1.0 | 1200 | $1,450 | $1.21 | 43d | 1 | 0.59mi |
| 220 Dartmouth Ave Buffalo, NY | 2.0 | 1.0 | 1000 | $1,100 | $1.10 | 23d | 1 | 0.61mi |
| 71 Gerald Ave Buffalo, NY | 2.0 | 1.0 | 1773 | $1,100 | $0.62 | 43d | 1 | 0.73mi |
| 90 Sussex St Unit 2 Buffalo, NY | 2.0 | 1.0 | 1000 | $1,000 | $1.00 | 43d | 1 | 0.76mi |
| 263 Minnesota Ave Unit Upper Buffalo, NY | 3.0 | 1.0 | 1242 | $1,500 | $1.21 | 14d | 1 | 0.81mi |
| 265 Lisbon Ave Unit 2 Buffalo, NY | 3.0 | 1.0 | 1200 | $1,400 | $1.17 | 43d | 1 | 0.86mi |
| 222 Lisbon Ave Buffalo, NY | 4.0 | 1.0 | 1300 | $1,400 | $1.08 | 23d | 1 | 0.92mi |
| 222 Lisbon Ave Unit Upper Buffalo, NY | 3.0 | 1.0 | 1400 | $1,400 | $1.00 | 43d | 1 | 0.92mi |
| 89 Lasalle Ave Buffalo, NY | 1.0–4.0 | 1.0–4.0 | 1024 | $2,291 | $2.24 | 1d | 10 | 0.97mi |
| 249 Newburgh Ave Unit 2 Buffalo, NY | 2.0 | 1.0 | 930 | $1,300 | $1.40 | 43d | 1 | 0.99mi |
| 92 Lasalle Ave Unit 1 Buffalo, NY | 2.0 | 1.0 | 1000 | $1,150 | $1.15 | 43d | 1 | 1.00mi |
| 216 Newburgh Ave Buffalo, NY | 2.0 | 1.0 | 1690 | $1,150 | $0.68 | 23d | 1 | 1.04mi |
| 61 Courtland Ave Unit Lower Buffalo, NY | 2.0 | 1.0 | 1000 | $1,300 | $1.30 | 43d | 1 | 1.04mi |
| 40 Lisbon Ave Unit Upper Buffalo, NY | 2.0 | 1.0 | 1057 | $1,500 | $1.42 | 11d | 1 | 1.12mi |
| 103 Preston Rd Unit Lower Cheektowaga, NY | 2.0 | 1.0 | 882 | $1,300 | $1.47 | 3d | 1 | 1.18mi |
| 26 Custer St Buffalo, NY | 2.0 | 1.0 | 1000 | $1,300 | $1.30 | 43d | 1 | 1.23mi |
| 85 Blake St Unit 1 Buffalo, NY | 4.0 | 2.0 | 1022 | $1,000 | $0.98 | 43d | 1 | 1.32mi |
| 76 Vernon Pl Unit Upper Buffalo, NY | 3.0 | 1.0 | 1190 | $1,595 | $1.34 | 14d | 1 | 1.40mi |
| 76 Vernon Pl Unit Lower Buffalo, NY | 3.0 | 1.0 | 1190 | $1,445 | $1.21 | 14d | 1 | 1.40mi |
| 60 Englewood Ave Buffalo, NY | 4.0 | 1.0 | 1400 | $1,650 | $1.18 | 1d | 1 | 1.41mi |
Listing history 2 events
-
2025-10-11status Pending
-
2025-09-16$110,000 Active
ⓘ Source: listings_history table (triggers on properties + properties_extension) + one-shot
backfill from property_details.listing_events for pre-trigger history.
Tax reassessment forecast NY · Partial reset (capped growth)
- Current annual tax
- $303 · $25/mo
- Projected year-2 tax
- $1,081 · $90/mo
- Expected delta
- +$778/yr (+$65/mo · 257.1%)
ⓘ Screening estimate from a state-policy table — verify with the county assessor before closing.
Climate risk First Street
- Flood 1/10 Low FEMA zone X (unshaded) · 0% chance over 30 yrs
- Wildfire 1/10 Low
- Heat 3/10 Moderate 7 d/yr ≥93°F today · 15 d/yr by 30 yrs out
- Wind 1/10 Low
- Air quality 3/10 Moderate 2 unhealthy d/yr today · 3 by 30 yrs out
Nearby sold comps map
Loading sold comps map…
Walkable amenities ~0.75 mi
Loading nearby amenities…
Taxation est. · year 1
- Rental income
- $16,933
- − Mortgage interest
- −$6,162
- − Property taxes
- −$303
- − Insurance
- −$550
- − Repairs & maintenance
- −$1,355
- − Management
- −$1,355
- − Depreciation
- −$3,200
- Taxable income
- $4,009
- Est. tax owed @ 24.0%
- −$962
- After-tax cash flow
- $4,640/yr
For passive investors: Depreciation is non-cash, so a rental often shows a tax loss while cash-flowing — sheltering income. Rental losses are passive: they offset passive income freely, and up to $25,000/yr can offset ordinary (W-2) income if you actively participate and your MAGI is under $100k (phasing out to $0 by $150k); unused losses carry forward. On sale, claimed depreciation is recaptured at up to 25%, and gains may owe capital-gains tax (a 1031 exchange can defer both). Figures are a year-1 estimate at your 24.0% rate — not tax advice; consult a CPA.
Schools (NCES district)
- District
- Buffalo City School District
- NCES district ID
- 3605850
- Math proficiency
- 41% ▲ 11.00%
- Reading proficiency
- 40% ▲ 7.00%
- Median HH income
- $31,665
- Composite
- 33.17/100
- National rank
- #5544
- State rank
- #535 of 590 in NY
Livability — Buffalo
- Score
- 77/100
- State rank
- #195
- US rank
- #3011
Category grades
Schools grade is shown separately in the Schools card above.
Census & demographics
- Census place
- Buffalo, NY
- County
- Erie County · 714,559 people
- City population
- 440,021
- Metro
- Buffalo-Cheektowaga, NY
- Population (ZIP)
- 42,524
- Household income
- $44,955
- Rent vs Own
- Severe rent burden
- 2873.0
Population outlook (Erie County) Hauer SSP2
- Today (2025)
- 933,037 people
- By 2030
- 935,181 · +0.2%
- By 2040
- 928,531 · -0.5%
- By 2050
- 905,725 · -2.9%
- By 2075
- 834,037 · -10.6%
- By 2100
- 708,033 · -24.1%
Race, ethnicity, and origin ACS 2023
- Neighborhood character
- Predominantly Black (67%)
- Race & ethnicity
- Black 67% White 15% Asian 7% Hispanic / Latino 6% Two or more races 6%
- Hispanic origin (detail)
- Puerto Rican 4%
- Common ancestry
- Romanian 4% Lithuanian 1% Italian 1%
- Foreign-born
- 9% · Canada, China
- Languages at home
- 88% English-only · Other Indo-European 4% Spanish 4% Chinese 1%
Political lean MEDSL · Erie
- 2024 margin
- Lean D (+9.7) · D 54.8% · R 45.2%
- 2008→2024 swing
- -7.9pp toward R · 2008: 17.5pp · 2024: 9.7pp
- All cycles
- 2024: D+9.7 2020: D+14.7 2016: D+4.8 2012: D+15.6 2008: D+17.5
Not yet ingested
- Civics
- —
Market trends
- HPI YoY
- ▼ -126.29%
- Current HPI
- 295.2966
- Rent YoY
- ▲ 0.67%
- Metro
- Buffalo-Cheektowaga, NY
- State GDP YoY
- ▲ 2.60%
- F500 in state
- 92
Industry mix (Fortune 500 HQ in NY)
| Industry | F500 HQs | Revenue |
|---|---|---|
| Financial Services | 10 | $950B |
|
||
| Consumer Goods | 9 | $162B |
|
||
| Insurance | 4 | $225B |
|
||
| Telecommunications | 2 | $144B |
|
||
| Pharmaceuticals | 2 | $112B |
|
||
| Media / Entertainment | 2 | $69B |
|
||
Price history
2 events — show timeline
- 2025-10-11 Pending — WNYREIS
- 2025-09-16 Listed $110,000 WNYREIS
Property tax history
+7.8%/yrLatest (2025): $303 · +0.0% YoY. Source: county tax records.
Cash-flow waterfall
monthlySold comps — $/sqft
last 12 mo · ≤1 miLoading sold comps…