10695 Sagetown Rd Rd · Millerton, PA
Flood risk 1/10 · Minimal
- FEMA flood zone
- X
- Chance of flooding over 30 yrs
- 0.0%
- Est. flood insurance / yr
- $507 – $1,088
Fire risk 4/10 · Minor
- Est. fire insurance / yr
- $691 – $1,283
Heat risk 2/10 · Minimal
- Hot days now (above 92°F)
- 7 days/yr
- Hot days in 30 yrs
- 16 days/yr
Wind risk 1/10 · Minimal
- Chance of severe wind over 30 yrs
- 1.0%
Air-quality risk 1/10 · Minimal
- Unhealthy air days now
- 0 days/yr
- Unhealthy air days in 30 yrs
- 0 days/yr
Risk factors via First Street. Map © Google.
Why this score? — see what drove the C+ grade
The composite is a weighted blend of 9 inputs, each scored 0–100. Each bar is that input's sub-score; the figure is the points it added to the 100-point composite (weight × sub-score).
- Cash flow +20.3/30.0
- 1% rule +8.5/10.0
- Appreciation +7.7/10.0
- ARV discount +7.5/15.0
- DSCR +6.5/10.0
- Schools +4.2/10.0
- Livability +3.2/5.0
- Rent growth +2.5/5.0
- Condition / age +2.5/5.0
$99,900
🖨 Deal sheet 📄 Offer letter ✓ Due diligence
Listing remarks
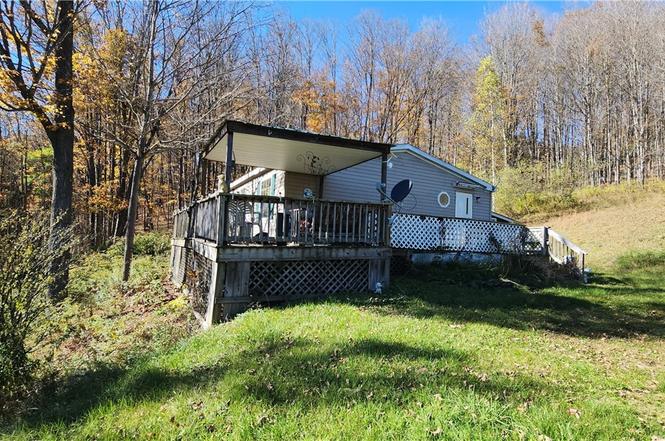
Enjoy peaceful country living in this 3 bedroom, 2 full bath home set on just under 2 acres with beautiful views and room to grow. The welcoming wraparound deck, partially covered, offers the perfect place to sit back and take in the surrounding landscape. Inside, the open floor plan features a kitchen that flows into the dining and living room areas, ideal for gatherings and everyday living. The primary bedroom has plenty of space and large bathroom, with two additional bedrooms providing flexibility for guests, office space, or family needs. The property includes mature fruit trees, gently rolling land, and a lower-level flat area that would make a great spot for a pool, patio, garage, or
Key facts
- Open floor plan
- Mature fruit trees
- Gently rolling land
Tags
Neighborhood map
What this means for you Summary
Snapshot
- This is a 3-bed/2.0-bath manufactured listed at $100k.
Deal economics
- At list price, monthly cash flow is $129 ($2k/yr) — positive.
- The deal already cash-flows at list — no discount required.
- Meets the 1% rule at list price ($1k rent vs $100k).
- Recommended offer: $88k (12.0% below list) — sets the bar for market timing.
Location & tenants
- Location reads 65/100 on livability (#1,146 in PA) — a middle-class / working-renter tenant base. Strengths: employment A+, housing A+, cost of living A-; Watch: health & safety D, amenities F, commute F.
- Corning City School District (town): math 44% / reading 53% proficiency, ranked #406 of 590 in NY (top 69%) — families likely to look elsewhere, expect single-tenant / working-renter base with shorter leases.
- Zoned schools: Frederick Carder Elementary School (math 44% / reading 50%, grade D-, #1,195 of 2,108 statewide, top 60%, 406 students, 39% FRL).
- Market conditions: 196 units permitted in Steuben County in 2024 (0 in 5+ unit buildings).
Forward outlook
- In year one you build about $6k of equity ($691 loan paydown + $5k appreciation (5.4% local appreciation)).
- Steuben County population projected at -20% by 2050 — secular population decline; favor cash flow + early exit over multi-decade hold.
- At projected returns (5.4% appreciation + 3.0% rent growth), your $28k cash investment doubles in ~4 years — after that, you're playing with house money.
- By year 6, paydown + projected appreciation supports a ~$33k cash-out refi (75% LTV) — recoverable capital for the next deal without selling this one.
Negotiation context
- It's been on market 133 days — a 12% lower offer ($88k) is reasonable based on typical stale-listing flexibility.
- 9 sale attempts since 13y ago; this cycle's ask has dropped $6k (6%) from the opening price — seller is motivated, your offer sets the floor, not the list.
- Current owner paid $22k; list at $100k implies a 344% gain — meaningful room to come down on a strong offer.
Risks & watch-outs
- Watch-outs: property tax is 4.5% of price.
Questions for the listing agent
- It's been on market 133 days. Have you received any prior offers? Is the seller open to a 12% concession, seller financing, or rate buy-down credit?
- Property tax is high relative to price — has the assessment been appealed recently, and will the sale trigger a re-assessment?
- Why hasn't it sold? Are there any deal-killer items the seller is aware of (foundation, flood, title, zoning, code violations)?
- Is there a deadline driving the sale (1031 exchange, divorce, estate, relocation)? That informs how much negotiation room exists.
- Schools are F-rated, which usually means shorter tenancies and higher turnover. Who's the typical renter profile here, and what's been the actual vacancy rate?
- What's the average days-on-market for RENTAL listings here right now (not sales)? A rising rental-DOM trend means longer vacancies and softer asking-rent achievability than the comps imply.
- What's the recent tenant-quality profile in this submarket — average credit score on applications, eviction rate, late-payment / NSF rate, and stable-employment percentage? A property-management company in the area should have these aggregated.
- How much new for-sale + rental construction is in the pipeline within 1–3 miles? Heavy new supply typically softens prices + rents 12–24 months out; constrained supply supports both.
Investment metrics
- 1% rule
- 1.35% ✓
- Cap rate
- 7.84%
- Cash-on-cash
- 5.53%
- DSCR
- 1.25
- GRM
- 6.2
CMA / ARV
No comps found within radius.
Projected returns pro-forma
5.43% appreciation · 3.0% rent growth · sell at horizon
- IRR
- 18.7%
- Equity multiple
- 2.21×
- Total profit
- $33,846
- Equity at exit
- $59,212
- IRR
- 18.5%
- Equity multiple
- 4.38×
- Total profit
- $94,492
- Equity at exit
- $104,410
Cash invested: $27,972 (down + closing). Projections, not guarantees.
Landlord ↔ Tenant lean methodology
- Overall (STATE)
- 62 Landlord-Friendly
- State Pennsylvania
- 62 Landlord-Friendly · EVEN
- County
- — inherits STATE
- City
- — inherits STATE
ZIP-level market 14858
- Home prices YoY
- 2.1%
- Price-to-rent
- 6.2×
Monthly cashflow live
- Estimated rent
- $1,353 medium interval (Pro) →
- Mortgage (P&I)
- −$524
- Tax from tax record
- −$374 /mo · $4,491/yr
- Insurance
- −$42
- HOA
- −$0
- Vacancy / Maint / Mgmt
- −$284
- Net cashflow
- $129
Break-even live
UW: 25.0% down · 7.5% · 30yr · 1.5% tax · 5.0% vac · 8.0% maint · 8.0% mgmt
Financing live
Cash to close
- Down payment
- $24,975
- Closing costs
- $2,997
- Reserves months
- —
- Total cash needed
- —
Loan-product check · same deal, 3 products live
Conventional
25% down · 7.5% · 30yr
- Down + closing
- —
- Monthly P&I
- —
- Monthly cashflow
- —
- DSCR
- —
- Eligible?
- —
Personal DTI + credit; lowest rate.
DSCR
20% down · 8.5% · 30yr
- Down + closing
- —
- Monthly P&I
- —
- Monthly cashflow
- —
- DSCR
- —
- Eligible?
- —
No personal income docs; deal must DSCR.
Hard money
10% down · 12.0% · 12mo
- Down + closing
- —
- Monthly P&I
- —
- Monthly cashflow
- —
- DSCR
- —
- Eligible?
- —
Short-term bridge; refi at stabilization.
Listing history 19 events
-
2026-03-10status Pending
-
2026-01-12price $99,900
-
2025-10-27$105,999 Active
-
2025-06-13status Active
-
2025-05-22historical Active Under Contract
-
2025-04-17status Active
-
2025-04-11status Pending
-
2025-03-28historical
-
2025-03-20price $112,500
-
2025-02-18$119,500 Active
-
2024-11-08price $119,500
-
2024-10-23$119,500 Active
-
2024-09-30$129,000 Active
-
2015-02-05historical
-
2014-05-31historical
-
2013-12-31$87,900
-
2013-12-31$87,900
-
2013-08-01$87,900
-
2002-11-04soldstatus $22,500
ⓘ Source: listings_history table (triggers on properties + properties_extension) + one-shot
backfill from property_details.listing_events for pre-trigger history.
Tax reassessment forecast PA · Partial reset (capped growth)
- Current annual tax
- $4,491 · $374/mo
- Projected year-2 tax
- $4,491 · $374/mo
- Expected delta
- $0/yr ($0/mo · 0.0%)
ⓘ Screening estimate from a state-policy table — verify with the county assessor before closing.
Climate risk First Street
- Flood 1/10 Low FEMA zone X · 0% chance over 30 yrs
- Wildfire 4/10 Moderate
- Heat 2/10 Low 7 d/yr ≥92°F today · 16 d/yr by 30 yrs out
- Wind 1/10 Low 100% chance of damaging wind over 30 yrs
- Air quality 1/10 Low 0 unhealthy d/yr today · 0 by 30 yrs out
Nearby sold comps map
Loading sold comps map…
Walkable amenities ~0.75 mi
Loading nearby amenities…
Taxation est. · year 1
- Rental income
- $16,231
- − Mortgage interest
- −$5,596
- − Property taxes
- −$4,491
- − Insurance
- −$500
- − Repairs & maintenance
- −$1,299
- − Management
- −$1,299
- − Depreciation
- −$2,906
- Taxable income
- $142
- Est. tax owed @ 24.0%
- −$34
- After-tax cash flow
- $1,512/yr
For passive investors: Depreciation is non-cash, so a rental often shows a tax loss while cash-flowing — sheltering income. Rental losses are passive: they offset passive income freely, and up to $25,000/yr can offset ordinary (W-2) income if you actively participate and your MAGI is under $100k (phasing out to $0 by $150k); unused losses carry forward. On sale, claimed depreciation is recaptured at up to 25%, and gains may owe capital-gains tax (a 1031 exchange can defer both). Figures are a year-1 estimate at your 24.0% rate — not tax advice; consult a CPA.
Schools (NCES district)
- District
- Corning City School District
- NCES district ID
- 3608400
- Math proficiency
- 44% ▼ -12.00%
- Reading proficiency
- 53% ▲ 4.00%
- Median HH income
- $53,042
- Composite
- 41.8/100
- National rank
- #3392
- State rank
- #406 of 590 in NY
Livability — Millerton
- Score
- 65/100
- State rank
- #1146
- US rank
- #13184
Category grades
Schools grade is shown separately in the Schools card above.
Census & demographics
- Population (ZIP)
- 1,405
Population outlook (Steuben County) Hauer SSP2
- Today (2025)
- 93,062 people
- By 2030
- 89,793 · -3.5%
- By 2040
- 82,353 · -11.5%
- By 2050
- 74,286 · -20.2%
- By 2075
- 55,589 · -40.3%
- By 2100
- 37,587 · -59.6%
Race, ethnicity, and origin ACS 2023
- Neighborhood character
- Predominantly White (93%)
- Race & ethnicity
- White 93% Two or more races 5%
- Common ancestry
- Slovak 3% Lithuanian 2% Romanian 2%
- Foreign-born
- 1%
Political lean MEDSL · Steuben
- 2024 margin
- Solid R (+31.8) · D 34.1% · R 65.9%
- 2008→2024 swing
- -15.0pp toward R · 2008: -16.8pp · 2024: -31.8pp
- All cycles
- 2024: R+31.8 2020: R+29.6 2016: R+36.2 2012: R+16.4 2008: R+16.8
Not yet ingested
- Civics
- —
Market trends
- HPI YoY
- ▲ 5.43%
- Current HPI
- 259.0652
- Rent YoY
- —
- Metro
- —
- State GDP YoY
- ▲ 1.68%
- F500 in state
- 34
Industry mix (Fortune 500 HQ in PA)
| Industry | F500 HQs | Revenue |
|---|---|---|
| Healthcare | 2 | $309B |
|
||
| Insurance | 2 | $27B |
|
||
| Telecommunications / Media | 1 | $124B |
|
||
| Industrial Distribution | 1 | $22B |
|
||
| Financial Services | 1 | $20B |
|
||
| Chemicals / Materials | 1 | $18B |
|
||
Price history
+344.0% since first listed19 events — show timeline
- 2026-03-10 Pending — IBRMLS
- 2026-01-12 Price Changed $99,900 IBRMLS
- 2025-10-27 Listed $105,999 IBRMLS
- 2025-06-13 Relisted — IBRMLS
- 2025-05-22 Contingent — IBRMLS
- 2025-04-17 Relisted — IBRMLS
- 2025-04-11 Pending — IBRMLS
- 2025-03-28 Listing Removed — UNYREIS
- 2025-03-20 Price Changed $112,500 IBRMLS
- 2025-02-18 Listed $119,500 IBRMLS
- 2024-11-08 Price Changed $119,500 IBRMLS
- 2024-10-23 Listed $119,500 UNYREIS
- 2024-09-30 Listed $129,000 IBRMLS
- 2015-02-05 Listing Removed — UNYREIS
- 2014-05-31 Listing Removed — UNYREIS
- 2013-12-31 Listed $87,900 UNYREIS
- 2013-12-31 Listed $87,900 IBRMLS
- 2013-08-01 Listed $87,900 UNYREIS
- 2002-11-04 Sold (Public Records) $22,500 Public Records
Property tax history
+3.7%/yrLatest (2025): $4,491 · +3.3% YoY. Source: county tax records.
Cash-flow waterfall
monthlySold comps — $/sqft
last 12 mo · ≤1 miLoading sold comps…