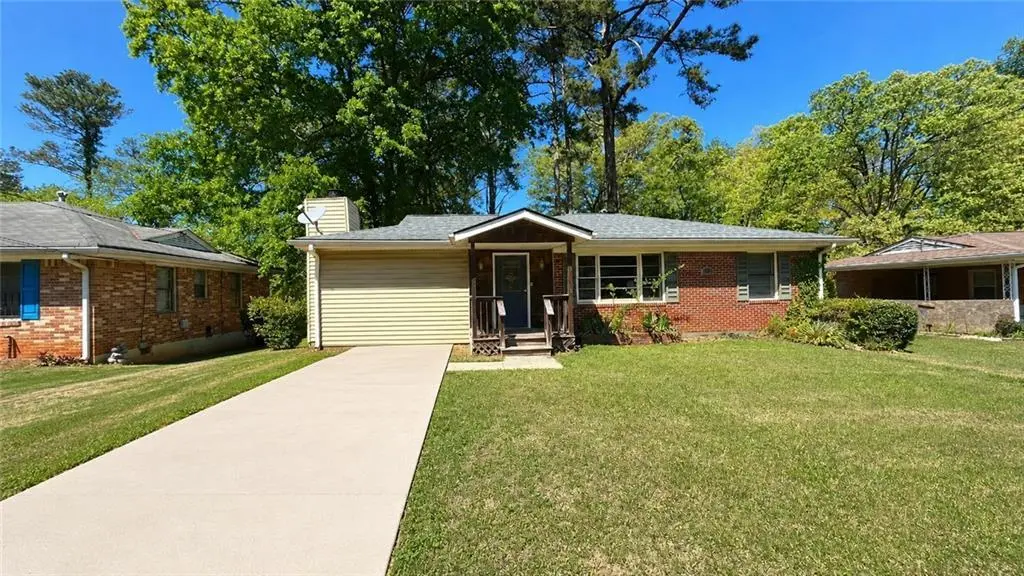
2215 Bonner Rd · East Point, GA
Flood risk 1/10 · Minimal
- FEMA flood zone
- X (unshaded)
- Chance of flooding over 30 yrs
- 0.0%
- Est. flood insurance / yr
- $473 – $860
Fire risk 1/10 · Minimal
- Est. fire insurance / yr
- $963 – $1,789
Heat risk 5/10 · Moderate
- Hot days now (above 103°F)
- 7 days/yr
- Hot days in 30 yrs
- 18 days/yr
Wind risk 6/10 · Moderate
- Chance of severe wind over 30 yrs
- 27.0%
Air-quality risk 3/10 · Minor
- Unhealthy air days now
- 3 days/yr
- Unhealthy air days in 30 yrs
- 3 days/yr
Risk factors via First Street. Map © Google.
Why this score? — see what drove the C grade
The composite is a weighted blend of 9 inputs, each scored 0–100. Each bar is that input's sub-score; the figure is the points it added to the 100-point composite (weight × sub-score).
- Cash flow +19.5/30.0
- ARV discount +15.0/15.0
- DSCR +6.2/10.0
- 1% rule +5.3/10.0
- Schools +4.5/10.0
- Livability +3.6/5.0
- Rent growth +2.8/5.0
- Condition / age +2.5/5.0
- Appreciation +0.0/10.0
$178,000
🖨 Deal sheet 📄 Offer letter ✓ Due diligence
Listing remarks MLS
Charming 4-sided brick ranch in East Point's Conley Hills! This updated gem features an open layout with gleaming hardwoods, recessed lighting, and a chef's kitchen with granite counters and shaker cabinets. Enjoy a newer roof (2022) and HVAC (2023). The spacious deck overlooks a large, level, fully fenced backyard-perfect for entertaining. Minutes from the Airport, Tyler Perry Studios, and Downtown Atlanta. Move-in ready and waiting for you! Schedule your tour today.
Key facts
- 0.3 acre lot
- 2 parking spots
- Built 1955
Property features AI
Exterior
- Parking: Driveway parking; Two total parking spaces; Open parking available
- Utilities: Private water source; Public sewer; 220-volt electric; Cable available; Electricity available; Natural gas available
- Home design: One-and-one-half level home; Aluminum siding and brick exterior; Slab foundation; Asbestos shingle roof
- Construction: Aluminum siding; Brick construction; Slab foundation; Asbestos shingle roof; Resale condition
- Exterior features: Front porch; Deck; Back yard fencing; Other exterior features
Interior
- Kitchen: Eat-in kitchen with breakfast area; Stained cabinets; View to family room; Dishwasher; Gas range; Microwave; Range hood; Refrigerator
- Bedrooms: Master bedroom on main level; Three main-level bedrooms
- Flooring: Hardwood; Laminate; Concrete
- Bathrooms: One full bathroom; One half bathroom; Master bathroom with separate tub and shower; One main-level full bathroom; One main-level half bathroom
- Heating & cooling: Forced air heating; Ceiling fan(s) for cooling
- Interior features: Entrance foyer; High-speed internet available; Track lighting; Disappearing attic stairs; Walk-in closets; Brick fireplace in master bedroom; One fireplace total; Storm shutters and storm windows; No common walls
- Laundry & utility: Laundry located on lower level and in a bathroom; Dryer included
Neighborhood map
What this means for you Summary
Snapshot
- This is a 3-bed/1.5-bath single-family listed at $178k.
Deal economics
- At list price, monthly cash flow is $203 ($2k/yr) — positive.
- The deal already cash-flows at list — no discount required.
- Meets the 1% rule at list price ($2k rent vs $178k).
- Recommended offer: $175k (1.5% below list) — sets the bar for market timing.
- Cap rate 7.7% vs local median 5.1% in East Point — top-decile yield for the area; either an underpriced asset or a hidden risk that comps aren't pricing in. Stress-test before assuming the spread holds.
Location & tenants
- Location reads 72/100 on livability (#72 in GA) — a middle-class / working-renter tenant base. Strengths: commute A+, cost of living A+, housing A+; Watch: employment D+, crime F, amenities F.
- Fulton County (suburban): math 49% / reading 53% proficiency, ranked #12 of 174 in GA (top 7%) — acceptable for families but not a draw, mixed tenant base, ~2y average lease.
- Zoned schools: Paul D. West Middle School (math 17% / reading 17%, grade F, #381 of 470 statewide, top 82%, 803 students, 100% FRL); Tri-Cities High School (math 5% / reading 30%, grade F, #264 of 424 statewide, top 63%, 1,483 students, 100% FRL) — zoned schools average 100% FRL vs 41% district-wide (59 pts higher); higher-poverty schools than district average — tighter screening recommended.
- Zoned-school proficiency averages 17% at this address vs 51% district-wide (-34 pts) — the specific schools serving this property underperform the Fulton County average; the district grade overstates school quality for this exact location.
- Market conditions: Rents rising (+1.4%/yr); 283 active listings in the ZIP; 40 comparable units currently listed for rent nearby; rentals at typical pace (median 24d on market — plan ~3-4 weeks tenant-placement turnaround); 11,565 units permitted in Fulton County in 2024 (8,159 in 5+ unit buildings).
Forward outlook
- Local home prices are declining (-3.0%/yr); year-one equity from $1k of loan paydown is wiped out by about $5k of value loss. Plan a longer hold.
- Fulton County population projected at +38% by 2050 — long-run rental-demand tailwind backs the buy-and-hold thesis.
Negotiation context
- It's been on market 27 days — a 2% lower offer ($175k) is reasonable based on typical stale-listing flexibility.
- 2 sale attempts with the ask held roughly flat each time — persistent listings suggest the price (not the market) is what's stuck; bring a comps-based counter.
- Current owner paid $69k; list at $178k implies a 158% gain — meaningful room to come down on a strong offer.
Risks & watch-outs
- Watch-outs: built in 1955 — expect roof / HVAC / electrical / plumbing capex.
- Climate carrying-cost: major wind risk, 27% chance of damaging wind over 30y; extreme-heat days projected 7→18/yr by 2055 (HVAC capex compounding) — expect insurance premiums to compound above CPI over the hold.
Questions for the listing agent
- Built in 1955 — when were the roof, HVAC, electrical panel, plumbing, and water heater last replaced?
- Is there a deadline driving the sale (1031 exchange, divorce, estate, relocation)? That informs how much negotiation room exists.
- Schools are F-rated, which usually means shorter tenancies and higher turnover. Who's the typical renter profile here, and what's been the actual vacancy rate?
- Crime grade is F in this area — have there been break-ins, vandalism, or insurance claims at this property in the last 3 years? What carrier currently insures it and at what premium?
- What's the average days-on-market for RENTAL listings here right now (not sales)? A rising rental-DOM trend means longer vacancies and softer asking-rent achievability than the comps imply.
- What's the recent tenant-quality profile in this submarket — average credit score on applications, eviction rate, late-payment / NSF rate, and stable-employment percentage? A property-management company in the area should have these aggregated.
- How much new for-sale + rental construction is in the pipeline within 1–3 miles? Heavy new supply typically softens prices + rents 12–24 months out; constrained supply supports both.
Investment metrics
- 1% rule
- 1.03% ✓
- Cap rate
- 7.66%
- Cash-on-cash
- 4.90%
- DSCR
- 1.22
- GRM
- 8.1
CMA / ARV
- ARV (median comp)
- $246,240
- List price
- $178,000
- Delta
- -27.71%
- Verdict
- UNDERPRICED
- Comps
- 20 within 1.0 mi
Show comp detail 12 sales within ~0.75 mi
| Address | Dist | Beds/Ba | Sqft | Sold | Price | $/sf | Match |
|---|---|---|---|---|---|---|---|
| 2513 Graywall St | 0.38mi | 3/2.0 | 1,242 (-8%) | 3mo | $175,000 | $141 | 64 |
| 2576 Wood Valley Dr | 0.45mi | 4/1.5 (+1) | 1,443 (+6%) | 1mo | $195,000 | $135 | 63 |
| 2607 Farley St | 0.49mi | 3/2.0 | 1,261 (-7%) | 1mo | $145,000 | $115 | 62 |
| 2272 Dodson Dr | 0.74mi | 3/2.0 | 1,382 (+2%) | 4mo | $219,000 | $158 | 57 |
| 2024 Neely Ave | 0.69mi | 3/1.5 | 1,256 (-7%) | 0mo | $190,000 | $151 | 55 |
| 2309 Bryant Dr | 0.65mi | 3/1.5 | 1,238 (-9%) | 5mo | $155,000 | $125 | 51 |
| 2345 Old Colony Rd | 0.48mi | 3/1.0 | 1,178 (-13%) | 8mo | $280,000 | $238 | 47 |
| 1884 Spring Ave | 0.69mi | 2/1.0 (-1) | 1,241 (-8%) | 2mo | $249,900 | $201 | 45 |
| 2162 Westover Dr | 0.66mi | 3/1.0 | 1,184 (-13%) | 5mo | $201,570 | $170 | 42 |
| 2194 Ivydale St | 0.49mi | 4/2.0 (+1) | 1,210 (-11%) | 13mo | $160,000 | $132 | 41 |
| 2000 Grove Ave | 0.59mi | 3/2.5 | 1,511 (+12%) | 13mo | $350,000 | $232 | 38 |
| 2023 Montrose Dr | 0.73mi | 2/2.0 (-1) | 1,500 (+11%) | 7mo | $275,000 | $183 | 35 |
Match score weights: distance 35% · size 25% · config 20% · recency 20%. Top-matched comps best support the ARV.
Projected returns pro-forma
-3.0% appreciation · 1.35% rent growth · sell at horizon
- IRR
- -10.6%
- Equity multiple
- 0.62×
- Total profit
- $-18,846
- Equity at exit
- $26,540
- IRR
- -3.7%
- Equity multiple
- 0.77×
- Total profit
- $-11,463
- Equity at exit
- $15,390
Cash invested: $49,840 (down + closing). Projections, not guarantees.
Landlord ↔ Tenant lean methodology
- Overall (STATE)
- 90 Strongly Landlord-Friendly
- State Georgia
- 90 Strongly Landlord-Friendly · R+3
- County
- — inherits STATE
- City
- — inherits STATE
ZIP-level market 30344
- Home prices YoY
- -31.0%
- Rents YoY
- 1.4%
- Active inventory
- 283
- Price-to-rent
- 8.1×
Monthly cashflow live
- Estimated rent
- $1,832 high interval (Pro) →
- Mortgage (P&I)
- −$933
- Tax from tax record
- −$237 /mo · $2,839/yr
- Insurance
- −$74
- HOA
- −$0
- Vacancy / Maint / Mgmt
- −$385
- Net cashflow
- $203
Break-even live
UW: 25.0% down · 7.5% · 30yr · 1.5% tax · 5.0% vac · 8.0% maint · 8.0% mgmt
Financing live
Cash to close
- Down payment
- $44,500
- Closing costs
- $5,340
- Reserves months
- —
- Total cash needed
- —
Loan-product check · same deal, 3 products live
Conventional
25% down · 7.5% · 30yr
- Down + closing
- —
- Monthly P&I
- —
- Monthly cashflow
- —
- DSCR
- —
- Eligible?
- —
Personal DTI + credit; lowest rate.
DSCR
20% down · 8.5% · 30yr
- Down + closing
- —
- Monthly P&I
- —
- Monthly cashflow
- —
- DSCR
- —
- Eligible?
- —
No personal income docs; deal must DSCR.
Hard money
10% down · 12.0% · 12mo
- Down + closing
- —
- Monthly P&I
- —
- Monthly cashflow
- —
- DSCR
- —
- Eligible?
- —
Short-term bridge; refi at stabilization.
Rent comps 40 comps
| Address | Beds | Baths | Sqft | Rent | $/sqft | DOM | Units | Dist |
|---|---|---|---|---|---|---|---|---|
| 2284 Headland Dr Atlanta, GA | 3.0 | 3.5 | 1117 | $1,502 | $1.34 | 12d | 1 | 0.15mi |
| 2287 Mulberry St Unit B Atlanta, GA | 3.0 | 1.0 | 1700 | $2,500 | $1.47 | 24d | 1 | 0.30mi |
| 2560 Wood Valley Dr Atlanta, GA | 4.0 | 2.5 | 1141 | $1,900 | $1.67 | 17d | 1 | 0.39mi |
| 2560 Wood Valley Dr Atlanta, GA | 4.0 | 2.5 | 1141 | $1,900 | $1.67 | 24d | 1 | 0.39mi |
| 2514 Riggs Dr Atlanta, GA | 4.0 | 2.0 | 1274 | $2,000 | $1.57 | 43d | 1 | 0.41mi |
| 2124 Delowe Dr Unit 2124J East Point, GA | 3.0 | 1.0 | 920 | $1,500 | $1.63 | 24d | 1 | 0.47mi |
| 2467 Calvin Ave Atlanta, GA | 3.0 | 2.0 | 1200 | $1,950 | $1.62 | 24d | 1 | 0.56mi |
| 1917 Connally Dr Atlanta, GA | 3.0 | 2.0 | 1534 | $1,850 | $1.21 | 12d | 1 | 0.57mi |
| 2450 Hillcrest Dr Atlanta, GA | 2.0 | 1.5 | 918 | $2,400 | $2.61 | 16d | 1 | 0.58mi |
| 1902 Connally Dr Atlanta, GA | 2.0 | 1.5 | 993 | $2,450 | $2.47 | 43d | 1 | 0.59mi |
| 1903 Chattahoochee Pl Atlanta, GA | 3.0 | 2.0 | 1333 | $1,850 | $1.39 | 12d | 1 | 0.59mi |
| 2610 Harmony Way Atlanta, GA | 3.0 | 1.0 | 1100 | $1,095 | $1.00 | 24d | 1 | 0.65mi |
| 2656 Westchester Dr Atlanta, GA | 3.0 | 1.0 | 1025 | $1,600 | $1.56 | 19d | 1 | 0.66mi |
| 2039 Bent Creek Way SW Atlanta, GA | 1.0–2.0 | 1.0 | 898 | $1,200 | $1.34 | 7d | 1 | 0.67mi |
| 1994 Bent Creek Way SW Atlanta, GA | 1.0–3.0 | 1.0–2.0 | 1041 | $1,455 | $1.40 | 7d | 1 | 0.68mi |
| 2756 Plantation Dr Atlanta, GA | 3.0 | 2.0 | 1119 | $1,950 | $1.74 | 20d | 1 | 0.76mi |
| 2250 Dodson Dr Atlanta, GA | 4.0 | 2.0 | 1522 | $4,200 | $2.76 | 43d | 1 | 0.77mi |
| 2481 Semmes St Atlanta, GA | 3.0 | 1.0 | 1500 | $1,850 | $1.23 | 43d | 1 | 0.81mi |
| 2764 Riggs Dr Atlanta, GA | 3.0 | 2.0 | 1147 | $2,050 | $1.79 | 43d | 1 | 0.82mi |
| 1932 Montrose Dr Atlanta, GA | 3.0 | 1.0 | 1200 | $1,750 | $1.46 | 18d | 1 | 0.82mi |
| 2400 Campbellton Rd SW Atlanta, GA | 2.0 | 2.0 | 1125 | $1,250 | $1.11 | 24d | 1 | 0.83mi |
| 2400 Campbellton Rd SW Atlanta, GA | 1.0–3.0 | 1.0–2.5 | 1350 | $1,450 | $1.07 | 7d | 2 | 0.83mi |
| 2400 Campbellton Rd SW Atlanta, GA | 2.0–3.0 | 1.5–2.5 | 1237 | $1,450 | $1.17 | 16d | 3 | 0.83mi |
| 1914 Montrose Dr Atlanta, GA | 2.0 | 1.0 | 1216 | $2,000 | $1.64 | 43d | 1 | 0.85mi |
| 2641 Connally Dr East Point, GA | 2.0 | 1.0 | 1000 | $1,500 | $1.50 | 43d | 1 | 0.85mi |
| 2328 Campbellton Rd SW Atlanta, GA | 1.0–3.0 | 1.0–2.0 | 1014 | $1,400 | $1.38 | 24d | 9 | 0.86mi |
| 2675 Headland Dr Atlanta, GA | 3.0 | 2.0 | 1408 | $1,600 | $1.14 | 17d | 1 | 0.88mi |
| 2523 Ben Hill Rd Atlanta, GA | 3.0 | 1.5 | 1412 | $3,000 | $2.12 | 22d | 1 | 0.90mi |
| 2730 Pearl St Unit 1 East Point, GA | 2.0 | 1.0 | 910 | $1,175 | $1.29 | 43d | 1 | 0.96mi |
| 1870 Myrtle Dr SW Atlanta, GA | 1.0–3.0 | 1.0–2.0 | 900 | $1,375 | $1.53 | 22d | 26 | 0.98mi |
| 1867 Myrtle Dr SW #24 Atlanta, GA | 3.0 | 2.5 | 1400 | $1,400 | $1.00 | 18d | 1 | 0.98mi |
| 1867 Myrtle Dr SW Atlanta, GA | 3.0 | 2.5 | 1400 | $1,400 | $1.00 | 24d | 1 | 0.99mi |
| 1742 Ware Ave Atlanta, GA | 2.0 | 1.0 | 916 | $1,300 | $1.42 | 24d | 1 | 1.03mi |
| 1988 Plaza Ln SW Atlanta, GA | 1.0–3.0 | 1.0–2.0 | 990 | $1,299 | $1.31 | 1d | 13 | 1.09mi |
| 1988 Plaza Ln SW Atlanta, GA | 1.0–3.0 | 1.0–2.0 | 990 | $1,299 | $1.31 | 10d | 13 | 1.09mi |
| 2933 Cloverhurst Dr Atlanta, GA | 4.0 | 3.0 | 1550 | $2,500 | $1.61 | 20d | 1 | 1.13mi |
| 1932 Stanton Rd East Point, GA | 1.0–3.0 | 1.0–2.0 | 1045 | $1,599 | $1.53 | 43d | 1 | 1.16mi |
| 1656 Ware Ave Atlanta, GA | 3.0 | 2.0 | 1866 | $2,150 | $1.15 | 43d | 1 | 1.20mi |
| 3004 Bayrose Cir Unit 102B Atlanta, GA | 3.0 | 3.0 | 1564 | $2,250 | $1.44 | 4d | 1 | 1.21mi |
| 3004 Bayrose Cir East Point, GA | 3.0 | 3.0 | 1564 | $2,350 | $1.50 | 43d | 1 | 1.21mi |
Listing history 19 events
-
2026-06-18days on market $178,000 Active 27 DOM
-
2026-06-17days on market $178,000 Active 26 DOM
-
2026-06-16days on market $178,000 Active 25 DOM
-
2026-06-15days on market $178,000 Active 24 DOM
-
2026-06-13days on market $178,000 Active 22 DOM
-
2026-06-09days on market $178,000 Active 18 DOM
-
2026-06-08days on market $178,000 Active 17 DOM
-
2026-06-07days on market $178,000 Active 16 DOM
-
2026-06-04days on market $178,000 Active 13 DOM
-
2026-06-03days on market $178,000 Active 12 DOM
-
2026-06-01days on market $178,000 Active 10 DOM
-
2026-05-31days on market $178,000 Active 9 DOM
-
2026-05-15historical $178,000 472-char remark
Show marketing remark (472 chars)
Charming 4-sided brick ranch in East Point's Conley Hills! This updated gem features an open layout with gleaming hardwoods, recessed lighting, and a chef's kitchen with granite counters and shaker cabinets. Enjoy a newer roof (2022) and HVAC (2023). The spacious deck overlooks a large, level, fully fenced backyard-perfect for entertaining. Minutes from the Airport, Tyler Perry Studios, and Downtown Atlanta. Move-in ready and waiting for you! Schedule your tour today.
-
2026-05-15historical $178,000 490-char remark
Show marketing remark (472 chars)
Charming 4-sided brick ranch in East Point's Conley Hills! This updated gem features an open layout with gleaming hardwoods, recessed lighting, and a chef's kitchen with granite counters and shaker cabinets. Enjoy a newer roof (2022) and HVAC (2023). The spacious deck overlooks a large, level, fully fenced backyard-perfect for entertaining. Minutes from the Airport, Tyler Perry Studios, and Downtown Atlanta. Move-in ready and waiting for you! Schedule your tour today.
-
2011-12-12soldstatus $69,000
-
2005-08-24soldstatus $91,000
-
2005-07-01soldstatus $82,500
-
2001-07-19soldstatus $93,000
-
1986-02-26soldstatus $55,000
ⓘ Source: listings_history table (triggers on properties + properties_extension) + one-shot
backfill from property_details.listing_events for pre-trigger history.
Tax reassessment forecast GA · Resets to sale price
- Current annual tax
- $2,839 · $237/mo
- Projected year-2 tax
- $2,839 · $237/mo
- Expected delta
- $0/yr ($0/mo · 0.0%)
ⓘ Screening estimate from a state-policy table — verify with the county assessor before closing.
Climate risk First Street
- Flood 1/10 Low FEMA zone X (unshaded) · 0% chance over 30 yrs
- Wildfire 1/10 Low
- Heat 5/10 Major 7 d/yr ≥103°F today · 18 d/yr by 30 yrs out
- Wind 6/10 Major 27% chance of damaging wind over 30 yrs
- Air quality 3/10 Moderate 3 unhealthy d/yr today · 3 by 30 yrs out
Nearby sold comps map
Loading sold comps map…
Walkable amenities ~0.75 mi
Loading nearby amenities…
Taxation est. · year 1
- Rental income
- $21,988
- − Mortgage interest
- −$9,971
- − Property taxes
- −$2,839
- − Insurance
- −$890
- − Repairs & maintenance
- −$1,759
- − Management
- −$1,759
- − Depreciation
- −$5,178
- Taxable loss
- −$407
- Est. tax savings @ 24.0%
- +$98
- After-tax cash flow
- $2,539/yr
For passive investors: Depreciation is non-cash, so a rental often shows a tax loss while cash-flowing — sheltering income. Rental losses are passive: they offset passive income freely, and up to $25,000/yr can offset ordinary (W-2) income if you actively participate and your MAGI is under $100k (phasing out to $0 by $150k); unused losses carry forward. On sale, claimed depreciation is recaptured at up to 25%, and gains may owe capital-gains tax (a 1031 exchange can defer both). Figures are a year-1 estimate at your 24.0% rate — not tax advice; consult a CPA.
Schools (NCES district)
- District
- Fulton County
- NCES district ID
- 1302280
- Math proficiency
- 49% ▼ -2.00%
- Reading proficiency
- 53% ▬ 0.00%
- Median HH income
- $68,035
- Composite
- 45.33/100
- National rank
- #2640
- State rank
- #12 of 174 in GA
Livability — East Point
- Score
- 72/100
- State rank
- #72
- US rank
- #6314
Category grades
Schools grade is shown separately in the Schools card above.
Census & demographics
- Census place
- East Point, GA
- County
- Fulton County · 1,094,430 people
- City population
- 35,456
- Metro
- Atlanta-Sandy Springs-Alpharetta, GA
- Population (ZIP)
- 35,456
- Household income
- $68,380
- Rent vs Own
- Severe rent burden
- 2226.0
Population outlook (Fulton County) Hauer SSP2
- Today (2025)
- 1,203,707 people
- By 2030
- 1,299,706 · +8.0%
- By 2040
- 1,488,256 · +23.6%
- By 2050
- 1,664,580 · +38.3%
- By 2075
- 2,036,072 · +69.2%
- By 2100
- 2,222,402 · +84.6%
Race, ethnicity, and origin ACS 2023
- Neighborhood character
- Predominantly Black (74%)
- Race & ethnicity
- Black 74% White 11% Hispanic / Latino 11% Two or more races 6%
- Hispanic origin (detail)
- Mexican 7% Puerto Rican 1%
- Common ancestry
- Italian 1% Swiss 1% Russian 1%
- Foreign-born
- 6% · Canada, Jamaica
- Languages at home
- 87% English-only · Spanish 9% Other Indo-European 1% German/W. Germanic 1%
Political lean MEDSL · Fulton
- 2024 margin
- Solid D (+44.9) · D 71.9% · R 27.0% · Other 1.1%
- 2008→2024 swing
- +9.8pp toward D · 2008: 35.0pp · 2024: 44.9pp
- All cycles
- 2024: D+44.9 2020: D+46.4 2016: D+42.1 2012: D+29.6 2008: D+35.0
Not yet ingested
- Civics
- —
Market trends
- HPI YoY
- ▼ -113.15%
- Current HPI
- 251.7916
- Rent YoY
- ▲ 1.35%
- Metro
- Atlanta-Sandy Springs-Alpharetta, GA
- State GDP YoY
- ▲ 2.66%
- F500 in state
- 28
Industry mix (Fortune 500 HQ in GA)
| Industry | F500 HQs | Revenue |
|---|---|---|
| Paper / Packaging | 2 | $29B |
|
||
| Retail | 1 | $160B |
|
||
| Transportation / Logistics | 1 | $91B |
|
||
| Airlines | 1 | $62B |
|
||
| Consumer Goods | 1 | $47B |
|
||
| Utilities | 1 | $25B |
|
||
Price history
+223.6% since first listed9 events — show timeline
- 2026-05-22 Listed $178,000 FMLS
- 2026-05-22 Listed $178,000 GAMLS
- 2026-05-15 Coming Soon $178,000 GAMLS
- 2026-05-15 Coming Soon $178,000 FMLS
- 2011-12-12 Sold (Public Records) $69,000 Public Records
- 2005-08-24 Sold (Public Records) $91,000 Public Records
- 2005-07-01 Sold (Public Records) $82,500 Public Records
- 2001-07-19 Sold (Public Records) $93,000 Public Records
- 1986-02-26 Sold (Public Records) $55,000 Public Records
Property tax history
+3.8%/yrLatest (2025): $2,839 · +2.3% YoY. Source: county tax records.
Cash-flow waterfall
monthlySold comps — $/sqft
last 12 mo · ≤1 miLoading sold comps…