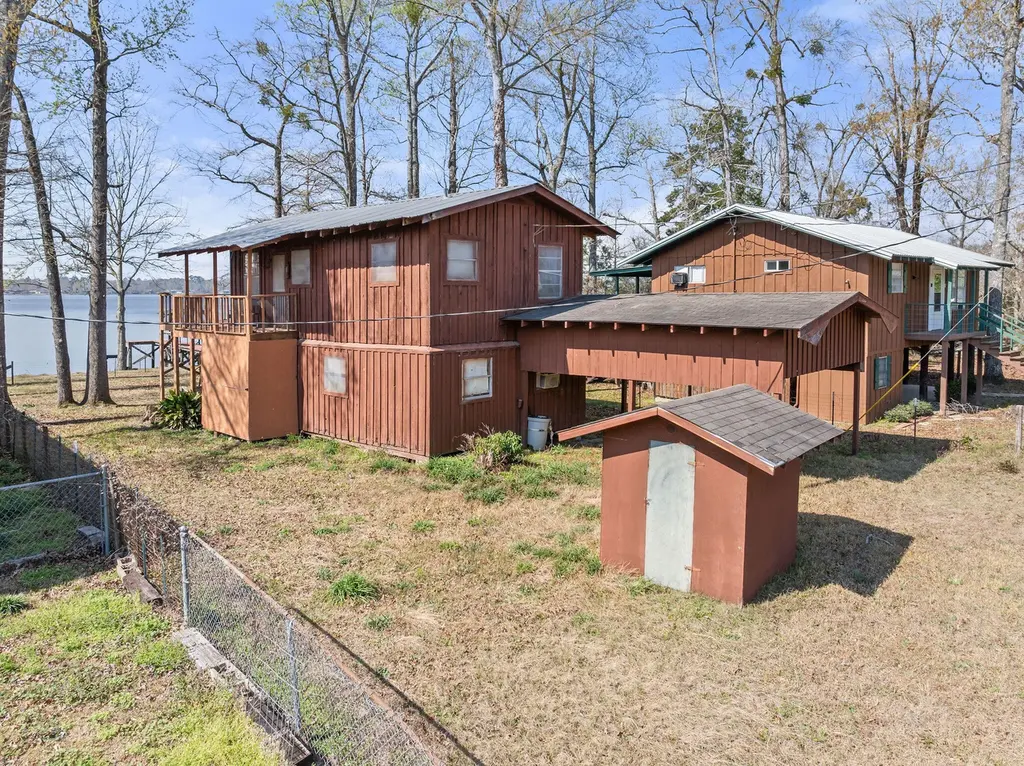
283 Lake Loop · Sugartown, LA
Flood risk 7/10 · Major
- FEMA flood zone
- A
- Chance of flooding over 30 yrs
- 0.77%
- Est. flood insurance / yr
- $1,009 – $1,996
Fire risk 6/10 · Moderate
- Est. fire insurance / yr
- $1,269 – $2,357
Heat risk 8/10 · Major
- Hot days now (above 110°F)
- 7 days/yr
- Hot days in 30 yrs
- 20 days/yr
Wind risk 9/10 · Severe
- Chance of severe wind over 30 yrs
- 99.0%
Air-quality risk 2/10 · Minimal
- Unhealthy air days now
- 1 days/yr
- Unhealthy air days in 30 yrs
- 1 days/yr
Risk factors via First Street. Map © Google.
Why this score? — see what drove the C- grade
The composite is a weighted blend of 9 inputs, each scored 0–100. Each bar is that input's sub-score; the figure is the points it added to the 100-point composite (weight × sub-score).
- Cash flow +19.5/30.0
- ARV discount +9.8/15.0
- DSCR +6.2/10.0
- 1% rule +5.2/10.0
- Schools +3.0/10.0
- Rent growth +2.5/5.0
- Condition / age +2.2/5.0
- Livability +2.1/5.0
- Appreciation +0.0/10.0
$115,900
🖨 Deal sheet (PDF) 📄 Offer letter ✓ Due diligence
Listing remarks MLS
Wake up to peaceful waterfront living in this 3 bed, 2 bath two-story lake home on Bundick Lake! Enjoy stunning views from the spacious second-story deck overlooking the water. Property features a concrete bulkhead, private pier, and fishing dock--perfect for early morning casts and sunset evenings. Shaded lot offers comfort and privacy, plus covered parking and a well-maintained fenced in yard. Outdoor lovers will appreciate the nearby park within walking distance. Your ideal lake retreat awaits!
Key facts
- 6,970 sq ft lot
- Listed 110 days
Neighborhood map
What this means for you Summary
Snapshot
- This is a 3-bed/2.0-bath single-family listed at $116k. Condition is rated fair.
Deal economics
- At list price, monthly cash flow is $6 ($78/yr) — positive.
- The deal already cash-flows at list — no discount required.
- Meets the 1% rule at list price ($1k rent vs $116k).
- Recommended offer: $105k (9.0% below list) — sets the bar for market timing.
Location & tenants
- Location reads 41/100 on livability (#464 in LA) — a working-class tenant base; expect higher turnover. Strengths: cost of living A+, crime A; Watch: health & safety C-, amenities F, commute F.
- Beauregard Parish (rural): math 30% / reading 41% proficiency, ranked #32 of 98 in LA (top 33%) — families likely to look elsewhere, expect single-tenant / working-renter base with shorter leases.
- Zoned schools: East Beauregard Elementary School (math 27% / reading 32%, grade F, #333 of 646 statewide, top 54%, 428 students, 71% FRL) — zoned schools average 71% FRL vs 46% district-wide (26 pts higher); higher-poverty schools than district average — tighter screening recommended.
- Market conditions: 243 active listings in the ZIP; 83 units permitted in Beauregard Parish in 2024 (0 in 5+ unit buildings).
Forward outlook
- Local home prices are declining (-3.0%/yr); year-one equity from $801 of loan paydown is wiped out by about $3k of value loss. Plan a longer hold.
Negotiation context
- It's been on market 110 days — a 9% lower offer ($105k) is reasonable based on typical stale-listing flexibility.
Risks & watch-outs
- Watch-outs: flood insurance adds $125/mo.
- Climate carrying-cost: in FEMA flood zone A (mandatory federal flood insurance); severe wind risk, 99% chance of damaging wind over 30y; major wildfire risk; extreme-heat days projected 7→20/yr by 2055 (HVAC capex compounding) — expect insurance premiums to compound above CPI over the hold.
Questions for the listing agent
- It's been on market 110 days. Have you received any prior offers? Is the seller open to a 9% concession, seller financing, or rate buy-down credit?
- Have any recent inspections been done? Can we get a copy of the seller's disclosures and any deferred-maintenance estimates?
- What's the actual annual flood-insurance premium (NFIP or private), and is the property in a SFHA with mandatory coverage?
- Why hasn't it sold? Are there any deal-killer items the seller is aware of (foundation, flood, title, zoning, code violations)?
- Is there a deadline driving the sale (1031 exchange, divorce, estate, relocation)? That informs how much negotiation room exists.
- Schools are F-rated, which usually means shorter tenancies and higher turnover. Who's the typical renter profile here, and what's been the actual vacancy rate?
- What's the average days-on-market for RENTAL listings here right now (not sales)? A rising rental-DOM trend means longer vacancies and softer asking-rent achievability than the comps imply.
- What's the recent tenant-quality profile in this submarket — average credit score on applications, eviction rate, late-payment / NSF rate, and stable-employment percentage? A property-management company in the area should have these aggregated.
- How much new for-sale + rental construction is in the pipeline within 1–3 miles? Heavy new supply typically softens prices + rents 12–24 months out; constrained supply supports both.
Investment metrics
- 1% rule
- 1.02% ✓
- Cap rate
- 7.66%
- Cash-on-cash
- 4.87%
- DSCR
- 1.22
- GRM
- 8.2
CMA / ARV
- ARV (median comp)
- $122,244
- List price
- $115,900
- Delta
- -5.19%
- Verdict
- FAIR
- Comps
- 2 within 1.0 mi
Show comp detail 1 sale within ~0.75 mi
| Address | Dist | Beds/Ba | Sqft | Sold | Price | $/sf | Match |
|---|---|---|---|---|---|---|---|
| 255 Harris Dr | 0.19mi | 2/2.5 (-1) | 936 (+13%) | 4mo | $137,610 | $147 | 59 |
Match score weights: distance 35% · size 25% · config 20% · recency 20%. Top-matched comps best support the ARV.
Projected returns pro-forma
-3.0% appreciation · 3.0% rent growth · sell at horizon
- IRR
- -15.8%
- Equity multiple
- 0.44×
- Total profit
- $-18,272
- Equity at exit
- $17,281
- IRR
- -7.2%
- Equity multiple
- 0.54×
- Total profit
- $-14,993
- Equity at exit
- $10,021
Cash invested: $32,452 (down + closing). Projections, not guarantees.
Landlord ↔ Tenant lean methodology
- Overall (STATE)
- 90 Strongly Landlord-Friendly
- State Louisiana
- 90 Strongly Landlord-Friendly · R+12
- County
- — inherits STATE
- City
- — inherits STATE
ZIP-level market 70634
- Home prices YoY
- -30.6%
- Active inventory
- 243
- Price-to-rent
- 8.2×
Monthly cashflow live
- Estimated rent
- $1,181 medium interval (Pro) →
- Mortgage (P&I)
- −$608
- Tax est. 1.5%
- −$145 /mo · $1,738/yr
- Insurance
- −$48
- Flood insurance flood zone
- −$125 /mo · $1,502/yr
- HOA
- −$0
- Vacancy / Maint / Mgmt
- −$248
- Net cashflow
- $6
Break-even live
Sensitivity live
| Price | -10% $87 | -5% $47 | +0% $6 | +5% $-34 | +10% $-74 |
|---|---|---|---|---|---|
| Rent | -10% $-87 | -5% $-40 | +0% $6 | +5% $53 | +10% $100 |
| Rate | -1.0pp $65 | -0.5pp $36 | base $6 | +0.5pp $-24 | +1.0pp $-54 |
UW: 25.0% down · 7.5% · 30yr · 1.5% tax · 5.0% vac · 8.0% maint · 8.0% mgmt
Financing live
Cash to close
- Down payment
- $28,975
- Closing costs
- $3,477
- Reserves months
- —
- Total cash needed
- —
Loan-product check · same deal, 3 products live
Conventional
25% down · 7.5% · 30yr
- Down + closing
- —
- Monthly P&I
- —
- Monthly cashflow
- —
- DSCR
- —
- Eligible?
- —
Personal DTI + credit; lowest rate.
DSCR
20% down · 8.5% · 30yr
- Down + closing
- —
- Monthly P&I
- —
- Monthly cashflow
- —
- DSCR
- —
- Eligible?
- —
No personal income docs; deal must DSCR.
Hard money
10% down · 12.0% · 12mo
- Down + closing
- —
- Monthly P&I
- —
- Monthly cashflow
- —
- DSCR
- —
- Eligible?
- —
Short-term bridge; refi at stabilization.
Listing history 18 events
-
2026-06-21days on market $115,900 Active 110 DOM
-
2026-06-19days on market $115,900 Active 108 DOM
-
2026-06-18days on market $115,900 Active 107 DOM
-
2026-06-17days on market $115,900 Active 106 DOM
-
2026-06-16days on market $115,900 Active 105 DOM
-
2026-06-15days on market $115,900 Active 104 DOM
-
2026-06-14days on market $115,900 Active 102 DOM
-
2026-06-13days on market $115,900 Active 101 DOM
-
2026-06-10days on market $115,900 Active 99 DOM
-
2026-06-09days on market $115,900 Active 98 DOM
-
2026-06-08days on market $115,900 Active 97 DOM
-
2026-06-07days on market $115,900 Active 96 DOM
-
2026-06-03days on market $115,900 Active 92 DOM
-
2026-06-02days on market $115,900 Active 91 DOM
-
2026-06-01days on market $115,900 Active 90 DOM
-
2026-05-31days on market $115,900 Active 89 DOM
-
2026-05-30days on market $115,900 Active 88 DOM
-
2026-03-03$115,900 Active 502-char remark
Show marketing remark (502 chars)
Wake up to peaceful waterfront living in this 3 bed, 2 bath two-story lake home on Bundick Lake! Enjoy stunning views from the spacious second-story deck overlooking the water. Property features a concrete bulkhead, private pier, and fishing dock--perfect for early morning casts and sunset evenings. Shaded lot offers comfort and privacy, plus covered parking and a well-maintained fenced in yard. Outdoor lovers will appreciate the nearby park within walking distance. Your ideal lake retreat awaits!
ⓘ Source: listings_history table (triggers on properties + properties_extension) + one-shot
backfill from property_details.listing_events for pre-trigger history.
Climate risk First Street
- Flood 7/10 Severe FEMA zone A · 77% chance over 30 yrs
- Wildfire 6/10 Major
- Heat 8/10 Severe 7 d/yr ≥110°F today · 20 d/yr by 30 yrs out
- Wind 9/10 Extreme 99% chance of damaging wind over 30 yrs
- Air quality 2/10 Low 1 unhealthy d/yr today · 1 by 30 yrs out
Nearby sold comps map
Loading sold comps map…
Walkable amenities ~0.75 mi
Loading nearby amenities…
Taxation est. · year 1
- Rental income
- $14,167
- − Mortgage interest
- −$6,492
- − Property taxes
- −$1,738
- − Insurance
- −$2,082
- − Repairs & maintenance
- −$1,133
- − Management
- −$1,133
- − Depreciation
- −$3,372
- Taxable loss
- −$1,784
- Est. tax savings @ 24.0%
- +$428
- After-tax cash flow
- $506/yr
For passive investors: Depreciation is non-cash, so a rental often shows a tax loss while cash-flowing — sheltering income. Rental losses are passive: they offset passive income freely, and up to $25,000/yr can offset ordinary (W-2) income if you actively participate and your MAGI is under $100k (phasing out to $0 by $150k); unused losses carry forward. On sale, claimed depreciation is recaptured at up to 25%, and gains may owe capital-gains tax (a 1031 exchange can defer both). Figures are a year-1 estimate at your 24.0% rate — not tax advice; consult a CPA.
Condition & rehab AI · 14 photos
This lakefront property requires moderate renovations to improve its condition and appeal to buyers. Key areas for improvement include the kitchen, bathrooms, exterior, and landscaping.
Repairs flagged
- Major Kitchen appliances — Older appliances need replacement for functionality and aesthetics.
- Major Bathroom fixtures — Older fixtures need replacement for functionality and aesthetics.
- Moderate Exterior siding — Weathered siding needs repainting or replacement for appearance.
- Major Landscaping — Overgrown and unkempt landscaping needs trimming and planting.
Value-add opportunities
- Resale Replace kitchen appliances and cabinetry — Modern appliances and updated cabinetry will attract more buyers.
- Resale Replace bathroom fixtures and tile — Modern fixtures and updated tile will attract more buyers.
- Resale Paint exterior siding and trim — Fresh paint will improve curb appeal and home value.
- Both Landscaping and yard maintenance — A well-maintained yard will attract buyers and renters alike.
Renovation cost estimate screening
| Repair item | Severity | Est. cost |
|---|---|---|
| Kitchen appliances · Older appliances need replacement for functionality and aesthetics. | Major | $15,000–50,000 |
| Bathroom fixtures · Older fixtures need replacement for functionality and aesthetics. | Major | $15,000–50,000 |
| Exterior siding · Weathered siding needs repainting or replacement for appearance. | Moderate | $3,000–15,000 |
| Landscaping · Overgrown and unkempt landscaping needs trimming and planting. | Major | $15,000–50,000 |
| Total estimated repair cost · 4 items | $48,000–165,000 |
Value-add ROI direction
- Resale Replace kitchen appliances and cabinetry — Modern appliances and updated cabinetry will attract more buyers. ↑
- Resale Replace bathroom fixtures and tile — Modern fixtures and updated tile will attract more buyers. ↑
- Resale Paint exterior siding and trim — Fresh paint will improve curb appeal and home value. ↑
- Both Landscaping and yard maintenance — A well-maintained yard will attract buyers and renters alike. ↑
ⓘ Cost ranges are severity-bucket heuristics (US national rule-of-thumb). Get contractor quotes + a written scope before underwriting a rehab budget.
Schools (NCES district)
- District
- Beauregard Parish
- NCES district ID
- 2200180
- Math proficiency
- 30% ▼ -40.00%
- Reading proficiency
- 41% ▼ -35.00%
- Median HH income
- $46,033
- Composite
- 30.34/100
- National rank
- #6265
- State rank
- #32 of 98 in LA
Livability — Sugartown
- Score
- 41/100
- State rank
- #464
- US rank
- #27212
Category grades
Schools grade is shown separately in the Schools card above.
Census & demographics
- Population (ZIP)
- 25,038
Population outlook (Beauregard County) Hauer SSP2
- Today (2025)
- 37,760 people
- By 2030
- 38,140 · +1.0%
- By 2040
- 38,518 · +2.0%
- By 2050
- 38,164 · +1.1%
- By 2075
- 36,437 · -3.5%
- By 2100
- 32,493 · -13.9%
Race, ethnicity, and origin ACS 2023
- Neighborhood character
- Predominantly White (72%)
- Race & ethnicity
- White 72% Black 14% Two or more races 9% Hispanic / Latino 5% Asian 1%
- Hispanic origin (detail)
- Mexican 3% Puerto Rican 1%
- Common ancestry
- Lithuanian 6% Slovak 1% Italian 1%
- Foreign-born
- 2% · Canada
- Languages at home
- 96% English-only · Spanish 2% French/Haitian/Cajun 1%
Political lean MEDSL · Beauregard
- 2024 margin
- Solid R (+71.3) · D 13.8% · R 85.1% · Other 1.1%
- 2008→2024 swing
- -16.9pp toward R · 2008: -54.3pp · 2024: -71.3pp
- All cycles
- 2024: R+71.3 2020: R+67.5 2016: R+65.3 2012: R+58.2 2008: R+54.3
Not yet ingested
- Civics
- —
Market trends
- HPI YoY
- ▼ -57.61%
- Current HPI
- 130.4445
- Rent YoY
- —
- Metro
- —
- State GDP YoY
- ▲ 3.29%
- F500 in state
- 10
Industry mix (Fortune 500 HQ in LA)
| Industry | F500 HQs | Revenue |
|---|---|---|
| Telecommunications | 2 | $23B |
|
||
| Utilities | 1 | $12B |
|
||
| Wholesale / Distribution | 1 | $5B |
|
||
| Advertising | 1 | $2B |
|
||
Price history
1 event — show timeline
- 2026-03-03 Listed $115,900 GFPAR
Cash-flow waterfall
monthlySold comps — $/sqft
last 12 mo · ≤1 miLoading sold comps…