7501 Palm · Yucca Valley, CA
Flood risk 1/10 · Minimal
- FEMA flood zone
- A
- Chance of flooding over 30 yrs
- 0.0%
- Est. flood insurance / yr
- $1,009 – $1,996
Fire risk 5/10 · Moderate
- Est. fire insurance / yr
- $659 – $1,223
Heat risk 6/10 · Moderate
- Hot days now (above 97°F)
- 9 days/yr
- Hot days in 30 yrs
- 26 days/yr
Wind risk 1/10 · Minimal
- Chance of severe wind over 30 yrs
- —
Air-quality risk 7/10 · Major
- Unhealthy air days now
- 13 days/yr
- Unhealthy air days in 30 yrs
- 17 days/yr
Risk factors via First Street. Map © Google.
Why this score? — see what drove the D grade
The composite is a weighted blend of 9 inputs, each scored 0–100. Each bar is that input's sub-score; the figure is the points it added to the 100-point composite (weight × sub-score).
- Cash flow +15.0/30.0
- ARV discount +7.5/15.0
- 1% rule +5.0/10.0
- DSCR +5.0/10.0
- Rent growth +3.5/5.0
- Livability +3.0/5.0
- Condition / age +2.5/5.0
- Schools +2.2/10.0
- Appreciation +0.0/10.0
$42,500
🖨 Deal sheet 📄 Offer letter ✓ Due diligence
Listing remarks MLS
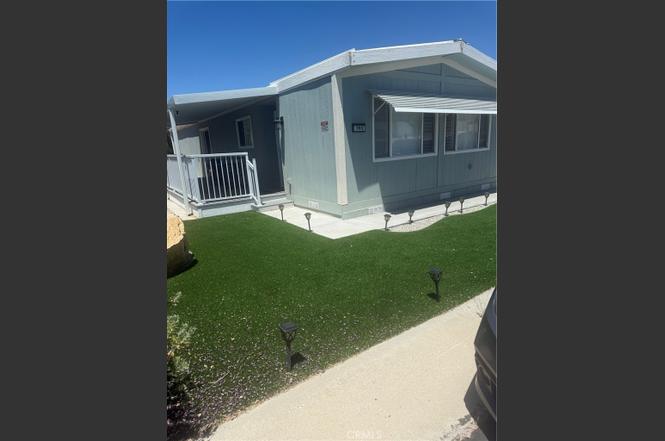
premier park in yucca valley close to 1600 sq ft 2 bdrm 1.75 bath roof is only 5 years old heat ac unit less than 1 year old, bonus rm this is a great deal on a very nice double wide 18,900 Single Pane Windows. Has skirting. Has carpet. Has dining room. Has kitchen.
Key facts
- 1,344 sq ft lot
- Community pool
- Built 1978
Property features AI
Finance
- Other: Park name: Gates of Spain
- HOA & community: Senior community; Land lease of $750 per month
Exterior
- Parking: Located in Gates of Spain park
- Utilities: District/public water; Public sewer and soils analysis septic
- Home design: Single-story; Entry on main level
- Construction: Mobile home remains on property; Year built per public records
- Exterior features: Community pool; Landscaped yard; Front yard and back yard; Park nearby; Curbs; Rural setting
Interior
- Bathrooms: 2 full bathrooms
- Heating & cooling: Central furnace heating
- Interior features: One-level home; Community spa
- Laundry & utility: Inside laundry room; Washer included; Dryer included
Neighborhood map
What this means for you Summary
Snapshot
- This is a 2-bed/2.0-bath land listed at $42k.
Deal economics
- At list price, monthly cash flow is $1k ($14k/yr) — positive.
- The deal already cash-flows at list — no discount required.
- Meets the 1% rule at list price ($2k rent vs $42k).
- Recommended offer: $41k (3.0% below list) — sets the bar for market timing.
- Cap rate 43.1% vs local median 3.6% in Yucca Valley — top-decile yield for the area; either an underpriced asset or a hidden risk that comps aren't pricing in. Stress-test before assuming the spread holds.
Location & tenants
- Location reads 60/100 on livability (#566 in CA) — a middle-class / working-renter tenant base. Strengths: commute A+, housing A+; Watch: cost of living D+, schools F, crime D-.
- Morongo Unified (town): math 15% / reading 38% proficiency, ranked #395 of 517 in CA (top 76%) — low school quality limits family demand, transient renter base, plan for 1-2y turnover.
- Market conditions: Rents rising fast (+4.1%/yr); 563 active listings in the ZIP; 18 comparable units currently listed for rent nearby; rentals lingering (median 44d on market — plan ~5-8 weeks vacancy on turnover, expect pricing pressure); 61% of comp listings sitting > 30 days — soft ceiling on asking rent; 5,458 units permitted in San Bernardino County in 2024 (1,500 in 5+ unit buildings).
- This rent runs 41% of the median local income ($58k/yr) — at the standard rent-burdened threshold; future hikes will face affordability resistance.
Forward outlook
- Local home prices are declining (-3.0%/yr); year-one equity from $294 of loan paydown is wiped out by about $1k of value loss. Plan a longer hold.
- San Bernardino County population projected at +15% by 2050 — modest demand growth; plan on rents tracking national, not racing it.
- At projected returns (-3.0% appreciation + 4.1% rent growth), your $12k cash investment doubles in ~1 year — after that, you're playing with house money.
Negotiation context
- It's been on market 33 days — a 3% lower offer ($41k) is reasonable based on typical stale-listing flexibility.
- 19 sale attempts since 17y ago with the ask held roughly flat each time — persistent listings suggest the price (not the market) is what's stuck; bring a comps-based counter.
Risks & watch-outs
- Watch-outs: flood insurance adds $125/mo.
- Climate carrying-cost: in FEMA flood zone A (mandatory federal flood insurance); moderate wildfire risk; extreme-heat days projected 9→26/yr by 2055 (HVAC capex compounding) — expect insurance premiums to compound above CPI over the hold.
Questions for the listing agent
- It's been on market 33 days. Have you received any prior offers? Is the seller open to a 3% concession, seller financing, or rate buy-down credit?
- Built in 1978 — when were the roof, HVAC, electrical panel, plumbing, and water heater last replaced?
- What's the actual annual flood-insurance premium (NFIP or private), and is the property in a SFHA with mandatory coverage?
- Is there a deadline driving the sale (1031 exchange, divorce, estate, relocation)? That informs how much negotiation room exists.
- Schools are F-rated, which usually means shorter tenancies and higher turnover. Who's the typical renter profile here, and what's been the actual vacancy rate?
- Crime grade is D in this area — have there been break-ins, vandalism, or insurance claims at this property in the last 3 years? What carrier currently insures it and at what premium?
- The area grade is low — what's the realistic commute time and amenity access for the typical tenant pool here? Any planned neighborhood developments (good or bad) we should know about?
- What's the average days-on-market for RENTAL listings here right now (not sales)? A rising rental-DOM trend means longer vacancies and softer asking-rent achievability than the comps imply.
- What's the recent tenant-quality profile in this submarket — average credit score on applications, eviction rate, late-payment / NSF rate, and stable-employment percentage? A property-management company in the area should have these aggregated.
- How much new for-sale + rental construction is in the pipeline within 1–3 miles? Heavy new supply typically softens prices + rents 12–24 months out; constrained supply supports both.
Investment metrics
- 1% rule
- 4.71% ✓
- Cap rate
- 43.10%
- Cash-on-cash
- 131.45%
- DSCR
- 6.85
- GRM
- 1.8
CMA / ARV
No comps found within radius.
Projected returns pro-forma
-3.0% appreciation · 4.12% rent growth · sell at horizon
- IRR
- —
- Equity multiple
- 6.93×
- Total profit
- $70,541
- Equity at exit
- $6,337
- IRR
- —
- Equity multiple
- 15.12×
- Total profit
- $168,040
- Equity at exit
- $3,675
Cash invested: $11,900 (down + closing). Projections, not guarantees.
Landlord ↔ Tenant lean methodology
- Overall (STATE)
- 18 Strongly Tenant-Friendly
- State California
- 18 Strongly Tenant-Friendly · D+13
- County
- — inherits STATE
- City
- — inherits STATE
ZIP-level market 92284
- Home prices YoY
- -33.1%
- Rents YoY
- 4.1%
- Active inventory
- 563
- Price-to-rent
- 1.8×
Monthly cashflow live
- Estimated rent
- $2,003 high interval (Pro) →
- Mortgage (P&I)
- −$223
- Tax from tax record
- −$38 /mo · $457/yr
- Insurance
- −$18
- Flood insurance flood zone
- −$125 /mo · $1,502/yr
- HOA
- −$0
- Vacancy / Maint / Mgmt
- −$421
- Net cashflow
- $1,178
Break-even live
UW: 25.0% down · 7.5% · 30yr · 1.5% tax · 5.0% vac · 8.0% maint · 8.0% mgmt
Financing live
Cash to close
- Down payment
- $10,625
- Closing costs
- $1,275
- Reserves months
- —
- Total cash needed
- —
Loan-product check · same deal, 3 products live
Conventional
25% down · 7.5% · 30yr
- Down + closing
- —
- Monthly P&I
- —
- Monthly cashflow
- —
- DSCR
- —
- Eligible?
- —
Personal DTI + credit; lowest rate.
DSCR
20% down · 8.5% · 30yr
- Down + closing
- —
- Monthly P&I
- —
- Monthly cashflow
- —
- DSCR
- —
- Eligible?
- —
No personal income docs; deal must DSCR.
Hard money
10% down · 12.0% · 12mo
- Down + closing
- —
- Monthly P&I
- —
- Monthly cashflow
- —
- DSCR
- —
- Eligible?
- —
Short-term bridge; refi at stabilization.
Rent comps 18 comps
| Address | Beds | Baths | Sqft | Rent | $/sqft | DOM | Units | Dist |
|---|---|---|---|---|---|---|---|---|
| 7448 Del Rio Vis Yucca Valley, CA | 3.0 | 4.0 | 1770 | $2,500 | $1.41 | 43d | 1 | 0.18mi |
| 7397 Village Way Yucca Valley, CA | 3.0 | 2.0 | 1501 | $2,000 | $1.33 | 43d | 1 | 0.18mi |
| 7496 Church St Yucca Valley, CA | 2.0 | 2.0 | 987 | $1,850 | $1.87 | 18d | 1 | 0.33mi |
| 7616 Apache Trl Yucca Valley, CA | 2.0 | 1.0 | 1008 | $1,900 | $1.88 | 43d | 1 | 0.62mi |
| 7028 Cholla Ave Yucca Valley, CA | 3.0 | 2.0 | 1200 | $1,895 | $1.58 | 5d | 1 | 0.68mi |
| 56594 Joshua Dr Yucca Valley, CA | 3.0 | 2.0 | 1307 | $2,250 | $1.72 | 43d | 1 | 0.75mi |
| 7154 Barberry Ave Unit A Yucca Valley, CA | 3.0 | 2.0 | 1100 | $2,049 | $1.86 | 18d | 1 | 0.75mi |
| 6963 Tamarisk Ave Yucca Valley, CA | 3.0 | 2.0 | 1200 | $1,500 | $1.25 | 18d | 1 | 0.76mi |
| 57004 Antelope Trl Yucca Valley, CA | 2.0 | 2.0 | 1143 | $2,050 | $1.79 | 43d | 1 | 0.79mi |
| 7453 Dumosa Ave Yucca Valley, CA | 3.0 | 2.0 | 1394 | $2,200 | $1.58 | 43d | 1 | 0.81mi |
| 55897 Santa Fe Trl Yucca Valley, CA | 3.0 | 2.0 | 1701 | $2,300 | $1.35 | 2d | 1 | 0.83mi |
| 56769 Joshua Dr Yucca Valley, CA | 1.0 | 1.0 | 1000 | $1,000 | $1.00 | 10d | 1 | 0.84mi |
| 56565 Sunnyslope Dr Yucca Valley, CA | 3.0 | 2.0 | 1000 | $1,800 | $1.80 | 43d | 1 | 0.85mi |
| 56615 Bonanza Dr Yucca Valley, CA | 2.0 | 1.5 | 1342 | $1,900 | $1.42 | 16d | 1 | 0.94mi |
| 7420 Geronimo Trl Yucca Valley, CA | 3.0 | 1.0 | 1280 | $1,700 | $1.33 | 43d | 1 | 1.11mi |
| 56811 Desert Gold Dr Yucca Valley, CA | 3.0 | 2.0 | 1375 | $2,095 | $1.52 | 43d | 1 | 1.14mi |
| 57472 Primrose Dr Unit 3 Yucca Valley, CA | 2.0 | 2.0 | 1020 | $1,600 | $1.57 | 43d | 1 | 1.28mi |
| 8523 Barberry Ave Yucca Valley, CA | 3.0 | 2.0 | 1448 | $3,325 | $2.30 | 43d | 1 | 1.46mi |
Listing history 50 events
-
2026-06-18days on market $42,500 Active 33 DOM
-
2026-06-17days on market $42,500 Active 32 DOM
-
2026-06-16days on market $42,500 Active 31 DOM
-
2026-06-15days on market $42,500 Active 30 DOM
-
2026-06-13days on market $42,500 Active 28 DOM
-
2026-06-13days on market $42,500 Active 27 DOM
-
2026-06-09days on market $42,500 Active 24 DOM
-
2026-06-08days on market $42,500 Active 23 DOM
-
2026-06-07days on market $42,500 Active 22 DOM
-
2026-06-04days on market $42,500 Active 19 DOM
-
2026-06-03days on market $42,500 Active 18 DOM
-
2026-06-02days on market $42,500 Active 17 DOM
-
2026-06-01days on market $42,500 Active 16 DOM
-
2026-05-31days on market $42,500 Active 15 DOM
-
2026-05-16$42,500 Active
-
2020-06-30soldstatus $8,000,000
-
2011-07-25historical
-
2011-07-19soldstatus $12,300 271-char remark
Show marketing remark (271 chars)
premier park in yucca valley close to 1600 sq ft 2 bdrm 1.75 bath roof is only 5 years old heat ac unit less than 1 year old, bonus rm this is a great deal on a very nice double wide 18,900 Single Pane Windows. Has skirting. Has carpet. Has dining room. Has kitchen.
-
2011-07-05$15,000
-
2011-07-01historical 271-char remark
Show marketing remark (271 chars)
premier park in yucca valley close to 1600 sq ft 2 bdrm 1.75 bath roof is only 5 years old heat ac unit less than 1 year old, bonus rm this is a great deal on a very nice double wide 18,900 Single Pane Windows. Has skirting. Has carpet. Has dining room. Has kitchen.
-
2011-07-01soldstatus $10,000
Show marketing remark (271 chars)
premier park in yucca valley close to 1600 sq ft 2 bdrm 1.75 bath roof is only 5 years old heat ac unit less than 1 year old, bonus rm this is a great deal on a very nice double wide 18,900 Single Pane Windows. Has skirting. Has carpet. Has dining room. Has kitchen.
-
2011-06-07historical
-
2011-05-10soldstatus $24,000
-
2011-05-02$18,900 271-char remark
Show marketing remark (271 chars)
premier park in yucca valley close to 1600 sq ft 2 bdrm 1.75 bath roof is only 5 years old heat ac unit less than 1 year old, bonus rm this is a great deal on a very nice double wide 18,900 Single Pane Windows. Has skirting. Has carpet. Has dining room. Has kitchen.
-
2011-04-15historical
-
2011-03-18soldstatus $25,000
-
2011-03-17soldstatus $16,000
-
2011-03-14soldstatus $15,000
-
2011-03-05historical
-
2011-02-16historical
-
2011-02-16historical
-
2011-01-13historical
-
2011-01-10$17,500
-
2011-01-08$27,900
-
2010-11-26soldstatus $15,900
-
2010-11-19soldstatus $40,000
-
2010-10-31historical
-
2010-10-28historical
-
2010-10-25historical
-
2010-10-21$10,000
-
2010-10-19historical
-
2010-09-24$18,000
-
2010-09-24$25,000
-
2010-09-18historical
-
2010-08-27$37,500
-
2010-08-21historical
-
2010-08-06soldstatus $30,000
-
2010-07-13$19,500
-
2010-07-12historical
-
2010-07-02historical
ⓘ Source: listings_history table (triggers on properties + properties_extension) + one-shot
backfill from property_details.listing_events for pre-trigger history.
Tax reassessment forecast CA · Resets to sale price
- Current annual tax
- $457 · $38/mo
- Projected year-2 tax
- $457 · $38/mo
- Expected delta
- $0/yr ($0/mo · 0.0%)
ⓘ Screening estimate from a state-policy table — verify with the county assessor before closing.
Climate risk First Street
- Flood 1/10 Low FEMA zone A · 0% chance over 30 yrs
- Wildfire 5/10 Major
- Heat 6/10 Major 9 d/yr ≥97°F today · 26 d/yr by 30 yrs out
- Wind 1/10 Low
- Air quality 7/10 Severe 13 unhealthy d/yr today · 17 by 30 yrs out
Nearby sold comps map
Loading sold comps map…
Walkable amenities ~0.75 mi
Loading nearby amenities…
Taxation est. · year 1
- Rental income
- $24,033
- − Mortgage interest
- −$2,381
- − Property taxes
- −$457
- − Insurance
- −$1,715
- − Repairs & maintenance
- −$1,923
- − Management
- −$1,923
- − Depreciation
- −$1,236
- Taxable income
- $14,399
- Est. tax owed @ 24.0%
- −$3,456
- After-tax cash flow
- $10,684/yr
For passive investors: Depreciation is non-cash, so a rental often shows a tax loss while cash-flowing — sheltering income. Rental losses are passive: they offset passive income freely, and up to $25,000/yr can offset ordinary (W-2) income if you actively participate and your MAGI is under $100k (phasing out to $0 by $150k); unused losses carry forward. On sale, claimed depreciation is recaptured at up to 25%, and gains may owe capital-gains tax (a 1031 exchange can defer both). Figures are a year-1 estimate at your 24.0% rate — not tax advice; consult a CPA.
Schools (NCES district)
- District
- Morongo Unified
- NCES district ID
- 0625860
- Math proficiency
- 15% ▼ -12.00%
- Reading proficiency
- 38% ▼ -3.00%
- Median HH income
- $39,399
- Composite
- 22.19/100
- National rank
- #8156
- State rank
- #395 of 517 in CA
Livability — Yucca Valley
- Score
- 60/100
- State rank
- #566
- US rank
- #18584
Category grades
Schools grade is shown separately in the Schools card above.
Census & demographics
- Census place
- Yucca Valley, CA
- County
- San Bernardino County · 2,030,291 people
- City population
- 25,415
- Metro
- Riverside-San Bernardino-Ontario, CA
- Population (ZIP)
- 25,415
- Household income
- $58,373
- Rent vs Own
- Severe rent burden
- 1132.0
Population outlook (San Bernardino County) Hauer SSP2
- Today (2025)
- 2,300,329 people
- By 2030
- 2,378,907 · +3.4%
- By 2040
- 2,523,137 · +9.7%
- By 2050
- 2,642,388 · +14.9%
- By 2075
- 2,880,769 · +25.2%
- By 2100
- 2,909,436 · +26.5%
Race, ethnicity, and origin ACS 2023
- Neighborhood character
- Diverse neighborhood (Simpson 0.55)
- Race & ethnicity
- White 62% Hispanic / Latino 25% Two or more races 18% Black 2% Native American 2% Asian 2% Pacific Islander 1%
- Hispanic origin (detail)
- Mexican 20%
- Common ancestry
- Italian 4% Romanian 2% Slovak 2%
- Foreign-born
- 9% · Canada
- Languages at home
- 82% English-only · Spanish 14% Other Indo-European 1% Other Asian/Pacific 1%
Political lean MEDSL · San Bernardino
- 2024 margin
- Toss-up / Even · D 47.5% · R 49.7% · Other 2.8%
- 2008→2024 swing
- -8.5pp toward R · 2008: 6.3pp · 2024: -2.1pp
- All cycles
- 2024: R+2.1 2020: D+10.7 2016: D+9.8 2012: D+5.4 2008: D+6.3
Not yet ingested
- Civics
- —
Market trends
- HPI YoY
- ▼ -241.13%
- Current HPI
- 486.7185
- Rent YoY
- ▲ 4.12%
- Metro
- Riverside-San Bernardino-Ontario, CA
- State GDP YoY
- ▲ 3.21%
- F500 in state
- 116
Industry mix (Fortune 500 HQ in CA)
| Industry | F500 HQs | Revenue |
|---|---|---|
| Technology | 27 | $1,492B |
|
||
| Financial Services | 3 | $174B |
|
||
| Retail | 3 | $44B |
|
||
| Insurance | 3 | $26B |
|
||
| Media / Entertainment | 2 | $115B |
|
||
| Pharmaceuticals / Biotech | 2 | $62B |
|
||
Price history
+325.0% since first listed58 events — show timeline
- 2026-05-16 Listed $42,500 CRMLS
- 2020-06-30 Sold (Public Records) $8,000,000 Public Records
- 2011-07-25 Listing Removed — CRMLS
- 2011-07-19 Sold (MLS) $12,300 CRMLS
- 2011-07-05 Listed $15,000 CRMLS
- 2011-07-01 Sold (MLS) $10,000 CRMLS
- 2011-07-01 Listing Removed — CRMLS
- 2011-06-07 Listing Removed — CRMLS
- 2011-05-10 Sold (MLS) $24,000 CRMLS
- 2011-05-02 Listed $18,900 CRMLS
- 2011-04-15 Listing Removed — CRMLS
- 2011-03-18 Sold (MLS) $25,000 CRMLS
- 2011-03-17 Sold (MLS) $16,000 CRMLS
- 2011-03-14 Sold (MLS) $15,000 CRMLS
- 2011-03-05 Listing Removed — CRMLS
- 2011-02-16 Listing Removed — CRMLS
- 2011-02-16 Listing Removed — CRMLS
- 2011-01-13 Listing Removed — CRMLS
- 2011-01-10 Listed $17,500 CRMLS
- 2011-01-08 Listed $27,900 CRMLS
- 2010-11-26 Sold (MLS) $15,900 CRMLS
- 2010-11-19 Sold (MLS) $40,000 CRMLS
- 2010-10-31 Listing Removed — CRMLS
- 2010-10-28 Listing Removed — CRMLS
- 2010-10-25 Listing Removed — CRMLS
- 2010-10-21 Listed $10,000 CRMLS
- 2010-10-19 Listing Removed — CRMLS
- 2010-09-24 Listed $25,000 CRMLS
- 2010-09-24 Listed $18,000 CRMLS
- 2010-09-18 Listing Removed — CRMLS
- 2010-08-27 Listed $37,500 CRMLS
- 2010-08-21 Listing Removed — CRMLS
- 2010-08-06 Sold (MLS) $30,000 CRMLS
- 2010-07-13 Listed $19,500 CRMLS
- 2010-07-12 Listing Removed — CRMLS
- 2010-07-02 Listing Removed — CRMLS
- 2010-06-08 Listed $34,500 CRMLS
- 2010-05-26 Listed $15,900 CRMLS
- 2010-04-26 Listed $19,500 CRMLS
- 2010-04-02 Sold (MLS) $25,500 CRMLS
- 2010-03-06 Listing Removed — CRMLS
- 2010-03-05 Sold (MLS) $24,000 CRMLS
- 2010-03-01 Listing Removed — CRMLS
- 2010-01-13 Listed $24,900 CRMLS
- 2009-11-12 Sold (MLS) $19,500 CRMLS
- 2009-11-08 Listing Removed — CRMLS
- 2009-10-18 Listing Removed — CRMLS
- 2009-10-15 Listed $27,500 CRMLS
- 2009-09-21 Listed $19,900 CRMLS
- 2009-09-20 Listed $25,000 CRMLS
- 2009-09-11 Sold (MLS) $14,000 CRMLS
- 2009-07-25 Listing Removed — CRMLS
- 2009-06-30 Sold (MLS) $14,000 CRMLS
- 2009-06-13 Listing Removed — CRMLS
- 2009-05-12 Listed $24,900 CRMLS
- 2009-05-11 Listed $21,500 CRMLS
- 1981-08-26 Sold (Public Records) $15,000 Public Records
- 1981-03-02 Sold (Public Records) $10,000 Public Records
Property tax history
+12.7%/yrLatest (2025): $457 · +0.8% YoY. Source: county tax records.
Cash-flow waterfall
monthlySold comps — $/sqft
last 12 mo · ≤1 miLoading sold comps…