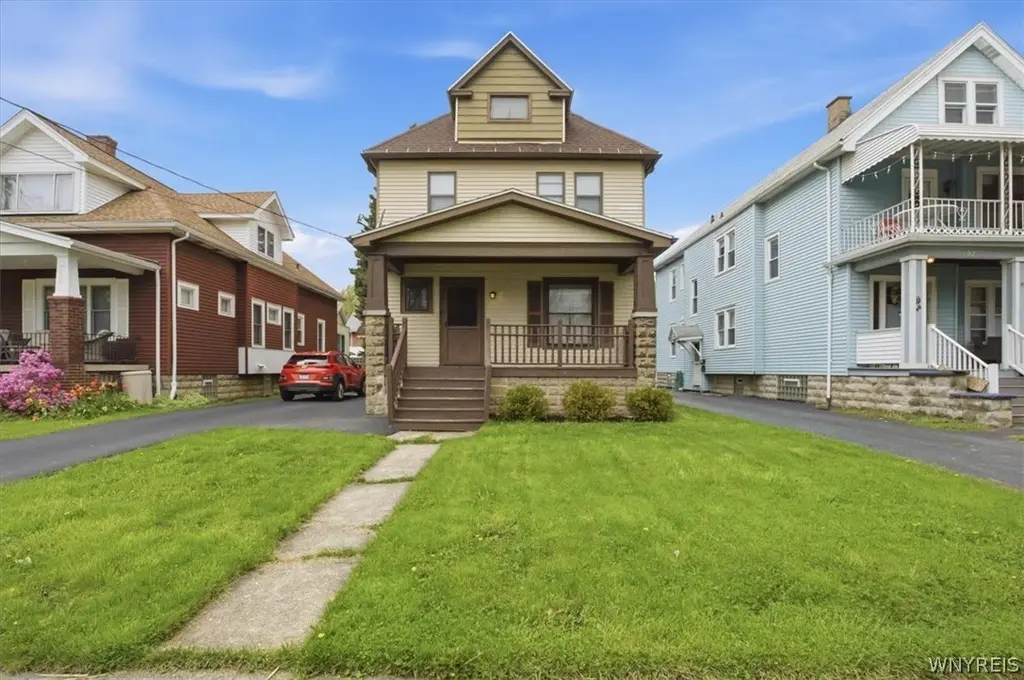
88 Alsace Ave · Buffalo, NY
Flood risk 4/10 · Minor
- FEMA flood zone
- X (unshaded)
- Chance of flooding over 30 yrs
- 0.22%
- Est. flood insurance / yr
- $473 – $860
Fire risk 1/10 · Minimal
- Est. fire insurance / yr
- $691 – $1,283
Heat risk 3/10 · Minor
- Hot days now (above 92°F)
- 7 days/yr
- Hot days in 30 yrs
- 15 days/yr
Wind risk 1/10 · Minimal
- Chance of severe wind over 30 yrs
- —
Air-quality risk 4/10 · Minor
- Unhealthy air days now
- 3 days/yr
- Unhealthy air days in 30 yrs
- 8 days/yr
Risk factors via First Street. Map © Google.
Why this score? — see what drove the D grade
The composite is a weighted blend of 9 inputs, each scored 0–100. Each bar is that input's sub-score; the figure is the points it added to the 100-point composite (weight × sub-score).
- ARV discount +13.8/15.0
- Cash flow +10.3/30.0
- Rent growth +4.4/5.0
- Livability +3.9/5.0
- Schools +3.3/10.0
- DSCR +3.0/10.0
- Condition / age +2.5/5.0
- 1% rule +1.8/10.0
- Appreciation +0.0/10.0
$244,900
🖨 Deal sheet 📄 Offer letter ✓ Due diligence
Listing remarks
Welcome home to this South Buffalo charmer steps away from Cazanovia Park! Large covered front porch, just in time to enjoy summer! Spacious freshly painted first floor with hardwoods throughout and tons of natural light. Plenty of room to spread out! Office space with fully remodeled half bath (2022) adjacent. Kitchen has a great layout with plenty of cabinet storage, as well as a charming butlers pantry and access to the rear deck. Four bedrooms upstairs with a generous size primary bedroom. Full bath has also been remodeled (2022). Large walk-up attic with endless possibilities! Driveway blacktop redone in 2024 (re sealed last year), newer roof, fully fenced yard. Located within the new
Key facts
- Covered front porch
- Blacktop driveway
- Butlers pantry
Tags
Property features AI
Finance
- HOA & community: Trails/paths nearby
Exterior
- Parking: No garage
- Utilities: Electricity connected (circuit breakers); Public water connected; Sewer connected; Cable available; High-speed internet available
- Home design: 2-story existing home; Aluminum siding; Block foundation; Resale property
- Construction: Aluminum siding construction; Block foundation
- Exterior features: Blacktop driveway; Deck; Covered and open porch; Fully fenced yard; Rectangular residential lot; Near public transit; City street frontage
Interior
- Kitchen: Dishwasher; Gas oven; Gas range; Refrigerator; Pantry / walk-in pantry
- Bedrooms: Bedroom 1 on second level; Bedroom 2 on second level; Bedroom 3 on second level; Bedroom 4 on second level; Additional room (other) on second level
- Flooring: Hardwood flooring; Laminate flooring; Varies
- Bathrooms: 1 full bathroom; 1 half bathroom; One main-level bathroom
- Heating & cooling: Gas forced-air heating; Window cooling units
- Interior features: Ceiling fan(s); Separate/formal living room; Combined living and dining area; Pantry / walk-in pantry; See remarks
- Laundry & utility: Gas water heater
Neighborhood map
What this means for you Summary
Snapshot
- This is a 4-bed/1.5-bath single-family listed at $245k.
Deal economics
- At list price, monthly cash flow is $-134 ($-2k/yr) — negative.
- To cash-flow at today's rent, offer at most $221k (9.6% below list).
- To meet the 1% rule (rent ≥ 1% of price), the offer needs to be $167k (32.0% below list).
- Recommended offer: $167k (32.0% below list) — sets the bar for 1% rule.
- Cap rate 5.6% vs local median 8.0% in Buffalo — below-typical yield; the buyer is paying a premium for something (appreciation thesis, condition, location) that the cap rate doesn't capture.
Location & tenants
- Location reads 77/100 on livability (#195 in NY, #3,011 nationally) — a middle-class / working-renter tenant base. Strengths: commute A+, housing A+, health & safety A+; Watch: crime F, employment D-.
- Buffalo City School District (urban): math 41% / reading 40% proficiency, ranked #535 of 590 in NY (top 91%) — families likely to look elsewhere, expect single-tenant / working-renter base with shorter leases; 75% free/reduced lunch — lower-income household profile, screen leases tightly.
- Market conditions: Rents rising fast (+7.6%/yr); 136 active listings in the ZIP; 2 comparable units currently listed for rent nearby; 1,244 units permitted in Erie County in 2024 (563 in 5+ unit buildings).
Forward outlook
- Local home prices are declining (-3.0%/yr); year-one equity from $2k of loan paydown is wiped out by about $7k of value loss. Plan a longer hold.
Negotiation context
- It's been on market 25 days — a 2% lower offer ($241k) is reasonable based on typical stale-listing flexibility.
Risks & watch-outs
- Watch-outs: built in 1910 — expect roof / HVAC / electrical / plumbing capex.
Questions for the listing agent
- What do current leases actually rent for vs. the listed asking? Can we see a recent rent roll and the last 12 months of T-12 income?
- Built in 1910 — when were the roof, HVAC, electrical panel, plumbing, and water heater last replaced?
- Is there a deadline driving the sale (1031 exchange, divorce, estate, relocation)? That informs how much negotiation room exists.
- Crime grade is F in this area — have there been break-ins, vandalism, or insurance claims at this property in the last 3 years? What carrier currently insures it and at what premium?
- The area grade is low — what's the realistic commute time and amenity access for the typical tenant pool here? Any planned neighborhood developments (good or bad) we should know about?
- What's the average days-on-market for RENTAL listings here right now (not sales)? A rising rental-DOM trend means longer vacancies and softer asking-rent achievability than the comps imply.
- What's the recent tenant-quality profile in this submarket — average credit score on applications, eviction rate, late-payment / NSF rate, and stable-employment percentage? A property-management company in the area should have these aggregated.
- How much new for-sale + rental construction is in the pipeline within 1–3 miles? Heavy new supply typically softens prices + rents 12–24 months out; constrained supply supports both.
Investment metrics
- 1% rule
- 0.68% ✗
- Cap rate
- 5.64%
- Cash-on-cash
- -2.34%
- DSCR
- 0.90
- GRM
- 12.3
CMA / ARV
- ARV (median comp)
- $284,804
- List price
- $244,900
- Delta
- -14.01%
- Verdict
- UNDERPRICED
- Comps
- 20 within 1.0 mi
Show comp detail 12 sales within ~0.75 mi
| Address | Dist | Beds/Ba | Sqft | Sold | Price | $/sf | Match |
|---|---|---|---|---|---|---|---|
| 64 Alsace Ave | 0.05mi | 4/1.5 | 1,824 (+3%) | 1mo | $360,000 | $197 | 92 |
| 1062 Tifft St | 0.26mi | 4/1.5 | 1,800 (+2%) | 0mo | $180,000 | $100 | 85 |
| 22 Cazenovia St | 0.16mi | 4/2.0 | 1,690 (-4%) | 3mo | $285,000 | $169 | 81 |
| 179 Columbus Ave | 0.10mi | 3/1.5 (-1) | 1,664 (-6%) | 2mo | $272,026 | $163 | 78 |
| 70 Alsace Ave | 0.04mi | 3/2.0 (-1) | 1,968 (+11%) | 1mo | $341,000 | $173 | 72 |
| 29 Allegany St | 0.58mi | 4/1.0 | 1,750 (-1%) | 2mo | $229,900 | $131 | 67 |
| 81 Como Ave | 0.29mi | 4/1.0 | 2,014 (+14%) | 3mo | $100,000 | $50 | 59 |
| 126 Lockwood Ave | 0.69mi | 5/1.5 (+1) | 1,809 (+2%) | 1mo | $220,300 | $122 | 59 |
| 53 Choate Ave | 0.43mi | 3/1.0 (-1) | 1,599 (-10%) | 1mo | $198,000 | $124 | 56 |
| 55 Princeton Pl | 0.45mi | 5/1.0 (+1) | 1,617 (-9%) | 2mo | $190,000 | $118 | 56 |
| 850 Abbott Rd | 0.59mi | 4/1.0 | 1,584 (-10%) | 4mo | $275,000 | $174 | 49 |
| 65 Hammerschmidt Ave | 0.72mi | 3/1.5 (-1) | 1,620 (-8%) | 1mo | $195,000 | $120 | 46 |
Match score weights: distance 35% · size 25% · config 20% · recency 20%. Top-matched comps best support the ARV.
Projected returns pro-forma
-3.0% appreciation · 7.62% rent growth · sell at horizon
- IRR
- -15.9%
- Equity multiple
- 0.41×
- Total profit
- $-40,219
- Equity at exit
- $36,515
- IRR
- -1.8%
- Equity multiple
- 0.86×
- Total profit
- $-9,908
- Equity at exit
- $21,174
Cash invested: $68,572 (down + closing). Projections, not guarantees.
Landlord ↔ Tenant lean methodology
- Overall (STATE)
- 15 Strongly Tenant-Friendly
- State New York
- 15 Strongly Tenant-Friendly · D+10
- County
- — inherits STATE
- City
- — inherits STATE
ZIP-level market 14220
- Home prices YoY
- -26.7%
- Rents YoY
- 7.6%
- Active inventory
- 136
- Price-to-rent
- 12.3×
Monthly cashflow live
- Estimated rent
- $1,665 medium interval (Pro) →
- Mortgage (P&I)
- −$1,284
- Tax from tax record
- −$63 /mo · $756/yr
- Insurance
- −$102
- HOA
- −$0
- Vacancy / Maint / Mgmt
- −$350
- Net cashflow
- $-134
Break-even live
UW: 25.0% down · 7.5% · 30yr · 1.5% tax · 5.0% vac · 8.0% maint · 8.0% mgmt
Financing live
Cash to close
- Down payment
- $61,225
- Closing costs
- $7,347
- Reserves months
- —
- Total cash needed
- —
Loan-product check · same deal, 3 products live
Conventional
25% down · 7.5% · 30yr
- Down + closing
- —
- Monthly P&I
- —
- Monthly cashflow
- —
- DSCR
- —
- Eligible?
- —
Personal DTI + credit; lowest rate.
DSCR
20% down · 8.5% · 30yr
- Down + closing
- —
- Monthly P&I
- —
- Monthly cashflow
- —
- DSCR
- —
- Eligible?
- —
No personal income docs; deal must DSCR.
Hard money
10% down · 12.0% · 12mo
- Down + closing
- —
- Monthly P&I
- —
- Monthly cashflow
- —
- DSCR
- —
- Eligible?
- —
Short-term bridge; refi at stabilization.
Rent comps 2 comps
| Address | Beds | Baths | Sqft | Rent | $/sqft | DOM | Units | Dist |
|---|---|---|---|---|---|---|---|---|
| 74 Woodside Ave Unit 1 Buffalo, NY | 3.0 | 1.0 | 1250 | $1,510 | $1.21 | 1d | 1 | 0.49mi |
| 89 Macamley St #2 Buffalo, NY | 3.0 | 1.0 | 1274 | $1,100 | $0.86 | 10d | 1 | 0.68mi |
Listing history 3 events
-
2026-06-01statusdays on market $244,900 Pending 25 DOM
-
2026-05-31days on market $244,900 Active 24 DOM
-
2026-05-07$244,900 Active 844-char remark
ⓘ Source: listings_history table (triggers on properties + properties_extension) + one-shot
backfill from property_details.listing_events for pre-trigger history.
Tax reassessment forecast NY · Partial reset (capped growth)
- Current annual tax
- $756 · $63/mo
- Projected year-2 tax
- $2,448 · $204/mo
- Expected delta
- +$1,691/yr (+$141/mo · 223.6%)
ⓘ Screening estimate from a state-policy table — verify with the county assessor before closing.
Climate risk First Street
- Flood 4/10 Moderate FEMA zone X (unshaded) · 22% chance over 30 yrs
- Wildfire 1/10 Low
- Heat 3/10 Moderate 7 d/yr ≥92°F today · 15 d/yr by 30 yrs out
- Wind 1/10 Low
- Air quality 4/10 Moderate 3 unhealthy d/yr today · 8 by 30 yrs out
Nearby sold comps map
Loading sold comps map…
Walkable amenities ~0.75 mi
Loading nearby amenities…
Taxation est. · year 1
- Rental income
- $19,985
- − Mortgage interest
- −$13,718
- − Property taxes
- −$756
- − Insurance
- −$1,224
- − Repairs & maintenance
- −$1,599
- − Management
- −$1,599
- − Depreciation
- −$7,124
- Taxable loss
- −$6,036
- Est. tax savings @ 24.0%
- +$1,449
- After-tax cash flow
- $-155/yr
For passive investors: Depreciation is non-cash, so a rental often shows a tax loss while cash-flowing — sheltering income. Rental losses are passive: they offset passive income freely, and up to $25,000/yr can offset ordinary (W-2) income if you actively participate and your MAGI is under $100k (phasing out to $0 by $150k); unused losses carry forward. On sale, claimed depreciation is recaptured at up to 25%, and gains may owe capital-gains tax (a 1031 exchange can defer both). Figures are a year-1 estimate at your 24.0% rate — not tax advice; consult a CPA.
Schools (NCES district)
- District
- Buffalo City School District
- NCES district ID
- 3605850
- Math proficiency
- 41% ▲ 11.00%
- Reading proficiency
- 40% ▲ 7.00%
- Median HH income
- $31,665
- Composite
- 33.17/100
- National rank
- #5544
- State rank
- #535 of 590 in NY
Livability — Buffalo
- Score
- 77/100
- State rank
- #195
- US rank
- #3011
Category grades
Schools grade is shown separately in the Schools card above.
Census & demographics
- Census place
- Buffalo, NY
- County
- Erie County · 714,559 people
- City population
- 440,021
- Metro
- Buffalo-Cheektowaga, NY
- Population (ZIP)
- 24,428
- Household income
- $70,963
- Rent vs Own
- Severe rent burden
- 602.0
Population outlook (Erie County) Hauer SSP2
- Today (2025)
- 933,037 people
- By 2030
- 935,181 · +0.2%
- By 2040
- 928,531 · -0.5%
- By 2050
- 905,725 · -2.9%
- By 2075
- 834,037 · -10.6%
- By 2100
- 708,033 · -24.1%
Race, ethnicity, and origin ACS 2023
- Neighborhood character
- Predominantly White (76%)
- Race & ethnicity
- White 76% Hispanic / Latino 13% Two or more races 6% Black 5% Asian 2%
- Hispanic origin (detail)
- Puerto Rican 10% Cuban 1%
- Common ancestry
- Romanian 16% Lithuanian 1% Subsaharan African 1%
- Foreign-born
- 4% · Canada, Jamaica, China
- Languages at home
- 90% English-only · Spanish 4% Chinese 1%
Political lean MEDSL · Erie
- 2024 margin
- Lean D (+9.7) · D 54.8% · R 45.2%
- 2008→2024 swing
- -7.9pp toward R · 2008: 17.5pp · 2024: 9.7pp
- All cycles
- 2024: D+9.7 2020: D+14.7 2016: D+4.8 2012: D+15.6 2008: D+17.5
Not yet ingested
- Civics
- —
Market trends
- HPI YoY
- ▼ -146.29%
- Current HPI
- 402.5053
- Rent YoY
- ▲ 7.62%
- Metro
- Buffalo-Cheektowaga, NY
- State GDP YoY
- ▲ 2.60%
- F500 in state
- 92
Industry mix (Fortune 500 HQ in NY)
| Industry | F500 HQs | Revenue |
|---|---|---|
| Financial Services | 10 | $950B |
|
||
| Consumer Goods | 9 | $162B |
|
||
| Insurance | 4 | $225B |
|
||
| Telecommunications | 2 | $144B |
|
||
| Pharmaceuticals | 2 | $112B |
|
||
| Media / Entertainment | 2 | $69B |
|
||
Price history
2 events — show timeline
- 2026-06-01 Pending — WNYREIS
- 2026-05-07 Listed $244,900 WNYREIS
Property tax history
+5.1%/yrLatest (2025): $756 · -0.1% YoY. Source: county tax records.
Cash-flow waterfall
monthlySold comps — $/sqft
last 12 mo · ≤1 miLoading sold comps…