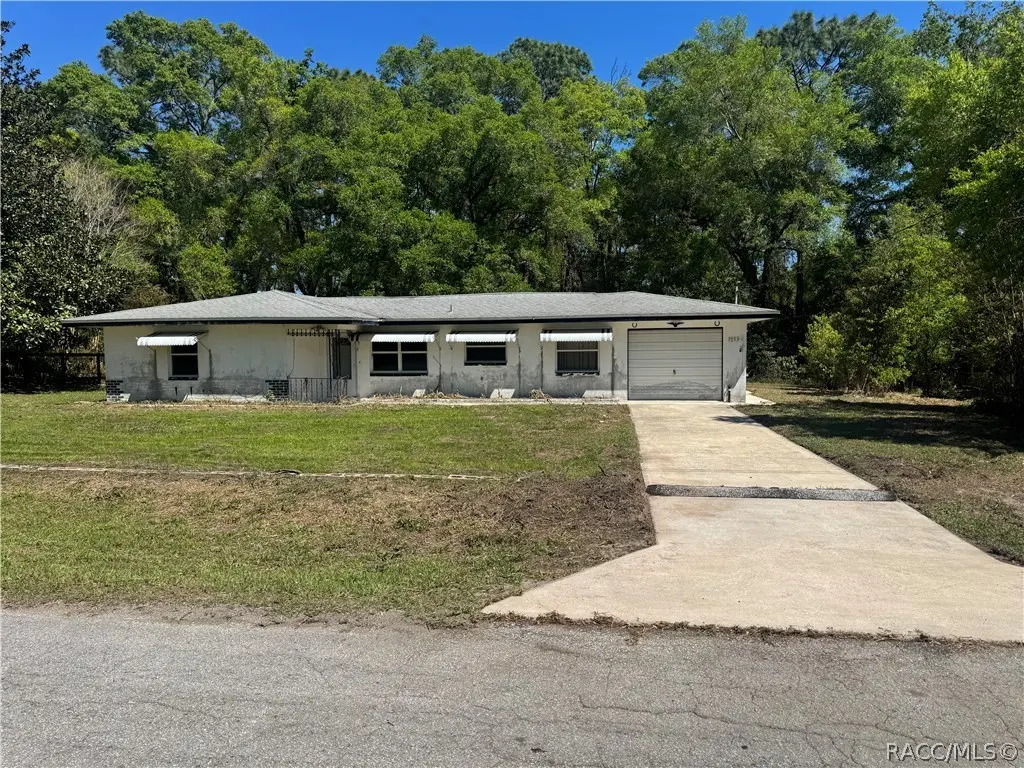
3953 S Fernpark Ter · Inverness Highlands South, FL
Flood risk 1/10 · Minimal
- FEMA flood zone
- X (unshaded)
- Chance of flooding over 30 yrs
- 0.0%
- Est. flood insurance / yr
- $507 – $1,088
Fire risk 4/10 · Minor
- Est. fire insurance / yr
- $947 – $1,759
Heat risk 9/10 · Severe
- Hot days now (above 108°F)
- 7 days/yr
- Hot days in 30 yrs
- 23 days/yr
Wind risk 9/10 · Severe
- Chance of severe wind over 30 yrs
- 99.0%
Air-quality risk 1/10 · Minimal
- Unhealthy air days now
- 0 days/yr
- Unhealthy air days in 30 yrs
- 0 days/yr
Risk factors via First Street. Map © Google.
Why this score? — see what drove the D- grade
The composite is a weighted blend of 9 inputs, each scored 0–100. Each bar is that input's sub-score; the figure is the points it added to the 100-point composite (weight × sub-score).
- Cash flow +12.7/30.0
- ARV discount +5.8/15.0
- Schools +4.1/10.0
- DSCR +3.8/10.0
- Livability +3.4/5.0
- Rent growth +2.5/5.0
- Condition / age +2.5/5.0
- 1% rule +2.3/10.0
- Appreciation +0.0/10.0
$200,000
🖨 Deal sheet 📄 Offer letter ✓ Due diligence
Listing remarks
This charming 2-bedroom, 2-bath home sits right next to Holden Park—enjoy easy access to a playground, soccer fields, and basketball courts just steps from your door. You’re also just minutes from downtown Inverness, where local favorites like Coach's Pub & Eatery, Chipotle, Chili's, and Stumpknockers offer dining and nightlife options for every taste. Conveniently near Inverness Primary School, Inverness Middle School, and Citrus High School, the location checks all the boxes. Inside, you’ll find a solid layout with an attached garage and a bonus shed for extra storage. With just minor updates needed, this home is the perfect canvas to add your personal style. Wheth
Key facts
- Attached garage
- Extra storage
- Bonus shed
Tags
Property features AI
Exterior
- Parking: Attached garage (1 car); Paved driveway
- Utilities: Private well water; Septic tank sewer
- Home design: Single family residence; One story; Stucco exterior
- Construction: Built on block and slab foundation; Asphalt shingle roof; Stucco construction
- Exterior features: Level, rectangular lot; Publicly maintained paved city street frontage; Shed on the property; No pool
Interior
- Kitchen: Oven; Dishwasher; Electric cooktop; Microwave; Refrigerator; Water heater
- Flooring: Concrete
- Bathrooms: 2 full bathrooms
- Heating & cooling: Central heating (electric); Central air conditioning
- Interior features: Laminate counters; Concrete flooring
- Laundry & utility: Washer; Laundry located in the garage
Neighborhood map
What this means for you Summary
Snapshot
- This is a 2-bed/2.0-bath single-family listed at $200k.
Deal economics
- At list price, monthly cash flow is $-21 ($-254/yr) — negative.
- To cash-flow at today's rent, offer at most $196k (1.9% below list).
- To meet the 1% rule (rent ≥ 1% of price), the offer needs to be $147k (26.6% below list).
- Recommended offer: $147k (26.6% below list) — sets the bar for 1% rule.
- Cap rate 6.2% vs local median 5.0% in Inverness Highlands South — meaningfully above typical; check what's discounted (condition, days-on-market, listing class) to confirm the premium yield is real.
Location & tenants
- Location reads 68/100 on livability (#508 in FL) — a middle-class / working-renter tenant base. Strengths: cost of living A+, housing A+, crime B; Watch: employment C-, health & safety C-, amenities F.
- Citrus (rural): math 49% / reading 50% proficiency, ranked #44 of 73 in FL (top 60%) — families likely to look elsewhere, expect single-tenant / working-renter base with shorter leases.
- Zoned schools: Inverness Primary School (math 54% / reading 55%, grade C, #892 of 2,144 statewide, top 44%, 683 students, 65% FRL); Inverness Middle School (math 52% / reading 48%, grade C, #254 of 571 statewide, top 45%, 1,017 students, 60% FRL); Citrus High School (math 34% / reading 51%, grade F, #264 of 667 statewide, top 41%, 1,503 students, 54% FRL) — zoned schools at 60% FRL track the district average.
- Market conditions: 260 active listings in the ZIP; 2,443 units permitted in Citrus County in 2024 (0 in 5+ unit buildings).
Forward outlook
- Local home prices are declining (-3.0%/yr); year-one equity from $1k of loan paydown is wiped out by about $6k of value loss. Plan a longer hold.
- Citrus County population projected to shrink 10% by 2050 — rents likely to lag national; underwrite the cash flow, not the appreciation.
Negotiation context
- It's been on market 88 days — a 6% lower offer ($188k) is reasonable based on typical stale-listing flexibility.
- Current owner paid $45k; list at $200k implies a 344% gain — meaningful room to come down on a strong offer.
Risks & watch-outs
- Climate carrying-cost: severe wind risk, 99% chance of damaging wind over 30y; extreme-heat days projected 7→23/yr by 2055 (HVAC capex compounding) — expect insurance premiums to compound above CPI over the hold.
Questions for the listing agent
- What do current leases actually rent for vs. the listed asking? Can we see a recent rent roll and the last 12 months of T-12 income?
- It's been on market 88 days. Have you received any prior offers? Is the seller open to a 27% concession, seller financing, or rate buy-down credit?
- Built in 1972 — when were the roof, HVAC, electrical panel, plumbing, and water heater last replaced?
- Why hasn't it sold? Are there any deal-killer items the seller is aware of (foundation, flood, title, zoning, code violations)?
- Is there a deadline driving the sale (1031 exchange, divorce, estate, relocation)? That informs how much negotiation room exists.
- Schools are F-rated, which usually means shorter tenancies and higher turnover. Who's the typical renter profile here, and what's been the actual vacancy rate?
- The area grade is low — what's the realistic commute time and amenity access for the typical tenant pool here? Any planned neighborhood developments (good or bad) we should know about?
- What's the average days-on-market for RENTAL listings here right now (not sales)? A rising rental-DOM trend means longer vacancies and softer asking-rent achievability than the comps imply.
- What's the recent tenant-quality profile in this submarket — average credit score on applications, eviction rate, late-payment / NSF rate, and stable-employment percentage? A property-management company in the area should have these aggregated.
- How much new for-sale + rental construction is in the pipeline within 1–3 miles? Heavy new supply typically softens prices + rents 12–24 months out; constrained supply supports both.
Investment metrics
- 1% rule
- 0.73% ✗
- Cap rate
- 6.17%
- Cash-on-cash
- -0.45%
- DSCR
- 0.98
- GRM
- 11.3
CMA / ARV
- ARV (on-the-fly)
- $192,608
- Comps found
- 12
Show comp detail 12 sales within ~0.75 mi
| Address | Dist | Beds/Ba | Sqft | Sold | Price | $/sf | Match |
|---|---|---|---|---|---|---|---|
| 6343 E Gurley St | 0.17mi | 2/1.0 | 933 (+1%) | 4mo | $220,000 | $236 | 84 |
| 6589 E Harold Ln | 0.25mi | 2/1.0 | 953 (+3%) | 4mo | $147,000 | $154 | 76 |
| 4058 S Floral Ter | 0.36mi | 2/2.0 | 911 (-2%) | 9mo | $189,900 | $208 | 73 |
| 3880 S Floral Ter | 0.35mi | 2/2.0 | 908 (-2%) | 9mo | $198,900 | $219 | 73 |
| 6107 E Elgin Ln | 0.31mi | 2/1.0 | 946 (+2%) | 10mo | $199,000 | $210 | 70 |
| 6157 E Glencoe St | 0.44mi | 2/1.5 | 926 (0%) | 12mo | $185,000 | $200 | 67 |
| 3461 S College Ave | 0.54mi | 2/1.0 | 926 (0%) | 5mo | $175,000 | $189 | 67 |
| 6141 E Glencoe St | 0.45mi | 2/2.0 | 1,008 (+9%) | 2mo | $207,500 | $206 | 63 |
| 6700 E Gentry St | 0.47mi | 2/1.0 | 865 (-7%) | 2mo | $110,500 | $128 | 62 |
| 6162 E Oneida St | 0.55mi | 2/2.0 | 1,008 (+9%) | 5mo | $229,000 | $227 | 55 |
| 6396 E Oneida St | 0.51mi | 2/2.0 | 984 (+6%) | 13mo | $220,000 | $224 | 55 |
| 3957 S Ventura Ave | 0.44mi | 3/2.0 (+1) | 1,025 (+11%) | 12mo | $175,000 | $171 | 47 |
Match score weights: distance 35% · size 25% · config 20% · recency 20%. Top-matched comps best support the ARV.
Projected returns pro-forma
-3.0% appreciation · 3.0% rent growth · sell at horizon
- IRR
- -17.1%
- Equity multiple
- 0.40×
- Total profit
- $-33,857
- Equity at exit
- $29,821
- IRR
- -9.2%
- Equity multiple
- 0.44×
- Total profit
- $-31,627
- Equity at exit
- $17,292
Cash invested: $56,000 (down + closing). Projections, not guarantees.
Landlord ↔ Tenant lean methodology
- Overall (STATE)
- 87 Strongly Landlord-Friendly
- State Florida
- 87 Strongly Landlord-Friendly · R+3
- County
- — inherits STATE
- City
- — inherits STATE
ZIP-level market 34452
- Home prices YoY
- -25.2%
- Active inventory
- 260
- Price-to-rent
- 11.3×
Monthly cashflow live
- Estimated rent
- $1,469 medium interval (Pro) →
- Mortgage (P&I)
- −$1,049
- Tax from tax record
- −$49 /mo · $591/yr
- Insurance
- −$83
- HOA
- −$0
- Vacancy / Maint / Mgmt
- −$308
- Net cashflow
- $-21
Break-even live
UW: 25.0% down · 7.5% · 30yr · 1.5% tax · 5.0% vac · 8.0% maint · 8.0% mgmt
Financing live
Cash to close
- Down payment
- $50,000
- Closing costs
- $6,000
- Reserves months
- —
- Total cash needed
- —
Loan-product check · same deal, 3 products live
Conventional
25% down · 7.5% · 30yr
- Down + closing
- —
- Monthly P&I
- —
- Monthly cashflow
- —
- DSCR
- —
- Eligible?
- —
Personal DTI + credit; lowest rate.
DSCR
20% down · 8.5% · 30yr
- Down + closing
- —
- Monthly P&I
- —
- Monthly cashflow
- —
- DSCR
- —
- Eligible?
- —
No personal income docs; deal must DSCR.
Hard money
10% down · 12.0% · 12mo
- Down + closing
- —
- Monthly P&I
- —
- Monthly cashflow
- —
- DSCR
- —
- Eligible?
- —
Short-term bridge; refi at stabilization.
Listing history 19 events
-
2026-06-19days on market $200,000 Active 88 DOM
-
2026-06-18days on market $200,000 Active 87 DOM
-
2026-06-17days on market $200,000 Active 86 DOM
-
2026-06-16days on market $200,000 Active 85 DOM
-
2026-06-15days on market $200,000 Active 84 DOM
-
2026-06-14days on market $200,000 Active 82 DOM
-
2026-06-13days on market $200,000 Active 81 DOM
-
2026-06-09days on market $200,000 Active 78 DOM
-
2026-06-08days on market $200,000 Active 77 DOM
-
2026-06-07days on market $200,000 Active 76 DOM
-
2026-06-03days on market $200,000 Active 72 DOM
-
2026-06-02days on market $200,000 Active 71 DOM
-
2026-06-01days on market $200,000 Active 70 DOM
-
2026-05-31days on market $200,000 Active 69 DOM
-
2026-05-30days on market $200,000 Active 68 DOM
-
2026-03-24price $200,000
-
2026-03-23$189,000 Active
-
1992-09-01soldstatus $45,000
-
1980-07-01soldstatus $41,500
ⓘ Source: listings_history table (triggers on properties + properties_extension) + one-shot
backfill from property_details.listing_events for pre-trigger history.
Tax reassessment forecast FL · Resets to sale price
- Current annual tax
- $591 · $49/mo
- Projected year-2 tax
- $1,660 · $138/mo
- Expected delta
- +$1,069/yr (+$89/mo · 181.0%)
ⓘ Screening estimate from a state-policy table — verify with the county assessor before closing.
Climate risk First Street
- Flood 1/10 Low FEMA zone X (unshaded) · 0% chance over 30 yrs
- Wildfire 4/10 Moderate
- Heat 9/10 Extreme 7 d/yr ≥108°F today · 23 d/yr by 30 yrs out
- Wind 9/10 Extreme 99% chance of damaging wind over 30 yrs
- Air quality 1/10 Low 0 unhealthy d/yr today · 0 by 30 yrs out
Nearby sold comps map
Loading sold comps map…
Walkable amenities ~0.75 mi
Loading nearby amenities…
Taxation est. · year 1
- Rental income
- $17,624
- − Mortgage interest
- −$11,203
- − Property taxes
- −$591
- − Insurance
- −$1,000
- − Repairs & maintenance
- −$1,410
- − Management
- −$1,410
- − Depreciation
- −$5,818
- Taxable loss
- −$3,808
- Est. tax savings @ 24.0%
- +$914
- After-tax cash flow
- $660/yr
For passive investors: Depreciation is non-cash, so a rental often shows a tax loss while cash-flowing — sheltering income. Rental losses are passive: they offset passive income freely, and up to $25,000/yr can offset ordinary (W-2) income if you actively participate and your MAGI is under $100k (phasing out to $0 by $150k); unused losses carry forward. On sale, claimed depreciation is recaptured at up to 25%, and gains may owe capital-gains tax (a 1031 exchange can defer both). Figures are a year-1 estimate at your 24.0% rate — not tax advice; consult a CPA.
Schools (NCES district)
- District
- Citrus
- NCES district ID
- 1200270
- Math proficiency
- 49% ▼ -10.00%
- Reading proficiency
- 50% ▼ -6.00%
- Median HH income
- $38,618
- Composite
- 41.28/100
- National rank
- #3519
- State rank
- #44 of 73 in FL
Livability — Inverness Highlands South
- Score
- 68/100
- State rank
- #508
- US rank
- #9372
Category grades
Schools grade is shown separately in the Schools card above.
Census & demographics
- Census place
- Inverness Highlands South, FL
- Population (ZIP)
- 13,729
Population outlook (Citrus County) Hauer SSP2
- Today (2025)
- 138,622 people
- By 2030
- 136,886 · -1.3%
- By 2040
- 132,009 · -4.8%
- By 2050
- 125,196 · -9.7%
- By 2075
- 108,570 · -21.7%
- By 2100
- 84,454 · -39.1%
Race, ethnicity, and origin ACS 2023
- Neighborhood character
- Predominantly White (86%)
- Race & ethnicity
- White 86% Hispanic / Latino 9% Two or more races 5% Asian 2%
- Hispanic origin (detail)
- Mexican 1% Puerto Rican 3% Cuban 2% Dominican 1%
- Common ancestry
- Lithuanian 3% Romanian 2% Slovak 2%
- Foreign-born
- 4% · Canada, Jamaica, Dominican Republic
- Languages at home
- 92% English-only · Spanish 6%
Political lean MEDSL · Citrus
- 2024 margin
- Solid R (+45.9) · D 26.8% · R 72.6%
- 2008→2024 swing
- -29.8pp toward R · 2008: -16.1pp · 2024: -45.9pp
- All cycles
- 2024: R+45.9 2020: R+41.0 2016: R+39.7 2012: R+21.9 2008: R+16.1
Not yet ingested
- Civics
- —
Market trends
- HPI YoY
- ▼ -105.43%
- Current HPI
- 312.8871
- Rent YoY
- —
- Metro
- —
- State GDP YoY
- ▲ 3.28%
- F500 in state
- 36
Industry mix (Fortune 500 HQ in FL)
| Industry | F500 HQs | Revenue |
|---|---|---|
| Industrial Technology | 2 | $29B |
|
||
| Insurance | 2 | $17B |
|
||
| Retail | 1 | $60B |
|
||
| Technology Distribution | 1 | $58B |
|
||
| Homebuilding | 1 | $35B |
|
||
| Technology Manufacturing | 1 | $35B |
|
||
Price history
+381.9% since first listed4 events — show timeline
- 2026-03-24 Price Changed $200,000 RACC
- 2026-03-23 Listed $189,000 RACC
- 1992-09-01 Sold (Public Records) $45,000 Public Records
- 1980-07-01 Sold (Public Records) $41,500 Public Records
Property tax history
+4.9%/yrLatest (2025): $591 · +10.0% YoY. Source: county tax records.
Cash-flow waterfall
monthlySold comps — $/sqft
last 12 mo · ≤1 miLoading sold comps…