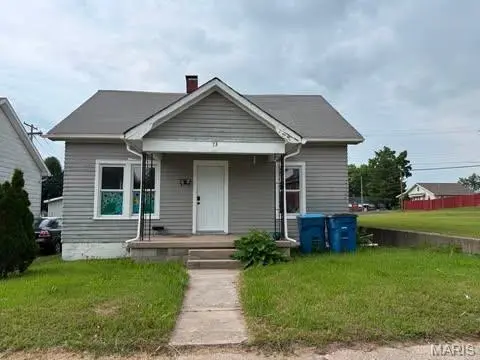
73 E Penning Ave · Wood River, IL
Flood risk 1/10 · Minimal
- FEMA flood zone
- X
- Chance of flooding over 30 yrs
- 0.0%
- Est. flood insurance / yr
- $473 – $860
Fire risk 1/10 · Minimal
- Est. fire insurance / yr
- $804 – $1,492
Heat risk 6/10 · Moderate
- Hot days now (above 107°F)
- 7 days/yr
- Hot days in 30 yrs
- 20 days/yr
Wind risk 2/10 · Minimal
- Chance of severe wind over 30 yrs
- 1.0%
Air-quality risk 3/10 · Minor
- Unhealthy air days now
- 2 days/yr
- Unhealthy air days in 30 yrs
- 4 days/yr
Risk factors via First Street. Map © Google.
Why this score? — see what drove the B+ grade
The composite is a weighted blend of 9 inputs, each scored 0–100. Each bar is that input's sub-score; the figure is the points it added to the 100-point composite (weight × sub-score).
- Cash flow +30.0/30.0
- ARV discount +15.0/15.0
- 1% rule +10.0/10.0
- DSCR +10.0/10.0
- Livability +3.8/5.0
- Rent growth +2.5/5.0
- Condition / age +2.5/5.0
- Schools +1.6/10.0
- Appreciation +0.0/10.0
$60,000
🖨 Deal sheet 📄 Offer letter ✓ Due diligence
Listing remarks
ATENTION flipper and investors! Are you looking for your next project? This one has already been started with lots of new upgrades including fixtures flooring and carpet as well as some doors. 3 bed and 1 bath home with a large backyard. Just a little bit of TLC this one could be ready in no time! Seller will replace HVAC with an acceptable offer. This home is being sold as is and seller will do no inspections including occupancy. Please show during daylight hours. Seller will also do no repairs. Buyer to verify all MLS data including but not limited to taxes exemptions sq footage schools and features.
Key facts
- New upgrades
- Fixtures flooring
- Large backyard
Tags
Property features AI
Finance
- Other: Living area documented as 672 (source: public records)
- Financial info: Lease not considered; No second mortgage indicated
Exterior
- Utilities: Public water; Public sewer; Single-phase electric service; Electricity available
- Home design: Single family residence; One and one-half levels; Residential property
- Construction: Frame construction
- Exterior features: Level lot; Shed(s) on the property; Lot dimensions approximately 37.5 x 117.5
Interior
- Kitchen: Standard kitchen
- Bedrooms: 3 bedrooms total; 1 bedroom on the main level; 2 bedrooms on the upper level
- Bathrooms: 1 full bathroom (on the main level)
- Heating & cooling: Natural gas heating; Central air conditioning
- Interior features: Living room (15 x 12); Kitchen (11 x 10); Basement: block foundation, unfinished
- Laundry & utility: Utility space in basement
Neighborhood map
What this means for you Summary
Snapshot
- This is a 3-bed/1.0-bath single-family listed at $60k.
Deal economics
- At list price, monthly cash flow is $502 ($6k/yr) — positive.
- The deal already cash-flows at list — no discount required.
- Meets the 1% rule at list price ($1k rent vs $60k).
- Recommended offer: $59k (1.5% below list) — sets the bar for market timing.
- Cap rate 16.3% vs local median 5.9% in Wood River — top-decile yield for the area; either an underpriced asset or a hidden risk that comps aren't pricing in. Stress-test before assuming the spread holds.
Location & tenants
- Location reads 75/100 on livability (#214 in IL, #4,027 nationally) — a middle-class / working-renter tenant base. Strengths: cost of living A+, housing A+, health & safety B; Watch: amenities C-, commute D+, employment D+.
- East Alton-Wood River Chsd 14 (suburban): math 10% / reading 20% proficiency, ranked #793 of 919 in IL (top 86%) — low school quality limits family demand, transient renter base, plan for 1-2y turnover.
- Zoned schools: East Alton-Wood River High Sch (math 8% / reading 12%, grade F, #567 of 693 statewide, top 83%, 537 students, 0% FRL).
- Market conditions: 33 active listings in the ZIP; 336 units permitted in Madison County in 2024 (0 in 5+ unit buildings).
Forward outlook
- Local home prices are declining (-3.0%/yr); year-one equity from $415 of loan paydown is wiped out by about $2k of value loss. Plan a longer hold.
- Madison County population projected at -18% by 2050 — secular population decline; favor cash flow + early exit over multi-decade hold.
- At projected returns (-3.0% appreciation + 3.0% rent growth), your $17k cash investment doubles in ~4 years — after that, you're playing with house money.
Negotiation context
- It's been on market 23 days — a 2% lower offer ($59k) is reasonable based on typical stale-listing flexibility.
Risks & watch-outs
- Watch-outs: built in 1920 — expect roof / HVAC / electrical / plumbing capex.
- Climate carrying-cost: extreme-heat days projected 7→20/yr by 2055 (HVAC capex compounding) — expect insurance premiums to compound above CPI over the hold.
Questions for the listing agent
- Built in 1920 — when were the roof, HVAC, electrical panel, plumbing, and water heater last replaced?
- Is there a deadline driving the sale (1031 exchange, divorce, estate, relocation)? That informs how much negotiation room exists.
- Schools are F-rated, which usually means shorter tenancies and higher turnover. Who's the typical renter profile here, and what's been the actual vacancy rate?
- What's the average days-on-market for RENTAL listings here right now (not sales)? A rising rental-DOM trend means longer vacancies and softer asking-rent achievability than the comps imply.
- What's the recent tenant-quality profile in this submarket — average credit score on applications, eviction rate, late-payment / NSF rate, and stable-employment percentage? A property-management company in the area should have these aggregated.
- How much new for-sale + rental construction is in the pipeline within 1–3 miles? Heavy new supply typically softens prices + rents 12–24 months out; constrained supply supports both.
Investment metrics
- 1% rule
- 1.99% ✓
- Cap rate
- 16.34%
- Cash-on-cash
- 35.88%
- DSCR
- 2.60
- GRM
- 4.2
CMA / ARV
- ARV (on-the-fly)
- $100,128
- Comps found
- 8
Show comp detail 8 sales within ~0.75 mi
| Address | Dist | Beds/Ba | Sqft | Sold | Price | $/sf | Match |
|---|---|---|---|---|---|---|---|
| 451 N Wood River Ave | 0.16mi | 2/1.0 (-1) | 768 (+14%) | 2mo | $124,900 | $163 | 62 |
| 469 N 1st St | 0.16mi | 2/1.0 (-1) | 768 (+14%) | 6mo | $74,900 | $98 | 59 |
| 314 N 3rd St | 0.23mi | 2/1.0 (-1) | 767 (+14%) | 3mo | $144,990 | $189 | 58 |
| 511 E Penning Ave | 0.45mi | 2/1.0 (-1) | 736 (+10%) | 16mo | $45,000 | $61 | 45 |
| 833 State St | 0.71mi | 2/1.0 (-1) | 720 (+7%) | 6mo | $107,000 | $149 | 45 |
| 148 Park Ave | 0.62mi | 2/1.0 (-1) | 728 (+8%) | 10mo | $121,400 | $167 | 44 |
| 835 Rice St | 0.69mi | 2/1.0 (-1) | 748 (+11%) | 4mo | $52,000 | $70 | 40 |
| 967 Whitelaw Ave | 0.73mi | 2/1.0 (-1) | 704 (+5%) | 16mo | $35,000 | $50 | 40 |
Match score weights: distance 35% · size 25% · config 20% · recency 20%. Top-matched comps best support the ARV.
Projected returns pro-forma
-3.0% appreciation · 3.0% rent growth · sell at horizon
- IRR
- 31.6%
- Equity multiple
- 2.33×
- Total profit
- $22,306
- Equity at exit
- $8,946
- IRR
- 38.7%
- Equity multiple
- 4.62×
- Total profit
- $60,765
- Equity at exit
- $5,188
Cash invested: $16,800 (down + closing). Projections, not guarantees.
Landlord ↔ Tenant lean methodology
- Overall (STATE)
- 43 Moderately Tenant-Leaning
- State Illinois
- 43 Moderately Tenant-Leaning · D+7
- County
- — inherits STATE
- City
- — inherits STATE
ZIP-level market 62095
- Home prices YoY
- -22.9%
- Active inventory
- 33
- Price-to-rent
- 4.2×
Monthly cashflow live
- Estimated rent
- $1,197 medium interval (Pro) →
- Mortgage (P&I)
- −$315
- Tax from tax record
- −$104 /mo · $1,244/yr
- Insurance
- −$25
- HOA
- −$0
- Vacancy / Maint / Mgmt
- −$251
- Net cashflow
- $502
Break-even live
UW: 25.0% down · 7.5% · 30yr · 1.5% tax · 5.0% vac · 8.0% maint · 8.0% mgmt
Financing live
Cash to close
- Down payment
- $15,000
- Closing costs
- $1,800
- Reserves months
- —
- Total cash needed
- —
Loan-product check · same deal, 3 products live
Conventional
25% down · 7.5% · 30yr
- Down + closing
- —
- Monthly P&I
- —
- Monthly cashflow
- —
- DSCR
- —
- Eligible?
- —
Personal DTI + credit; lowest rate.
DSCR
20% down · 8.5% · 30yr
- Down + closing
- —
- Monthly P&I
- —
- Monthly cashflow
- —
- DSCR
- —
- Eligible?
- —
No personal income docs; deal must DSCR.
Hard money
10% down · 12.0% · 12mo
- Down + closing
- —
- Monthly P&I
- —
- Monthly cashflow
- —
- DSCR
- —
- Eligible?
- —
Short-term bridge; refi at stabilization.
Listing history 14 events
-
2026-06-18days on market $60,000 Active 23 DOM
-
2026-06-17days on market $60,000 Active 22 DOM
-
2026-06-16days on market $60,000 Active 21 DOM
-
2026-06-15days on market $60,000 Active 20 DOM
-
2026-06-13days on market $60,000 Active 18 DOM
-
2026-06-13days on market $60,000 Active 17 DOM
-
2026-06-09days on market $60,000 Active 14 DOM
-
2026-06-08days on market $60,000 Active 13 DOM
-
2026-06-07days on market $60,000 Active 12 DOM
-
2026-06-03days on market $60,000 Active 8 DOM
-
2026-06-02days on market $60,000 Active 7 DOM
-
2026-06-01days on market $60,000 Active 6 DOM
-
2026-05-31days on market $60,000 Active 5 DOM
-
2026-05-26$60,000 Active
ⓘ Source: listings_history table (triggers on properties + properties_extension) + one-shot
backfill from property_details.listing_events for pre-trigger history.
Tax reassessment forecast IL · Partial reset (capped growth)
- Current annual tax
- $1,244 · $104/mo
- Projected year-2 tax
- $1,303 · $109/mo
- Expected delta
- +$59/yr (+$5/mo · 4.8%)
ⓘ Screening estimate from a state-policy table — verify with the county assessor before closing.
Climate risk First Street
- Flood 1/10 Low FEMA zone X · 0% chance over 30 yrs
- Wildfire 1/10 Low
- Heat 6/10 Major 7 d/yr ≥107°F today · 20 d/yr by 30 yrs out
- Wind 2/10 Low 100% chance of damaging wind over 30 yrs
- Air quality 3/10 Moderate 2 unhealthy d/yr today · 4 by 30 yrs out
Nearby sold comps map
Loading sold comps map…
Walkable amenities ~0.75 mi
Loading nearby amenities…
Taxation est. · year 1
- Rental income
- $14,364
- − Mortgage interest
- −$3,361
- − Property taxes
- −$1,244
- − Insurance
- −$300
- − Repairs & maintenance
- −$1,149
- − Management
- −$1,149
- − Depreciation
- −$1,745
- Taxable income
- $5,415
- Est. tax owed @ 24.0%
- −$1,300
- After-tax cash flow
- $4,728/yr
For passive investors: Depreciation is non-cash, so a rental often shows a tax loss while cash-flowing — sheltering income. Rental losses are passive: they offset passive income freely, and up to $25,000/yr can offset ordinary (W-2) income if you actively participate and your MAGI is under $100k (phasing out to $0 by $150k); unused losses carry forward. On sale, claimed depreciation is recaptured at up to 25%, and gains may owe capital-gains tax (a 1031 exchange can defer both). Figures are a year-1 estimate at your 24.0% rate — not tax advice; consult a CPA.
Schools (NCES district)
- District
- East Alton-Wood River Chsd 14
- NCES district ID
- 1712990
- Math proficiency
- 10% ▬ 0.00%
- Reading proficiency
- 20% ▬ 0.00%
- Median HH income
- $35,977
- Composite
- 15.86/100
- National rank
- #14315
- State rank
- #793 of 919 in IL
Livability — Wood River
- Score
- 75/100
- State rank
- #214
- US rank
- #4027
Category grades
Schools grade is shown separately in the Schools card above.
Census & demographics
- Census place
- Wood River, IL
- County
- Madison County · 189,064 people
- City population
- 10,726
- Metro
- St. Louis, MO-IL
- Population (ZIP)
- 10,726
- Household income
- $65,013
- Rent vs Own
- Severe rent burden
- 383.0
Population outlook (Madison County) Hauer SSP2
- Today (2025)
- 258,371 people
- By 2030
- 251,523 · -2.7%
- By 2040
- 233,640 · -9.6%
- By 2050
- 213,042 · -17.5%
- By 2075
- 165,255 · -36.0%
- By 2100
- 123,953 · -52.0%
Race, ethnicity, and origin ACS 2023
- Neighborhood character
- Predominantly White (87%)
- Race & ethnicity
- White 87% Black 6% Two or more races 6% Hispanic / Latino 3%
- Common ancestry
- Lithuanian 2% Romanian 2% Iranian 1%
- Foreign-born
- 2% · Canada
- Languages at home
- 97% English-only · Spanish 2%
Political lean MEDSL · Madison
- 2024 margin
- R (+13.3) · D 42.5% · R 55.8% · Other 1.8%
- 2008→2024 swing
- -22.5pp toward R · 2008: 9.2pp · 2024: -13.3pp
- All cycles
- 2024: R+13.3 2020: R+13.2 2016: R+15.6 2012: R+1.4 2008: D+9.2
Not yet ingested
- Civics
- —
Market trends
- HPI YoY
- ▼ -64.69%
- Current HPI
- 217.1264
- Rent YoY
- —
- Metro
- St. Louis, MO-IL
- State GDP YoY
- ▲ 1.59%
- F500 in state
- 60
Industry mix (Fortune 500 HQ in IL)
| Industry | F500 HQs | Revenue |
|---|---|---|
| Insurance | 4 | $201B |
|
||
| Consumer Goods | 4 | $87B |
|
||
| Industrial Machinery | 3 | $64B |
|
||
| Healthcare | 2 | $55B |
|
||
| Retail / Pharmacy | 1 | $148B |
|
||
| Agriculture / Food | 1 | $86B |
|
||
Price history
1 event — show timeline
- 2026-05-26 Listed $60,000 MARIS as Distributed by MLS Grid
Property tax history
+3.2%/yrLatest (2024): $1,244 · +5.6% YoY. Source: county tax records.
Cash-flow waterfall
monthlySold comps — $/sqft
last 12 mo · ≤1 miLoading sold comps…