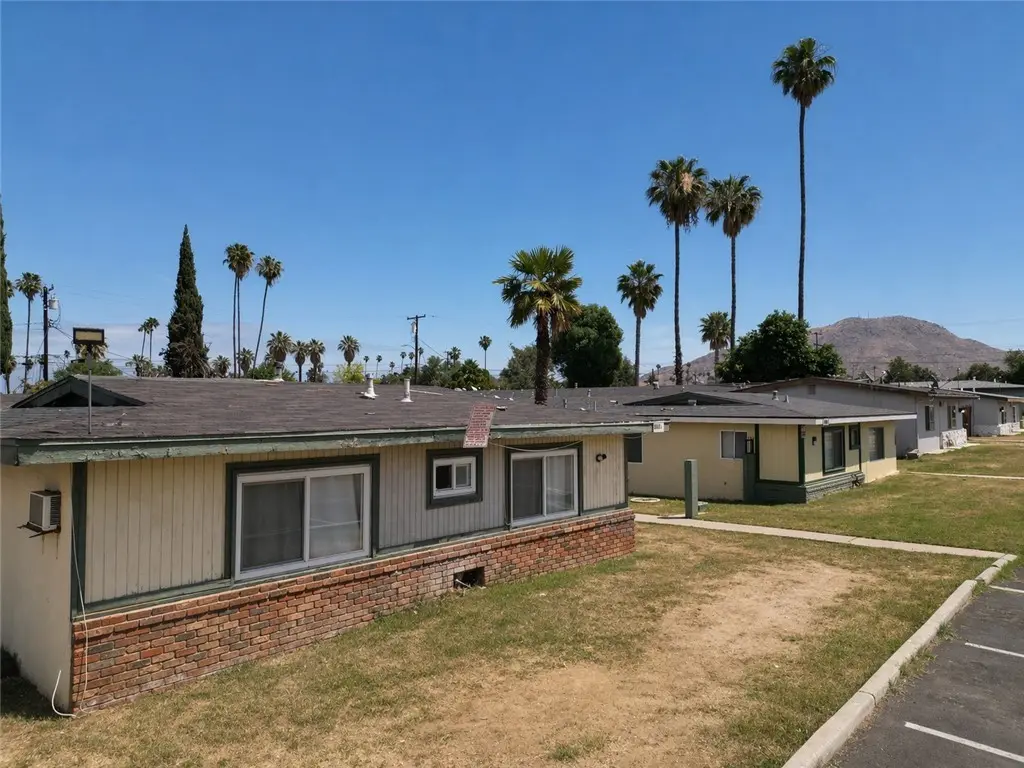
 Duplex
1195 W SPRING St · Highgrove, CA
Flood risk 1/10 · Minimal
- FEMA flood zone
- X (unshaded)
- Chance of flooding over 30 yrs
- 0.0%
- Est. flood insurance / yr
- $507 – $1,088
Fire risk 7/10 · Major
- Est. fire insurance / yr
- $659 – $1,223
Heat risk 8/10 · Major
- Hot days now (above 101°F)
- 7 days/yr
- Hot days in 30 yrs
- 20 days/yr
Wind risk 1/10 · Minimal
- Chance of severe wind over 30 yrs
- —
Air-quality risk 9/10 · Severe
- Unhealthy air days now
- 22 days/yr
- Unhealthy air days in 30 yrs
- 27 days/yr
Risk factors via First Street. Map © Google.
Why this score? — see what drove the D grade
The composite is a weighted blend of 9 inputs, each scored 0–100. Each bar is that input's sub-score; the figure is the points it added to the 100-point composite (weight × sub-score).
- Cash flow +12.3/30.0
- ARV discount +10.1/15.0
- Schools +4.1/10.0
- DSCR +3.6/10.0
- 1% rule +2.7/10.0
- Rent growth +2.6/5.0
- Livability +2.5/5.0
- Condition / age +2.5/5.0
- Appreciation +0.0/10.0
$885,000
🖨 Deal sheet 📄 Offer letter ✓ Due diligence
Multi-family units
County records classify this as Multi-Family (5+ Unit). Listing-text estimate: 2 units. estimate disagrees with records
5+ unit building — per-unit beds/baths from public records are typically unavailable; the breakdown below (if shown) is an estimate from the listing text.
Listing remarks MLS
Pleased to exclusively present the opportunity to acquire a five-unit multifamily property built in 1962 with 3,264 rentable square feet on a 0.21 acre lot in the City of Riverside. The property features a highly functional unit mix of one and two bedroom floor plans, with single-story construction. The property has an on-site laundry room, wall-mounted air conditioner & heater units, & each unit is separately metered for gas and electricity. The property is on septic. Parking consists of 5 carport parking spaces and 4 open space parking. Riverside presents a compelling investment environment driven by a diverse employment base, continued population growth, and relative affordability compared to coastal markets. Major employment anchors include the County of Riverside, March Air Reserve Base, and the University of California, Riverside, which together support stable housing demand from government, military, academic, and healthcare professionals. Residents enjoy a strong quality of life with access to Downtown Riverside amenities such as the historic Mission Inn, the Fox Performing Arts Center, and outdoor recreation at California Citrus State Historic Park. Ongoing downtown reinvestment, including the Riverside Alive initiative featuring new residential, office, retail, hotel uses, and convention center expansion, further reinforces long-term economic growth and rental demand. With solid fundamentals, efficient unit layouts, limited utility exposure, and a growing Inland Empire market, 1195 Spring Street offers investors an attractive opportunity to acquire a stable, well-located multifamily asset positioned for durable income and long-term appreciation.
Key facts
- On-site laundry room
- Multifamily property
- Separately metered
Tags
Neighborhood map
What this means for you Summary
Snapshot
- This is a 2 × 4-bed/?-bath units multifamily listed at $885k.
Deal economics
- At list price, monthly cash flow is $-169 ($-2k/yr) — negative. Per door: $-85/mo.
- To cash-flow at today's rent, offer at most $855k (3.4% below list).
- To meet the 1% rule (rent ≥ 1% of price), the offer needs to be $679k (23.3% below list).
- Recommended offer: $679k (23.3% below list) — sets the bar for 1% rule.
- Cap rate 6.1% vs local median 3.1% in Highgrove — top-decile yield for the area; either an underpriced asset or a hidden risk that comps aren't pricing in. Stress-test before assuming the spread holds.
Location & tenants
- Location reads 49/100 on livability (#1,172 in CA) — a working-class tenant base; expect higher turnover. Strengths: housing A, employment A-; Watch: crime C-, schools F, amenities F.
- Riverside Unified (urban): math 36% / reading 51% proficiency, ranked #574 of 1,400 in CA (top 41%) — families likely to look elsewhere, expect single-tenant / working-renter base with shorter leases.
- Market conditions: Rents flat; 156 active listings in the ZIP; solid renter incomes; 9,195 units permitted in Riverside County in 2024 (1,512 in 5+ unit buildings).
- At $6,788/mo this rent would consume 108% of the median local household income ($75k/yr) (locally 3590% of renters already pay >50% of income on rent) — very limited rent-growth headroom before tenants either downsize or default.
Forward outlook
- Local home prices are declining (-3.0%/yr); year-one equity from $6k of loan paydown is wiped out by about $27k of value loss. Plan a longer hold.
- Riverside County population projected at +22% by 2050 — long-run rental-demand tailwind backs the buy-and-hold thesis.
Negotiation context
- It's been on market 142 days — a 12% lower offer ($779k) is reasonable based on typical stale-listing flexibility.
- 13 sale attempts since 21y ago; this cycle's ask has dropped $80k (8%) from the opening price — seller is motivated, your offer sets the floor, not the list.
- Current owner paid $498k; list at $885k implies a 78% gain — meaningful room to come down on a strong offer.
Risks & watch-outs
- Climate carrying-cost: major wildfire risk; extreme-heat days projected 7→20/yr by 2055 (HVAC capex compounding) — expect insurance premiums to compound above CPI over the hold.
Questions for the listing agent
- What do current leases actually rent for vs. the listed asking? Can we see a recent rent roll and the last 12 months of T-12 income?
- It's been on market 142 days. Have you received any prior offers? Is the seller open to a 23% concession, seller financing, or rate buy-down credit?
- Can we see the unit-by-unit rent roll, current vacancy, and any below-market leases? What's the average tenancy length?
- What capital expenditures (roof, boiler, parking lot, exteriors) have been made in the last 5 years, and what's planned in the next 2?
- Built in 1962 — when were the roof, HVAC, electrical panel, plumbing, and water heater last replaced?
- Why hasn't it sold? Are there any deal-killer items the seller is aware of (foundation, flood, title, zoning, code violations)?
- Is there a deadline driving the sale (1031 exchange, divorce, estate, relocation)? That informs how much negotiation room exists.
- Schools are F-rated, which usually means shorter tenancies and higher turnover. Who's the typical renter profile here, and what's been the actual vacancy rate?
- The area grade is low — what's the realistic commute time and amenity access for the typical tenant pool here? Any planned neighborhood developments (good or bad) we should know about?
- What's the average days-on-market for RENTAL listings here right now (not sales)? A rising rental-DOM trend means longer vacancies and softer asking-rent achievability than the comps imply.
- What's the recent tenant-quality profile in this submarket — average credit score on applications, eviction rate, late-payment / NSF rate, and stable-employment percentage? A property-management company in the area should have these aggregated.
- How much new apartment / multifamily construction is in the pipeline within 1–3 miles? Heavy new supply (>2% of stock underway) typically softens rents 12–24 months out; light construction supports rent growth.
Investment metrics
- 1% rule
- 0.77% ✗
- Cap rate
- 6.06%
- Cash-on-cash
- -0.82%
- DSCR
- 0.96
- GRM
- 10.9
CMA / ARV
- ARV (median comp)
- $938,371
- List price
- $885,000
- Delta
- -5.69%
- Verdict
- FAIR
- Comps
- 6 within 1.0 mi
Projected returns pro-forma
-3.0% appreciation · 0.53% rent growth · sell at horizon
- IRR
- -20.2%
- Equity multiple
- 0.31×
- Total profit
- $-170,895
- Equity at exit
- $131,956
- IRR
- -19.1%
- Equity multiple
- 0.08×
- Total profit
- $-228,016
- Equity at exit
- $76,519
Cash invested: $247,800 (down + closing). Projections, not guarantees.
Landlord ↔ Tenant lean methodology
- Overall (STATE)
- 18 Strongly Tenant-Friendly
- State California
- 18 Strongly Tenant-Friendly · D+13
- County
- — inherits STATE
- City
- — inherits STATE
ZIP-level market 92507
- Rents YoY
- 0.5%
- Active inventory
- 156
- Price-to-rent
- 21.7×
Monthly cashflow live
- Estimated rent
- $6,788 high interval (Pro) →
- Mortgage (P&I)
- −$4,641
- Tax from tax record
- −$522 /mo · $6,261/yr
- Insurance
- −$369
- HOA
- −$0
- Vacancy / Maint / Mgmt
- −$1,425
- Net cashflow
- $-169
Break-even live
2-unit breakdown (identical units grouped — click to expand)
| Units | Beds | Baths | Est. rent |
|---|---|---|---|
| 2× units | 4 | — | $6,788 |
| #1 | 4 | — | $3,394 |
| #2 | 4 | — | $3,394 |
| Total (2 units) | $6,788 | ||
UW: 25.0% down · 7.5% · 30yr · 1.5% tax · 5.0% vac · 8.0% maint · 8.0% mgmt
Financing live
Cash to close
- Down payment
- $221,250
- Closing costs
- $26,550
- Reserves months
- —
- Total cash needed
- —
Loan-product check · same deal, 3 products live
Conventional
25% down · 7.5% · 30yr
- Down + closing
- —
- Monthly P&I
- —
- Monthly cashflow
- —
- DSCR
- —
- Eligible?
- —
Personal DTI + credit; lowest rate.
DSCR
20% down · 8.5% · 30yr
- Down + closing
- —
- Monthly P&I
- —
- Monthly cashflow
- —
- DSCR
- —
- Eligible?
- —
No personal income docs; deal must DSCR.
Hard money
10% down · 12.0% · 12mo
- Down + closing
- —
- Monthly P&I
- —
- Monthly cashflow
- —
- DSCR
- —
- Eligible?
- —
Short-term bridge; refi at stabilization.
Listing history 50 events
-
2026-06-18days on market $885,000 Active 142 DOM
-
2026-06-17days on market $885,000 Active 141 DOM
-
2026-06-16days on market $885,000 Active 140 DOM
-
2026-06-15days on market $885,000 Active 139 DOM
-
2026-06-13days on market $885,000 Active 137 DOM
-
2026-06-13days on market $885,000 Active 136 DOM
-
2026-06-09days on market $885,000 Active 133 DOM
-
2026-06-08days on market $885,000 Active 132 DOM
-
2026-06-07days on market $885,000 Active 131 DOM
-
2026-06-04days on market $885,000 Active 128 DOM
-
2026-06-03days on market $885,000 Active 127 DOM
-
2026-06-02days on market $885,000 Active 126 DOM
-
2026-06-01days on market $885,000 Active 125 DOM
-
2026-05-31days on market $885,000 Active 124 DOM
-
2026-04-20price $920,000 1699-char remark
Show marketing remark (1699 chars)
Pleased to exclusively present the opportunity to acquire a five-unit multifamily property built in 1962 with 3,264 rentable square feet on a 0.21 acre lot in the City of Riverside. The property features a highly functional unit mix of one and two bedroom floor plans, with single-story construction. The property has an on-site laundry room, wall-mounted air conditioner & heater units, & each unit is separately metered for gas and electricity. The property is on septic. Parking consists of 5 carport parking spaces and 4 open space parking. Riverside presents a compelling investment environment driven by a diverse employment base, continued population growth, and relative affordability compared to coastal markets. Major employment anchors include the County of Riverside, March Air Reserve Base, and the University of California, Riverside, which together support stable housing demand from government, military, academic, and healthcare professionals. Residents enjoy a strong quality of life with access to Downtown Riverside amenities such as the historic Mission Inn, the Fox Performing Arts Center, and outdoor recreation at California Citrus State Historic Park. Ongoing downtown reinvestment, including the Riverside Alive initiative featuring new residential, office, retail, hotel uses, and convention center expansion, further reinforces long-term economic growth and rental demand. With solid fundamentals, efficient unit layouts, limited utility exposure, and a growing Inland Empire market, 1195 Spring Street offers investors an attractive opportunity to acquire a stable, well-located multifamily asset positioned for durable income and long-term appreciation.
-
2026-01-27$965,000 Active 1699-char remark
Show marketing remark (1699 chars)
Pleased to exclusively present the opportunity to acquire a five-unit multifamily property built in 1962 with 3,264 rentable square feet on a 0.21 acre lot in the City of Riverside. The property features a highly functional unit mix of one and two bedroom floor plans, with single-story construction. The property has an on-site laundry room, wall-mounted air conditioner & heater units, & each unit is separately metered for gas and electricity. The property is on septic. Parking consists of 5 carport parking spaces and 4 open space parking. Riverside presents a compelling investment environment driven by a diverse employment base, continued population growth, and relative affordability compared to coastal markets. Major employment anchors include the County of Riverside, March Air Reserve Base, and the University of California, Riverside, which together support stable housing demand from government, military, academic, and healthcare professionals. Residents enjoy a strong quality of life with access to Downtown Riverside amenities such as the historic Mission Inn, the Fox Performing Arts Center, and outdoor recreation at California Citrus State Historic Park. Ongoing downtown reinvestment, including the Riverside Alive initiative featuring new residential, office, retail, hotel uses, and convention center expansion, further reinforces long-term economic growth and rental demand. With solid fundamentals, efficient unit layouts, limited utility exposure, and a growing Inland Empire market, 1195 Spring Street offers investors an attractive opportunity to acquire a stable, well-located multifamily asset positioned for durable income and long-term appreciation.
-
2017-10-31soldstatus $497,800 Closed Sale
-
2017-10-31soldstatus $497,800
-
2017-10-30soldstatus $483,000
-
2017-10-20status Pending Sale
-
2017-09-16historical Active Under Contract
-
2017-02-08$497,800 Active
-
2017-02-07$497,800
-
2016-04-15soldstatus $415,000 Closed Sale
-
2016-04-15soldstatus $415,000
-
2016-04-12soldstatus $415,000
-
2016-04-02status Pending Sale
-
2016-02-12status Active
-
2016-01-29status Pending Sale
-
2015-08-29price $419,000
-
2015-07-22status Active
-
2015-07-08status Pending Sale
-
2015-06-30price $430,000
-
2015-05-27price $439,000
-
2015-04-18price $450,000
-
2015-04-01$470,000 Active
-
2015-03-31$419,000
-
2013-07-01historical
-
2012-12-24status Active
-
2012-12-12historical Hold
-
2012-11-06$375,000 Active
-
2005-12-22soldstatus $495,000
-
2005-12-06soldstatus $495,000
-
2005-12-01soldstatus $495,000
-
2005-09-07$499,900
-
2005-09-07$499,900
-
2005-09-03historical
-
2005-09-01historical
-
2005-04-27$520,000
-
2005-04-27$520,000
ⓘ Source: listings_history table (triggers on properties + properties_extension) + one-shot
backfill from property_details.listing_events for pre-trigger history.
Tax reassessment forecast CA · Resets to sale price
- Current annual tax
- $6,261 · $522/mo
- Projected year-2 tax
- $6,726 · $560/mo
- Expected delta
- +$465/yr (+$39/mo · 7.4%)
ⓘ Screening estimate from a state-policy table — verify with the county assessor before closing.
Climate risk First Street
- Flood 1/10 Low FEMA zone X (unshaded) · 0% chance over 30 yrs
- Wildfire 7/10 Severe
- Heat 8/10 Severe 7 d/yr ≥101°F today · 20 d/yr by 30 yrs out
- Wind 1/10 Low
- Air quality 9/10 Extreme 22 unhealthy d/yr today · 27 by 30 yrs out
Nearby sold comps map
Loading sold comps map…
Walkable amenities ~0.75 mi
Loading nearby amenities…
Taxation est. · year 1
- Rental income
- $81,456
- − Mortgage interest
- −$49,574
- − Property taxes
- −$6,261
- − Insurance
- −$4,425
- − Repairs & maintenance
- −$6,516
- − Management
- −$6,516
- − Depreciation
- −$25,745
- Taxable loss
- −$17,582
- Est. tax savings @ 24.0%
- +$4,220
- After-tax cash flow
- $2,191/yr
For passive investors: Depreciation is non-cash, so a rental often shows a tax loss while cash-flowing — sheltering income. Rental losses are passive: they offset passive income freely, and up to $25,000/yr can offset ordinary (W-2) income if you actively participate and your MAGI is under $100k (phasing out to $0 by $150k); unused losses carry forward. On sale, claimed depreciation is recaptured at up to 25%, and gains may owe capital-gains tax (a 1031 exchange can defer both). Figures are a year-1 estimate at your 24.0% rate — not tax advice; consult a CPA.
Schools (NCES district)
- District
- Riverside Unified
- NCES district ID
- 0633150
- Math proficiency
- 36% ▲ 1.00%
- Reading proficiency
- 51% ▲ 2.00%
- Median HH income
- $62,038
- Composite
- 40.8/100
- National rank
- #7563
- State rank
- #574 of 1400 in CA
Livability — Highgrove
- Score
- 49/100
- State rank
- #1172
- US rank
- #25922
Category grades
Schools grade is shown separately in the Schools card above.
Census & demographics
- Census place
- Highgrove, CA
- County
- Riverside County · 2,287,001 people
- Metro
- Riverside-San Bernardino-Ontario, CA
- Population (ZIP)
- 64,015
- Household income
- $75,303
- Rent vs Own
- Severe rent burden
- 3590.0
Population outlook (Riverside County) Hauer SSP2
- Today (2025)
- 2,664,475 people
- By 2030
- 2,802,692 · +5.2%
- By 2040
- 3,050,904 · +14.5%
- By 2050
- 3,256,783 · +22.2%
- By 2075
- 3,655,058 · +37.2%
- By 2100
- 3,766,594 · +41.4%
Race, ethnicity, and origin ACS 2023
- Neighborhood character
- Diverse neighborhood (Simpson 0.66)
- Race & ethnicity
- Hispanic / Latino 52% White 21% Asian 14% Two or more races 13% Black 9% Native American 1%
- Hispanic origin (detail)
- Mexican 44%
- Common ancestry
- Italian 2% Lithuanian 1% Ukrainian 1%
- Foreign-born
- 23% · Canada, China, South Korea
- Languages at home
- 52% English-only · Spanish 36% Chinese 4% Other Indo-European 3%
Political lean MEDSL · Riverside
- 2024 margin
- Toss-up / Even · D 48.0% · R 49.3% · Other 2.6%
- 2008→2024 swing
- -3.6pp toward R · 2008: 2.3pp · 2024: -1.3pp
- All cycles
- 2024: R+1.3 2020: D+8.0 2016: D+4.3 2012: R+0.4 2008: D+2.3
Not yet ingested
- Civics
- —
Market trends
- HPI YoY
- ▼ -401.54%
- Current HPI
- 442.9617
- Rent YoY
- ▲ 0.53%
- Metro
- Riverside-San Bernardino-Ontario, CA
- State GDP YoY
- ▲ 3.21%
- F500 in state
- 116
Industry mix (Fortune 500 HQ in CA)
| Industry | F500 HQs | Revenue |
|---|---|---|
| Technology | 27 | $1,492B |
|
||
| Financial Services | 3 | $174B |
|
||
| Retail | 3 | $44B |
|
||
| Insurance | 3 | $26B |
|
||
| Media / Entertainment | 2 | $115B |
|
||
| Pharmaceuticals / Biotech | 2 | $62B |
|
||
Price history
+657.2% since first listed40 events — show timeline
- 2026-04-20 Price Changed $920,000 CRMLS
- 2026-01-27 Listed $965,000 CRMLS
- 2017-10-31 Sold (MLS) $497,800 SDMLS
- 2017-10-31 Sold (MLS) $497,800 CRMLS
- 2017-10-30 Sold (Public Records) $483,000 Public Records
- 2017-10-20 Pending — CRMLS
- 2017-09-16 Contingent — CRMLS
- 2017-02-08 Listed $497,800 CRMLS
- 2017-02-07 Listed $497,800 SDMLS
- 2016-04-15 Sold (MLS) $415,000 SDMLS
- 2016-04-15 Sold (MLS) $415,000 CRMLS
- 2016-04-12 Sold (Public Records) $415,000 Public Records
- 2016-04-02 Pending — CRMLS
- 2016-02-12 Relisted — CRMLS
- 2016-01-29 Pending — CRMLS
- 2015-08-29 Price Changed $419,000 CRMLS
- 2015-07-22 Relisted — CRMLS
- 2015-07-08 Pending — CRMLS
- 2015-06-30 Price Changed $430,000 CRMLS
- 2015-05-27 Price Changed $439,000 CRMLS
- 2015-04-18 Price Changed $450,000 CRMLS
- 2015-04-01 Listed $470,000 CRMLS
- 2015-03-31 Listed $419,000 SDMLS
- 2013-07-01 Listing Removed — CRMLS
- 2012-12-24 Relisted — CRMLS
- 2012-12-12 Delisted — CRMLS
- 2012-11-06 Listed $375,000 CRMLS
- 2005-12-22 Sold (MLS) $495,000 CRMLS
- 2005-12-06 Sold (Public Records) $495,000 Public Records
- 2005-12-01 Sold (MLS) $495,000 CRMLS
- 2005-09-07 Listed $499,900 CRMLS
- 2005-09-07 Listed $499,900 CRMLS
- 2005-09-03 Listing Removed — CRMLS
- 2005-09-01 Listing Removed — CRMLS
- 2005-04-27 Listed $520,000 CRMLS
- 2005-04-27 Listed $520,000 CRMLS
- 2002-09-30 Sold (Public Records) $290,000 Public Records
- 1999-07-12 Sold (Public Records) $214,000 Public Records
- 1996-12-20 Sold (Public Records) $100,400 Public Records
- 1986-01-01 Sold (Public Records) $121,500 Public Records
Property tax history
+0.6%/yrLatest (2025): $6,261 · +3.3% YoY. Source: county tax records.
Cash-flow waterfall
monthlySold comps — $/sqft
last 12 mo · ≤1 miLoading sold comps…