5555 Collins Ave Unit 7T · Miami Beach, FL
Flood risk 9/10 · Severe
- FEMA flood zone
- AE
- Chance of flooding over 30 yrs
- 0.98%
- Est. flood insurance / yr
- $1,737 – $8,500
Fire risk 1/10 · Minimal
- Est. fire insurance / yr
- $947 – $1,759
Heat risk 10/10 · Severe
- Hot days now (above 101°F)
- 7 days/yr
- Hot days in 30 yrs
- 27 days/yr
Wind risk 10/10 · Severe
- Chance of severe wind over 30 yrs
- 99.0%
Air-quality risk 2/10 · Minimal
- Unhealthy air days now
- 1 days/yr
- Unhealthy air days in 30 yrs
- 1 days/yr
Risk factors via First Street. Map © Google.
Why this score? — see what drove the D- grade
The composite is a weighted blend of 9 inputs, each scored 0–100. Each bar is that input's sub-score; the figure is the points it added to the 100-point composite (weight × sub-score).
- ARV discount +7.5/15.0
- Appreciation +5.5/10.0
- Schools +5.0/10.0
- 1% rule +4.8/10.0
- Cash flow +4.3/30.0
- Livability +4.0/5.0
- Rent growth +3.4/5.0
- Condition / age +2.5/5.0
- DSCR +0.0/10.0
$450,000
🖨 Deal sheet (PDF) 📄 Offer letter ✓ Due diligence
Listing remarks
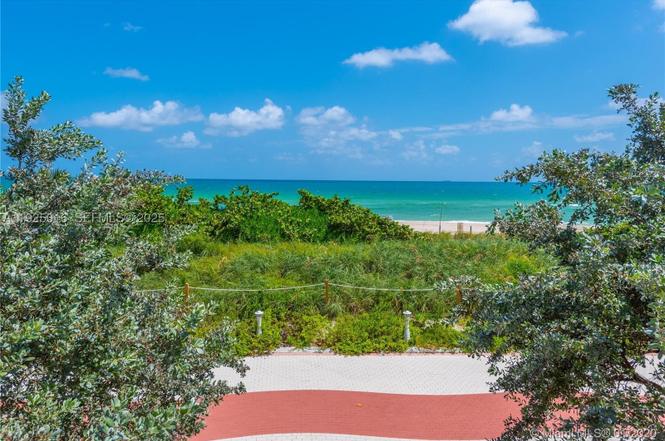
HUGE PRICE REDUCTION. OWNER MOTIVATED. Enjoy this amazing direct bay views from every room and huge balcony. Updated new kitchen, bathroom and floors. This large unit features a resort style, ocean front luxury condo on millionaire's row by iconic architect MORRIS LAPIDUS, including onsite famous restaurant "Lola", penthouse gym overlooking the ocean and a brand new pool deck, jacuzzi expected to open this summer 2026. Equal Housing Opportunity
Key facts
- Brand new kitchen
- Remodeled bathroom
- Huge balcony
Tags
Property features AI
Finance
- Financial info: Pets allowed with restrictions or possible restrictions (conditional)
- HOA & community: Monthly HOA with additional quarterly fee; Association covers management, common areas, cable TV, HVAC, hot water, laundry, parking, pool(s), sewer, security and water; Association amenities include basketball court, billiard room, business center, cabana, clubhouse, fitness center, pool, tennis courts, trash service and elevators
Exterior
- Parking: Garage with 1 covered space (one-space garage)
- Security: Security system; Closed-circuit cameras; Elevator secured; Fire alarm; Lobby secured; Security guard; Smoke detectors
- Utilities: Water and sewer included in association amenities; Power with central HVAC
- Home design: Waterfront property with bay front and canal front and intracoastal access; Has view; Entry on level 7; Attached property
- Construction: Block construction; Resale property
- Exterior features: Balcony; Open balcony/patio; Courtyard; Tennis court(s); Association heated pool
Interior
- Kitchen: Icemaker; Refrigerator
- Bedrooms: Bedroom on main level
- Flooring: Tile
- Bathrooms: 2 full bathrooms
- Heating & cooling: Central heating; Central air conditioning
- Interior features: Impact glass windows; Furnishing negotiable; Elevator
- Laundry & utility: Laundry included in association amenities
Neighborhood map
What this means for you Summary
Snapshot
- This is a 1-bed/2.0-bath condo listed at $450k.
Deal economics
- At list price, monthly cash flow is $-2k ($-19k/yr) — negative.
- To cash-flow at today's rent, offer at most $442k (1.8% below list).
- To meet the 1% rule (rent ≥ 1% of price), the offer needs to be $440k (2.3% below list).
- Recommended offer: $396k (12.0% below list) — sets the bar for market timing.
- Cap rate 3.1% vs local median 1.5% in Miami Beach — top-decile yield for the area; either an underpriced asset or a hidden risk that comps aren't pricing in. Stress-test before assuming the spread holds.
Location & tenants
- Location reads 80/100 on livability (#108 in FL, #1,672 nationally) — a professional / high-income tenant draw. Strengths: crime A+, commute A+, health & safety A+; Watch: housing C-, amenities D-, cost of living F.
- Market conditions: Rents rising (+3.5%/yr); 670 active listings in the ZIP; 1 comparable units currently listed for rent nearby; solid renter incomes; 10,051 units permitted in Miami-Dade County in 2024 (7,758 in 5+ unit buildings).
- At $4,396/mo this rent would consume 49% of the median local household income ($107k/yr) (locally 870% of renters already pay >50% of income on rent) — very limited rent-growth headroom before tenants either downsize or default.
Forward outlook
- In year one you build about $7k of equity ($3k loan paydown + $4k appreciation (1.0% local appreciation)).
- Miami-Dade County population projected at +28% by 2050 — long-run rental-demand tailwind backs the buy-and-hold thesis.
- By year 5, paydown + projected appreciation supports a ~$35k cash-out refi (75% LTV) — recoverable capital for the next deal without selling this one.
Negotiation context
- It's been on market 197 days — a 12% lower offer ($396k) is reasonable based on typical stale-listing flexibility.
- 20 sale attempts since 12y ago; this cycle's ask is 14900% above the opening price — seller raised mid-cycle; expect resistance to lowballs.
Risks & watch-outs
- Watch-outs: flood insurance adds $427/mo; HOA is 36% of rent.
- Climate carrying-cost: in FEMA flood zone AE (mandatory federal flood insurance); severe wind risk, 99% chance of damaging wind over 30y; extreme-heat days projected 7→27/yr by 2055 (HVAC capex compounding) — expect insurance premiums to compound above CPI over the hold.
Questions for the listing agent
- What do current leases actually rent for vs. the listed asking? Can we see a recent rent roll and the last 12 months of T-12 income?
- It's been on market 197 days. Have you received any prior offers? Is the seller open to a 12% concession, seller financing, or rate buy-down credit?
- Built in 1967 — when were the roof, HVAC, electrical panel, plumbing, and water heater last replaced?
- What's the actual annual flood-insurance premium (NFIP or private), and is the property in a SFHA with mandatory coverage?
- What does the HOA fee cover, when was the last increase, and are there any pending special assessments or reserve-fund shortfalls?
- Any open or pending special assessments — roof, HVAC, plumbing, elevator, façade? What's the per-unit balance and payoff schedule, and is the seller paying it off at close or rolling it to the buyer?
- Why hasn't it sold? Are there any deal-killer items the seller is aware of (foundation, flood, title, zoning, code violations)?
- Is there a deadline driving the sale (1031 exchange, divorce, estate, relocation)? That informs how much negotiation room exists.
- Schools are A-rated — typically a magnet for longer-tenancy family renters. What's the average tenant stay here, and is there a school-zone premium baked into asking?
- The area grade is low — what's the realistic commute time and amenity access for the typical tenant pool here? Any planned neighborhood developments (good or bad) we should know about?
- What's the average days-on-market for RENTAL listings here right now (not sales)? A rising rental-DOM trend means longer vacancies and softer asking-rent achievability than the comps imply.
- What's the recent tenant-quality profile in this submarket — average credit score on applications, eviction rate, late-payment / NSF rate, and stable-employment percentage? A property-management company in the area should have these aggregated.
- How much new apartment / multifamily construction is in the pipeline within 1–3 miles? Heavy new supply (>2% of stock underway) typically softens rents 12–24 months out; light construction supports rent growth.
Investment metrics
- 1% rule
- 0.98% ✗
- Cap rate
- 3.11%
- Cash-on-cash
- -11.36%
- DSCR
- 0.49
- GRM
- 8.5
CMA / ARV
No comps found within radius.
Projected returns pro-forma
0.96% appreciation · 3.52% rent growth · sell at horizon
- IRR
- -14.5%
- Equity multiple
- 0.27×
- Total profit
- $-91,926
- Equity at exit
- $152,802
- IRR
- -7.3%
- Equity multiple
- 0.09×
- Total profit
- $-114,529
- Equity at exit
- $202,427
Cash invested: $126,000 (down + closing). Projections, not guarantees.
Landlord ↔ Tenant lean methodology
- Overall (STATE)
- 87 Strongly Landlord-Friendly
- State Florida
- 87 Strongly Landlord-Friendly · R+3
- County
- — inherits STATE
- City
- — inherits STATE
ZIP-level market 33140
- Home prices YoY
- 0.3%
- Rents YoY
- 3.5%
- Active inventory
- 670
- Price-to-rent
- 8.5×
Monthly cashflow live
- Estimated rent
- $4,396 medium interval (Pro) →
- Mortgage (P&I)
- −$2,360
- Tax from tax record
- −$546 /mo · $6,551/yr
- Insurance
- −$188
- Flood insurance flood zone
- −$427 /mo · $5,118/yr
- HOA est. from 12 same-building comps
- −$1,573
- Vacancy / Maint / Mgmt
- −$923
- Net cashflow
- $-1,620
Break-even live
Sensitivity live
| Price | -10% $-1,365 | -5% $-1,492 | +0% $-1,620 | +5% $-1,747 | +10% $-1,875 |
|---|---|---|---|---|---|
| Rent | -10% $-1,967 | -5% $-1,793 | +0% $-1,620 | +5% $-1,446 | +10% $-1,273 |
| Rate | -1.0pp $-1,393 | -0.5pp $-1,505 | base $-1,620 | +0.5pp $-1,736 | +1.0pp $-1,855 |
UW: 25.0% down · 7.5% · 30yr · 1.5% tax · 5.0% vac · 8.0% maint · 8.0% mgmt
Financing live
Cash to close
- Down payment
- $112,500
- Closing costs
- $13,500
- Reserves months
- —
- Total cash needed
- —
Loan-product check · same deal, 3 products live
Conventional
25% down · 7.5% · 30yr
- Down + closing
- —
- Monthly P&I
- —
- Monthly cashflow
- —
- DSCR
- —
- Eligible?
- —
Personal DTI + credit; lowest rate.
DSCR
20% down · 8.5% · 30yr
- Down + closing
- —
- Monthly P&I
- —
- Monthly cashflow
- —
- DSCR
- —
- Eligible?
- —
No personal income docs; deal must DSCR.
Hard money
10% down · 12.0% · 12mo
- Down + closing
- —
- Monthly P&I
- —
- Monthly cashflow
- —
- DSCR
- —
- Eligible?
- —
Short-term bridge; refi at stabilization.
Rent comps 1 comps
| Address | Beds | Baths | Sqft | Rent | $/sqft | DOM | Units | Dist |
|---|---|---|---|---|---|---|---|---|
| 580 72nd St Unit 1263798P Miami Beach, FL | 2.0–3.0 | 1.0–2.0 | 1194 | $7,494 | $6.28 | 2d | 2 | 1.45mi |
HOA detail condo
- Monthly dues
- $0 · $0/yr
- Likely covers
- poolgym
- Assessments
- None detected in remarks — confirm with the listing agent.
Listing history 50 events
-
2026-06-18days on market $450,000 Active 197 DOM
-
2026-06-17days on market $450,000 Active 196 DOM
-
2026-06-16days on market $450,000 Active 195 DOM
-
2026-06-15days on market $450,000 Active 194 DOM
-
2026-06-13days on market $450,000 Active 192 DOM
-
2026-06-09days on market $450,000 Active 188 DOM
-
2026-06-08days on market $450,000 Active 187 DOM
-
2026-06-07days on market $450,000 Active 186 DOM
-
2026-06-04days on market $450,000 Active 183 DOM
-
2026-06-03days on market $450,000 Active 182 DOM
-
2026-06-02days on market $450,000 Active 181 DOM
-
2026-06-01days on market $450,000 Active 180 DOM
-
2026-05-31days on market $450,000 Active 179 DOM
-
2026-05-25historical $3,000
-
2026-05-23$3,000
-
2026-05-06price $450,000
-
2026-04-22historical $3,000
-
2026-03-05price $505,000
-
2026-02-10price $3,000
-
2025-12-10$3,300
-
2025-12-03$555,000 Active
-
2025-11-09historical $3,300
-
2025-07-01$3,300
-
2025-06-26historical $4,500
-
2025-01-11$4,500
-
2024-12-07historical $4,500
-
2024-10-17$4,500
-
2024-09-27historical $3,000
-
2024-09-16$3,000
-
2024-09-06historical $3,000
-
2024-08-22price $3,000
-
2024-08-21price $3,200
-
2024-08-19price $3,500
-
2024-08-13$3,300
-
2024-07-06historical
-
2024-06-30status Active
-
2024-05-20historical $3,300
-
2024-05-17price $3,300
-
2024-04-27$3,700
-
2024-04-08historical $3,000
-
2024-04-08$3,000
-
2024-03-08historical $3,000
-
2024-02-14$3,000
-
2024-01-29historical $3,000
-
2024-01-24price $3,000
-
2024-01-19$3,300
-
2023-12-11historical $3,300
-
2023-12-06price $520,000
-
2023-12-02price $3,300
-
2023-11-01status Active
ⓘ Source: listings_history table (triggers on properties + properties_extension) + one-shot
backfill from property_details.listing_events for pre-trigger history.
Tax reassessment forecast FL · Resets to sale price
- Current annual tax
- $6,551 · $546/mo
- Projected year-2 tax
- $6,551 · $546/mo
- Expected delta
- $0/yr ($0/mo · 0.0%)
ⓘ Screening estimate from a state-policy table — verify with the county assessor before closing.
Climate risk First Street
- Flood 9/10 Extreme FEMA zone AE · 98% chance over 30 yrs
- Wildfire 1/10 Low
- Heat 10/10 Extreme 7 d/yr ≥101°F today · 27 d/yr by 30 yrs out
- Wind 10/10 Extreme 99% chance of damaging wind over 30 yrs
- Air quality 2/10 Low 1 unhealthy d/yr today · 1 by 30 yrs out
Nearby sold comps map
Loading sold comps map…
Walkable amenities ~0.75 mi
Loading nearby amenities…
Taxation est. · year 1
- Rental income
- $52,755
- − Mortgage interest
- −$25,207
- − Property taxes
- −$6,551
- − Insurance
- −$7,369
- − Repairs & maintenance
- −$4,220
- − Management
- −$4,220
- − HOA
- −$18,876
- − Depreciation
- −$13,091
- Taxable loss
- −$26,780
- Est. tax savings @ 24.0%
- +$6,427
- After-tax cash flow
- $-13,011/yr
For passive investors: Depreciation is non-cash, so a rental often shows a tax loss while cash-flowing — sheltering income. Rental losses are passive: they offset passive income freely, and up to $25,000/yr can offset ordinary (W-2) income if you actively participate and your MAGI is under $100k (phasing out to $0 by $150k); unused losses carry forward. On sale, claimed depreciation is recaptured at up to 25%, and gains may owe capital-gains tax (a 1031 exchange can defer both). Figures are a year-1 estimate at your 24.0% rate — not tax advice; consult a CPA.
Schools (NCES district)
No district data.
Livability — Miami Beach
- Score
- 80/100
- State rank
- #108
- US rank
- #1672
Category grades
Schools grade is shown separately in the Schools card above.
Census & demographics
- Census place
- Miami Beach, FL
- County
- Miami-Dade County · 2,697,751 people
- City population
- 90,533
- Metro
- Miami-Fort Lauderdale-Pompano Beach, FL
- Population (ZIP)
- 20,342
- Household income
- $107,063
- Rent vs Own
- Severe rent burden
- 870.0
Population outlook (Miami-Dade County) Hauer SSP2
- Today (2025)
- 3,126,439 people
- By 2030
- 3,325,765 · +6.4%
- By 2040
- 3,697,561 · +18.3%
- By 2050
- 4,012,134 · +28.3%
- By 2075
- 4,605,612 · +47.3%
- By 2100
- 4,866,598 · +55.7%
Race, ethnicity, and origin ACS 2023
- Neighborhood character
- Diverse neighborhood (Simpson 0.59)
- Race & ethnicity
- White 46% Hispanic / Latino 44% Two or more races 23% Black 3% Asian 2%
- Hispanic origin (detail)
- Mexican 2% Puerto Rican 2% Cuban 19% Salvadoran 6%
- Common ancestry
- Scotch-Irish 5% Romanian 3% Italian 3%
- Foreign-born
- 44% · Canada, Dominican Republic, Jamaica
- Languages at home
- 43% English-only · Spanish 45% Other Indo-European 6% French/Haitian/Cajun 2%
Political lean MEDSL · Miami-Dade
- 2024 margin
- R (+11.4) · D 43.9% · R 55.4%
- 2008→2024 swing
- -27.6pp toward R · 2008: 16.1pp · 2024: -11.4pp
- All cycles
- 2024: R+11.4 2020: D+7.3 2016: D+29.6 2012: D+23.7 2008: D+16.1
Not yet ingested
- Civics
- —
Market trends
- HPI YoY
- ▲ 0.96%
- Current HPI
- 302.8514
- Rent YoY
- ▲ 3.52%
- Metro
- Miami-Fort Lauderdale-Pompano Beach, FL
- State GDP YoY
- ▲ 3.28%
- F500 in state
- 36
Industry mix (Fortune 500 HQ in FL)
| Industry | F500 HQs | Revenue |
|---|---|---|
| Industrial Technology | 2 | $29B |
|
||
| Insurance | 2 | $17B |
|
||
| Retail | 1 | $60B |
|
||
| Technology Distribution | 1 | $58B |
|
||
| Homebuilding | 1 | $35B |
|
||
| Technology Manufacturing | 1 | $35B |
|
||
Price history
-97.2% since first listed65 events — show timeline
- 2026-05-25 Rental Removed $3,000 MARMLS
- 2026-05-23 Listed for Rent $3,000 MARMLS
- 2026-05-06 Price Changed $450,000 MARMLS
- 2026-04-22 Rental Removed $3,000 MARMLS
- 2026-03-05 Price Changed $505,000 MARMLS
- 2026-02-10 Price Changed $3,000 MARMLS
- 2025-12-10 Listed for Rent $3,300 MARMLS
- 2025-12-03 Listed $555,000 MARMLS
- 2025-11-09 Rental Removed $3,300 MARMLS
- 2025-07-01 Listed for Rent $3,300 MARMLS
- 2025-06-26 Rental Removed $4,500 MARMLS
- 2025-01-11 Listed for Rent $4,500 MARMLS
- 2024-12-07 Rental Removed $4,500 MARMLS
- 2024-10-17 Listed for Rent $4,500 MARMLS
- 2024-09-27 Rental Removed $3,000 MARMLS
- 2024-09-16 Listed for Rent $3,000 MARMLS
- 2024-09-06 Rental Removed $3,000 MARMLS
- 2024-08-22 Price Changed $3,000 MARMLS
- 2024-08-21 Price Changed $3,200 MARMLS
- 2024-08-19 Price Changed $3,500 MARMLS
- 2024-08-13 Listed for Rent $3,300 MARMLS
- 2024-07-06 Listing Removed — MARMLS
- 2024-06-30 Relisted — MARMLS
- 2024-05-20 Rental Removed $3,300 MARMLS
- 2024-05-17 Price Changed $3,300 MARMLS
- 2024-04-27 Listed for Rent $3,700 MARMLS
- 2024-04-08 Rental Removed $3,000 MARMLS
- 2024-04-08 Listed for Rent $3,000 MARMLS
- 2024-03-08 Rental Removed $3,000 MARMLS
- 2024-02-14 Listed for Rent $3,000 MARMLS
- 2024-01-29 Rental Removed $3,000 MARMLS
- 2024-01-24 Price Changed $3,000 MARMLS
- 2024-01-19 Listed for Rent $3,300 MARMLS
- 2023-12-11 Rental Removed $3,300 MARMLS
- 2023-12-06 Price Changed $520,000 MARMLS
- 2023-12-02 Price Changed $3,300 MARMLS
- 2023-11-01 Relisted — MARMLS
- 2023-10-31 Listed for Rent $3,500 MARMLS
- 2023-08-14 Rental Removed $3,500 MARMLS
- 2023-08-10 Price Changed $3,500 MARMLS
- 2023-08-05 Listed for Rent $3,800 MARMLS
- 2023-07-28 Rental Removed $3,100 MARMLS
- 2023-07-18 Price Changed $3,100 MARMLS
- 2022-06-23 Price Changed $699,000 MARMLS
- 2022-05-24 Price Changed $630,000 MARMLS
- 2022-01-27 Price Changed $578,000 MARMLS
- 2021-07-06 Listing Removed — MARMLS
- 2021-07-06 Listed $465,000 MARMLS
- 2021-03-01 Price Changed $466,000 MARMLS
- 2020-07-08 Price Changed $433,000 MARMLS
- 2020-07-06 Price Changed $422,000 MARMLS
- 2020-05-20 Price Changed $450,000 MARMLS
- 2020-01-22 Listed $460,000 MARMLS
- 2016-11-17 Sold (MLS) $405,000 MARMLS
- 2016-07-22 Sold (Public Records) $405,000 Public Records
- 2016-05-30 Pending — MARMLS
- 2016-02-29 Price Changed $435,000 MARMLS
- 2016-02-08 Price Changed $455,000 MARMLS
- 2016-01-16 Price Changed $480,000 MARMLS
- 2016-01-10 Listed $510,000 MARMLS
- 2015-02-18 Sold (MLS) $339,500 MARMLS
- 2015-01-20 Sold (Public Records) $339,500 Public Records
- 2014-10-19 Pending — MARMLS
- 2014-10-07 Listed $369,000 MARMLS
- 1992-12-29 Sold (Public Records) $109,000 Public Records
Property tax history
+10.4%/yrLatest (2025): $6,551 · +5.9% YoY. Source: county tax records.
Cash-flow waterfall
monthlySold comps — $/sqft
last 12 mo · ≤1 miLoading sold comps…