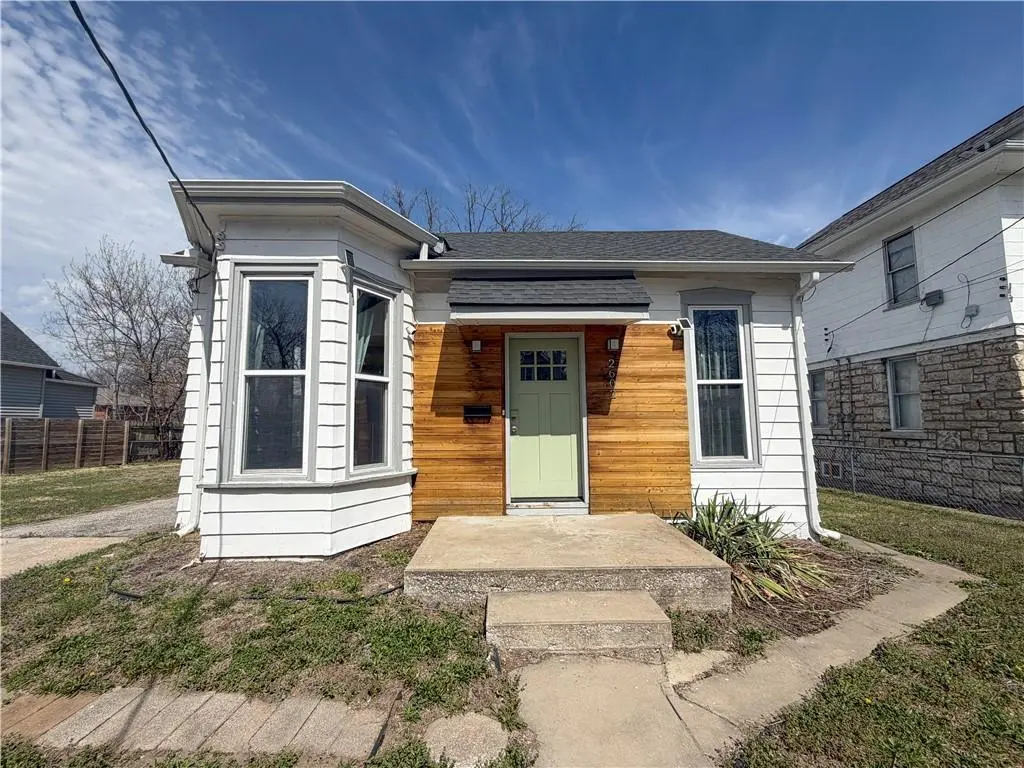
2602 Essex Ave · Kansas City, KS
Flood risk 1/10 · Minimal
- FEMA flood zone
- X (unshaded)
- Chance of flooding over 30 yrs
- 0.0%
- Est. flood insurance / yr
- $473 – $860
Fire risk 1/10 · Minimal
- Est. fire insurance / yr
- $1,154 – $2,142
Heat risk 4/10 · Minor
- Hot days now (above 106°F)
- 7 days/yr
- Hot days in 30 yrs
- 17 days/yr
Wind risk 2/10 · Minimal
- Chance of severe wind over 30 yrs
- —
Air-quality risk 3/10 · Minor
- Unhealthy air days now
- 2 days/yr
- Unhealthy air days in 30 yrs
- 3 days/yr
Risk factors via First Street. Map © Google.
Why this score? — see what drove the D+ grade
The composite is a weighted blend of 9 inputs, each scored 0–100. Each bar is that input's sub-score; the figure is the points it added to the 100-point composite (weight × sub-score).
- ARV discount +15.0/15.0
- Cash flow +14.0/30.0
- 1% rule +4.7/10.0
- DSCR +4.3/10.0
- Rent growth +3.9/5.0
- Livability +3.6/5.0
- Condition / age +2.5/5.0
- Schools +0.9/10.0
- Appreciation +0.0/10.0
$149,950
🖨 Deal sheet 📄 Offer letter ✓ Due diligence
Listing remarks MLS
Do not Miss out on this Beautifully Refinished Updated Bungalow! Picture Perfect! Professional Remodel features Beautiful New Floors, New Stainless Steel Appliances, Kitchen features New Cabinets, New Countertops and New Back Splash. Updated and Remodeled Bathroom! Fresh New Interior/Exterior paint!! HUGE LOT!!!! Great Location!
Key facts
- Highway access
- Shopping
- Bungalow
Tags
Property features AI
Finance
- Other: Approx. 1,104 above-grade living area; Lot approximately 8,276 square feet; Age approximately 76-100 years
- HOA & community: No association fees
Exterior
- Parking: Off-street parking
- Utilities: Public water; Public sewer
- Home design: Single-family residence; Bungalow style
- Construction: Frame construction; Composition roof; Has basement (cellar, inside entrance, partial)
- Exterior features: Patio
Interior
- Bedrooms: 2 bedrooms
- Bathrooms: 1 full bathroom
- Heating & cooling: Forced air heating; Electric cooling
- Interior features: Bungalow floor plan; Living and dining combined
Neighborhood map
What this means for you Summary
Snapshot
- This is a 2-bed/1.0-bath single-family listed at $150k.
Deal economics
- At list price, monthly cash flow is $20 ($243/yr) — positive.
- The deal already cash-flows at list — no discount required.
- To meet the 1% rule (rent ≥ 1% of price), the offer needs to be $145k (3.1% below list).
- Recommended offer: $145k (3.1% below list) — sets the bar for 1% rule.
- Cap rate 6.5% vs local median 4.8% in Kansas City — top-decile yield for the area; either an underpriced asset or a hidden risk that comps aren't pricing in. Stress-test before assuming the spread holds.
Location & tenants
- Location reads 72/100 on livability (#103 in KS) — a middle-class / working-renter tenant base. Strengths: commute A+, cost of living A+, housing A+; Watch: crime F, employment D-.
- Kansas City (urban): math 8% / reading 15% proficiency, ranked #169 of 169 in KS (top 100%) — low school quality limits family demand, transient renter base, plan for 1-2y turnover; 81% free/reduced lunch — lower-income household profile, screen leases tightly.
- Zoned schools: Frank Rushton Elem (math 17% / reading 32%, grade F, #540 of 684 statewide, top 82%, 311 students, 84% FRL); J C Harmon High (math 0% / reading 4%, grade F, #326 of 327 statewide, top 100%, 1,330 students, 79% FRL) — zoned schools at 81% FRL track the district average.
- Market conditions: Rents rising fast (+5.8%/yr); 57 active listings in the ZIP; 40 comparable units currently listed for rent nearby; rentals at typical pace (median 24d on market — plan ~3-4 weeks tenant-placement turnaround); 40% of comp listings sitting > 30 days — soft ceiling on asking rent; 369 units permitted in Wyandotte County in 2024 (236 in 5+ unit buildings).
- This rent runs 33% of the median local income ($52k/yr) — at the standard rent-burdened threshold; future hikes will face affordability resistance.
Forward outlook
- Local home prices are declining (-3.0%/yr); year-one equity from $1k of loan paydown is wiped out by about $4k of value loss. Plan a longer hold.
- Wyandotte County population projected at +17% by 2050 — long-run rental-demand tailwind backs the buy-and-hold thesis.
Negotiation context
- It's been on market 38 days — a 3% lower offer ($145k) is reasonable based on typical stale-listing flexibility.
- 7 sale attempts since 21y ago; this cycle's ask has dropped $10k (6%) from the opening price — seller is motivated, your offer sets the floor, not the list.
Risks & watch-outs
- Watch-outs: built in 1935 — expect roof / HVAC / electrical / plumbing capex.
Questions for the listing agent
- It's been on market 38 days. Have you received any prior offers? Is the seller open to a 3% concession, seller financing, or rate buy-down credit?
- Built in 1935 — when were the roof, HVAC, electrical panel, plumbing, and water heater last replaced?
- Is there a deadline driving the sale (1031 exchange, divorce, estate, relocation)? That informs how much negotiation room exists.
- Schools are F-rated, which usually means shorter tenancies and higher turnover. Who's the typical renter profile here, and what's been the actual vacancy rate?
- Crime grade is F in this area — have there been break-ins, vandalism, or insurance claims at this property in the last 3 years? What carrier currently insures it and at what premium?
- The area grade is low — what's the realistic commute time and amenity access for the typical tenant pool here? Any planned neighborhood developments (good or bad) we should know about?
- What's the average days-on-market for RENTAL listings here right now (not sales)? A rising rental-DOM trend means longer vacancies and softer asking-rent achievability than the comps imply.
- What's the recent tenant-quality profile in this submarket — average credit score on applications, eviction rate, late-payment / NSF rate, and stable-employment percentage? A property-management company in the area should have these aggregated.
- How much new for-sale + rental construction is in the pipeline within 1–3 miles? Heavy new supply typically softens prices + rents 12–24 months out; constrained supply supports both.
Investment metrics
- 1% rule
- 0.97% ✗
- Cap rate
- 6.45%
- Cash-on-cash
- 0.58%
- DSCR
- 1.03
- GRM
- 8.6
CMA / ARV
- ARV (on-the-fly)
- $278,208
- Comps found
- 12
Show comp detail 12 sales within ~0.75 mi
| Address | Dist | Beds/Ba | Sqft | Sold | Price | $/sf | Match |
|---|---|---|---|---|---|---|---|
| 4218 Wyoming St | 0.60mi | 2/1.0 | 1,056 (-4%) | 1mo | $250,000 | $237 | 64 |
| 4403 Genessee St | 0.59mi | 2/1.0 | 1,124 (+2%) | 8mo | $300,000 | $267 | 62 |
| 2806 W 48th St | 0.64mi | 3/1.5 (+1) | 1,112 (+1%) | 6mo | $300,000 | $270 | 57 |
| 3953 Wyoming St | 0.71mi | 2/1.0 | 1,053 (-5%) | 4mo | $260,000 | $247 | 55 |
| 4528 Genessee St | 0.65mi | 2/2.0 | 1,180 (+7%) | 4mo | $340,000 | $288 | 51 |
| 4530 Bell St | 0.62mi | 2/1.5 | 1,208 (+9%) | 4mo | $239,000 | $198 | 50 |
| 2625 W 47th Ter | 0.63mi | 3/2.0 (+1) | 1,192 (+8%) | 1mo | $299,900 | $252 | 48 |
| 4210 Terrace St | 0.66mi | 2/1.0 | 1,252 (+13%) | 0mo | $275,000 | $220 | 47 |
| 4222 Bell St | 0.49mi | 2/1.5 | 1,258 (+14%) | 8mo | $315,000 | $250 | 46 |
| 4130 Mercier St | 0.73mi | 3/1.5 (+1) | 1,190 (+8%) | 0mo | $299,900 | $252 | 46 |
| 4525 Bell St | 0.63mi | 2/1.0 | 1,260 (+14%) | 3mo | $265,000 | $210 | 45 |
| 4523 Wyoming St | 0.69mi | 3/2.0 (+1) | 1,248 (+13%) | 5mo | $315,000 | $252 | 33 |
Match score weights: distance 35% · size 25% · config 20% · recency 20%. Top-matched comps best support the ARV.
Projected returns pro-forma
-3.0% appreciation · 5.78% rent growth · sell at horizon
- IRR
- -12.0%
- Equity multiple
- 0.55×
- Total profit
- $-18,753
- Equity at exit
- $22,358
- IRR
- 1.1%
- Equity multiple
- 1.09×
- Total profit
- $3,802
- Equity at exit
- $12,965
Cash invested: $41,986 (down + closing). Projections, not guarantees.
Landlord ↔ Tenant lean methodology
- Overall (STATE)
- 83 Strongly Landlord-Friendly
- State Kansas
- 83 Strongly Landlord-Friendly · R+10
- County
- — inherits STATE
- City
- — inherits STATE
ZIP-level market 66103
- Home prices YoY
- -20.2%
- Rents YoY
- 5.8%
- Active inventory
- 57
- Price-to-rent
- 8.6×
Monthly cashflow live
- Estimated rent
- $1,454 high interval (Pro) →
- Mortgage (P&I)
- −$786
- Tax from tax record
- −$279 /mo · $3,351/yr
- Insurance
- −$62
- HOA
- −$0
- Vacancy / Maint / Mgmt
- −$305
- Net cashflow
- $20
Break-even live
UW: 25.0% down · 7.5% · 30yr · 1.5% tax · 5.0% vac · 8.0% maint · 8.0% mgmt
Financing live
Cash to close
- Down payment
- $37,488
- Closing costs
- $4,498
- Reserves months
- —
- Total cash needed
- —
Loan-product check · same deal, 3 products live
Conventional
25% down · 7.5% · 30yr
- Down + closing
- —
- Monthly P&I
- —
- Monthly cashflow
- —
- DSCR
- —
- Eligible?
- —
Personal DTI + credit; lowest rate.
DSCR
20% down · 8.5% · 30yr
- Down + closing
- —
- Monthly P&I
- —
- Monthly cashflow
- —
- DSCR
- —
- Eligible?
- —
No personal income docs; deal must DSCR.
Hard money
10% down · 12.0% · 12mo
- Down + closing
- —
- Monthly P&I
- —
- Monthly cashflow
- —
- DSCR
- —
- Eligible?
- —
Short-term bridge; refi at stabilization.
Rent comps 40 comps
| Address | Beds | Baths | Sqft | Rent | $/sqft | DOM | Units | Dist |
|---|---|---|---|---|---|---|---|---|
| 4015 State Line Rd Kansas City, MO | 1.0 | 1.0 | 750 | $1,425 | $1.90 | 43d | 1 | 0.55mi |
| 1807 W 41st St Unit 2W Kansas City, MO | 1.0 | 1.0 | 800 | $1,095 | $1.37 | 43d | 1 | 0.55mi |
| 1802 W 41st St Kansas City, MO | 1.0 | 1.0 | 750 | $1,425 | $1.90 | 23d | 2 | 0.57mi |
| 1800 W 41st St Unit 4015 1N (Stateline) Kansas City, MO | 1.0 | 1.0 | 750 | $1,425 | $1.90 | 43d | 1 | 0.57mi |
| 2200 W 47th Pl Mission, KS | 3.0 | 1.0–2.0 | 1053 | $4,462 | $4.24 | 2d | 3 | 0.57mi |
| 3939 State Line Rd Kansas City, MO | 2.0 | 1.0–2.0 | 939 | $2,740 | $2.92 | 4d | 53 | 0.59mi |
| 4438 Genessee St Kansas City, MO | 2.0 | 1.0 | 792 | $1,550 | $1.96 | 43d | 1 | 0.61mi |
| 3600 Rainbow Blvd Kansas City, KS | 2.0 | 1.0–2.0 | 811 | $3,310 | $4.08 | 10d | 38 | 0.64mi |
| 3895 State Line Rd Kansas City, MO | 1.0–2.0 | 1.0–2.0 | 802 | $4,594 | $5.72 | 10d | 1 | 0.66mi |
| 4328 Roanoke Pkwy Kansas City, MO | 1.0 | 1.0 | 700 | $1,250 | $1.79 | 43d | 1 | 0.75mi |
| 4325 Roanoke Pkwy Unit 4315-1N Kansas City, MO | 1.0 | 1.0 | 1000 | $1,300 | $1.30 | 43d | 1 | 0.76mi |
| 4329 Roanoke Pkwy Kansas City, MO | 2.0 | 1.0 | 1000 | $1,250 | $1.25 | 4d | 1 | 0.77mi |
| 3607 W 47th St Roeland Park, KS | 2.0 | 1.0 | 863 | $1,395 | $1.62 | 14d | 1 | 0.79mi |
| 4401 Roanoke Pkwy Kansas City, MO | 2.0 | 1.0 | 950 | $1,380 | $1.45 | 43d | 1 | 0.79mi |
| 3609 W 47th St Roeland Park, KS | 2.0 | 1.0 | 863 | $1,395 | $1.62 | 14d | 1 | 0.80mi |
| 4339 Mercier St Kansas City, MO | 2.0 | 1.0 | 1060 | $1,595 | $1.50 | 43d | 1 | 0.80mi |
| 4339 Mercier St Kansas City, MO | 2.0 | 1.0 | 1060 | $1,424 | $1.34 | 17d | 1 | 0.80mi |
| 4341 Mercier St Kansas City, MO | 2.0 | 1.0 | 1060 | $1,595 | $1.50 | 43d | 1 | 0.81mi |
| 4329 Mercier St Kansas City, MO | 1.0 | 1.0 | 750 | $1,225 | $1.63 | 2d | 1 | 0.81mi |
| 4331 Mercier St Kansas City, MO | 1.0 | 1.0 | 750 | $1,225 | $1.63 | 12d | 1 | 0.81mi |
| 4312 Holly St Apt 2 Kansas City, MO | 2.0 | 1.0 | 1000 | $1,225 | $1.23 | 43d | 1 | 0.83mi |
| 4419 Roanoke Pkwy Kansas City, MO | 2.0 | 1.0 | 950 | $1,380 | $1.45 | 43d | 1 | 0.83mi |
| 4410 Holly St Kansas City, MO | 1.0 | 1.0 | 920 | $1,196 | $1.30 | 17d | 1 | 0.84mi |
| 4121 Holly St Unit 2 Kansas City, MO | 3.0 | 1.0 | 950 | $1,150 | $1.21 | 7d | 1 | 0.84mi |
| 4440 Roanoke Pkwy Kansas City, MO | 2.0 | 1.0 | 611 | $1,400 | $2.29 | 2d | 16 | 0.85mi |
| 4315 Holly St Unit A Kansas City, MO | 2.0 | 2.5 | 1000 | $1,795 | $1.79 | 43d | 1 | 0.86mi |
| 4439 Roanoke Pkwy Kansas City, MO | 1.0–2.0 | 1.0 | 935 | $1,495 | $1.60 | 7d | 7 | 0.86mi |
| 1114 W 45th St Kansas City, MO | 2.0 | 1.0 | 900 | $1,450 | $1.61 | 14d | 1 | 0.89mi |
| 4524 Holly St Kansas City, MO | 2.0 | 1.0 | 960 | $1,600 | $1.67 | 23d | 1 | 0.90mi |
| 4524 Holly St Kansas City, MO | 2.0 | 1.0 | 925 | $1,700 | $1.84 | 43d | 1 | 0.90mi |
| 4420 Jarboe St Kansas City, MO | 3.0 | 3.0 | 1500 | $2,175 | $1.45 | 23d | 1 | 0.91mi |
| 4420 Jarboe St Kansas City, MO | 3.0 | 3.0 | 1500 | $2,200 | $1.47 | 4d | 1 | 0.91mi |
| 4420 Jarboe St Unit 4420-1A Kansas City, MO | 3.0 | 3.0 | 1500 | $2,175 | $1.45 | 43d | 1 | 0.91mi |
| 4420 Jarboe St Unit 44203-C Kansas City, MO | 3.0 | 3.0 | 1500 | $2,150 | $1.43 | 43d | 1 | 0.91mi |
| 936 W 42nd St Kansas City, MO | 2.0 | 1.0 | 963 | $1,475 | $1.53 | 43d | 1 | 0.91mi |
| 4428 Jarboe St #1 Kansas City, MO | 2.0 | 1.0 | 890 | $1,375 | $1.54 | 21d | 1 | 0.91mi |
| 3700 Wyoming St Unit 103 Kansas City, MO | 1.0 | 1.0 | 750 | $950 | $1.27 | 19d | 1 | 0.91mi |
| 1107 W 45th St Kansas City, MO | 2.0 | 1.0 | 975 | $1,450 | $1.49 | 23d | 1 | 0.93mi |
| 4440 Jarboe St Kansas City, MO | 2.0 | 1.0 | 822 | $1,390 | $1.69 | 2d | 1 | 0.93mi |
| 1112 W 41st Ter Unit 1E Kansas City, MO | 1.0 | 1.0 | 700 | $895 | $1.28 | 23d | 1 | 0.93mi |
Listing history 18 events
-
2026-05-22status Pending
-
2026-04-29price $149,950
-
2026-04-27status Active
-
2026-04-09status Pending
-
2026-03-27$159,950 Active
-
2021-04-26historical 330-char remark
Show marketing remark (330 chars)
Do not Miss out on this Beautifully Refinished Updated Bungalow! Picture Perfect! Professional Remodel features Beautiful New Floors, New Stainless Steel Appliances, Kitchen features New Cabinets, New Countertops and New Back Splash. Updated and Remodeled Bathroom! Fresh New Interior/Exterior paint!! HUGE LOT!!!! Great Location!
-
2021-04-15$189,500 Active 330-char remark
Show marketing remark (330 chars)
Do not Miss out on this Beautifully Refinished Updated Bungalow! Picture Perfect! Professional Remodel features Beautiful New Floors, New Stainless Steel Appliances, Kitchen features New Cabinets, New Countertops and New Back Splash. Updated and Remodeled Bathroom! Fresh New Interior/Exterior paint!! HUGE LOT!!!! Great Location!
-
2020-12-29soldstatus
-
2010-07-31historical 652-char remark
Show marketing remark (652 chars)
Major Price Reduction! Spectacular Renovation! Incredible Value! Walk to KU Med & 39th Street Restaurants. New Roof, AC/Furnace, Appliances, Interior & Exterior Paint, Carpet, Windows, Updated Plumbing & Electrical. Updated Kitchen & Bath! Tall Ceilings, Beautiful Woodwork, Large Bedrooms & Bathroom, Renovations by Kimberly of Corder Capital Mgt. New Interior Doors, Asphalt Driveway, Thermal Windows, Interior & Exterior Light Fixtures, All Window Treatments Included, Private Street. Location, Location, Location! Minutes to Westport, Plaza, Waldo, Downtown, Brookside. Close to I-35. This One is Worth a Look!!!
-
2010-06-18$59,900 652-char remark
Show marketing remark (652 chars)
Major Price Reduction! Spectacular Renovation! Incredible Value! Walk to KU Med & 39th Street Restaurants. New Roof, AC/Furnace, Appliances, Interior & Exterior Paint, Carpet, Windows, Updated Plumbing & Electrical. Updated Kitchen & Bath! Tall Ceilings, Beautiful Woodwork, Large Bedrooms & Bathroom, Renovations by Kimberly of Corder Capital Mgt. New Interior Doors, Asphalt Driveway, Thermal Windows, Interior & Exterior Light Fixtures, All Window Treatments Included, Private Street. Location, Location, Location! Minutes to Westport, Plaza, Waldo, Downtown, Brookside. Close to I-35. This One is Worth a Look!!!
-
2010-05-31historical
-
2009-12-01$69,900
-
2009-10-07soldstatus
-
2009-09-29soldstatus
-
2009-08-03$34,000
-
2005-12-20soldstatus
-
2005-12-16soldstatus
-
2005-11-09$59,950
ⓘ Source: listings_history table (triggers on properties + properties_extension) + one-shot
backfill from property_details.listing_events for pre-trigger history.
Tax reassessment forecast KS · Resets to sale price
- Current annual tax
- $3,351 · $279/mo
- Projected year-2 tax
- $3,351 · $279/mo
- Expected delta
- $0/yr ($0/mo · 0.0%)
ⓘ Screening estimate from a state-policy table — verify with the county assessor before closing.
Climate risk First Street
- Flood 1/10 Low FEMA zone X (unshaded) · 0% chance over 30 yrs
- Wildfire 1/10 Low
- Heat 4/10 Moderate 7 d/yr ≥106°F today · 17 d/yr by 30 yrs out
- Wind 2/10 Low
- Air quality 3/10 Moderate 2 unhealthy d/yr today · 3 by 30 yrs out
Nearby sold comps map
Loading sold comps map…
Walkable amenities ~0.75 mi
Loading nearby amenities…
Taxation est. · year 1
- Rental income
- $17,443
- − Mortgage interest
- −$8,400
- − Property taxes
- −$3,351
- − Insurance
- −$750
- − Repairs & maintenance
- −$1,395
- − Management
- −$1,395
- − Depreciation
- −$4,362
- Taxable loss
- −$2,211
- Est. tax savings @ 24.0%
- +$531
- After-tax cash flow
- $773/yr
For passive investors: Depreciation is non-cash, so a rental often shows a tax loss while cash-flowing — sheltering income. Rental losses are passive: they offset passive income freely, and up to $25,000/yr can offset ordinary (W-2) income if you actively participate and your MAGI is under $100k (phasing out to $0 by $150k); unused losses carry forward. On sale, claimed depreciation is recaptured at up to 25%, and gains may owe capital-gains tax (a 1031 exchange can defer both). Figures are a year-1 estimate at your 24.0% rate — not tax advice; consult a CPA.
Schools (NCES district)
- District
- Kansas City
- NCES district ID
- 2007950
- Math proficiency
- 8% ▼ -10.00%
- Reading proficiency
- 15% ▼ -4.00%
- Median HH income
- $34,774
- Composite
- 9.38/100
- National rank
- #9856
- State rank
- #169 of 169 in KS
Livability — Kansas City
- Score
- 72/100
- State rank
- #103
- US rank
- #6054
Category grades
Schools grade is shown separately in the Schools card above.
Census & demographics
- Census place
- Kansas City, KS
- County
- Wyandotte County · 130,206 people
- City population
- 130,206
- Metro
- Kansas City, MO-KS
- Population (ZIP)
- 12,730
- Household income
- $52,479
- Rent vs Own
- Severe rent burden
- 805.0
Population outlook (Wyandotte County) Hauer SSP2
- Today (2025)
- 177,063 people
- By 2030
- 183,212 · +3.5%
- By 2040
- 195,697 · +10.5%
- By 2050
- 207,897 · +17.4%
- By 2075
- 236,169 · +33.4%
- By 2100
- 255,790 · +44.5%
Race, ethnicity, and origin ACS 2023
- Neighborhood character
- Diverse neighborhood (Simpson 0.69)
- Race & ethnicity
- White 45% Hispanic / Latino 31% Two or more races 12% Black 12% Asian 6% Native American 3%
- Hispanic origin (detail)
- Mexican 26% Puerto Rican 1%
- Common ancestry
- Lithuanian 2% Italian 1% Iranian 1%
- Foreign-born
- 16% · Canada, China, South Korea
- Languages at home
- 74% English-only · Spanish 20% Other Indo-European 1% Other Asian/Pacific 1%
Political lean MEDSL · Wyandotte
- 2024 margin
- Strong D (+23.9) · D 61.1% · R 37.3% · Other 1.6%
- 2008→2024 swing
- -17.0pp toward R · 2008: 40.9pp · 2024: 23.9pp
- All cycles
- 2024: D+23.9 2020: D+30.9 2016: D+29.1 2012: D+36.4 2008: D+40.9
Not yet ingested
- Civics
- —
Market trends
- HPI YoY
- ▼ -93.15%
- Current HPI
- 368.8332
- Rent YoY
- ▲ 5.78%
- Metro
- Kansas City, MO-KS
- State GDP YoY
- —
- F500 in state
- 0
Price history
+150.1% since first listed18 events — show timeline
- 2026-05-22 Pending — Heartland MLS as Distributed by MLS Grid
- 2026-04-29 Price Changed $149,950 Heartland MLS as Distributed by MLS Grid
- 2026-04-27 Relisted — Heartland MLS as Distributed by MLS Grid
- 2026-04-09 Pending — Heartland MLS as Distributed by MLS Grid
- 2026-03-27 Listed $159,950 Heartland MLS as Distributed by MLS Grid
- 2021-04-26 Listing Removed — Heartland MLS as Distributed by MLS Grid
- 2021-04-15 Listed $189,500 Heartland MLS as Distributed by MLS Grid
- 2020-12-29 Sold (Public Records) — Public Records
- 2010-07-31 Listing Removed — Heartland MLS as Distributed by MLS Grid
- 2010-06-18 Listed $59,900 Heartland MLS as Distributed by MLS Grid
- 2010-05-31 Listing Removed — Heartland MLS as Distributed by MLS Grid
- 2009-12-01 Listed $69,900 Heartland MLS as Distributed by MLS Grid
- 2009-10-07 Sold (Public Records) — Public Records
- 2009-09-29 Sold (MLS) — Heartland MLS as Distributed by MLS Grid
- 2009-08-03 Listed $34,000 Heartland MLS as Distributed by MLS Grid
- 2005-12-20 Sold (Public Records) — Public Records
- 2005-12-16 Sold (MLS) — Heartland MLS as Distributed by MLS Grid
- 2005-11-09 Listed $59,950 Heartland MLS as Distributed by MLS Grid
Property tax history
+8.4%/yrLatest (2025): $3,351 · +12.4% YoY. Source: county tax records.
Cash-flow waterfall
monthlySold comps — $/sqft
last 12 mo · ≤1 miLoading sold comps…