2708 Morganite Ring · San Antonio, TX
Flood risk No data
- FEMA flood zone
- —
- Chance of flooding over 30 yrs
- —
- Est. flood insurance / yr
- —
Fire risk No data
- Est. fire insurance / yr
- —
Heat risk No data
- Hot days now (above threshold)
- —
- Hot days in 30 yrs
- —
Wind risk No data
- Chance of severe wind over 30 yrs
- —
Air-quality risk No data
- Unhealthy air days now
- —
- Unhealthy air days in 30 yrs
- —
Risk factors via First Street. Map © Google.
Why this score? — see what drove the D grade
The composite is a weighted blend of 9 inputs, each scored 0–100. Each bar is that input's sub-score; the figure is the points it added to the 100-point composite (weight × sub-score).
- ARV discount +14.5/15.0
- Cash flow +8.0/30.0
- Appreciation +7.0/10.0
- Livability +4.0/5.0
- 1% rule +2.5/10.0
- Rent growth +2.5/5.0
- Condition / age +2.5/5.0
- DSCR +2.1/10.0
- Schools +1.8/10.0
$212,999
🖨 Deal sheet 📄 Offer letter ✓ Due diligence
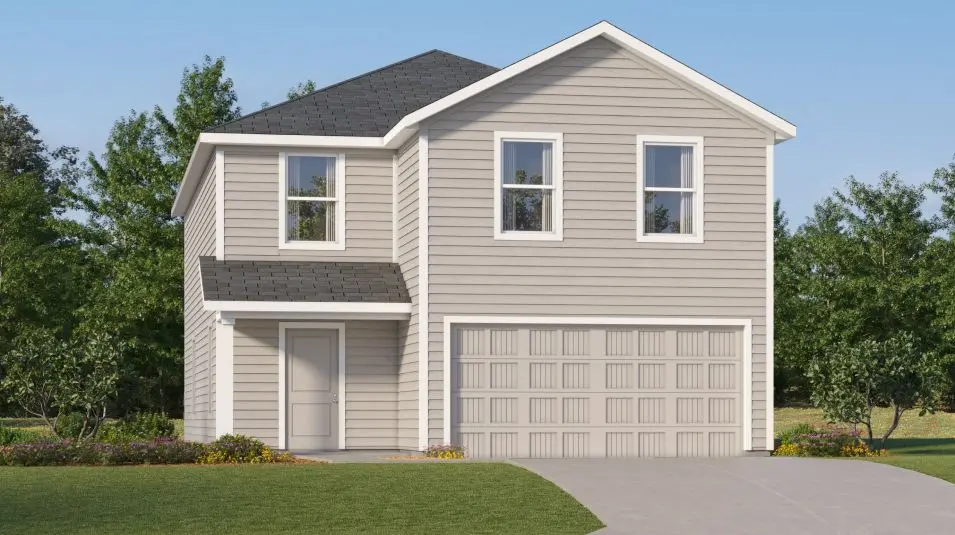
Listing remarks
This new two-story home is host to an open-concept floorplan on the first level combining the kitchen, dining area and family room for effortless entertaining and multitasking. A versatile game room is located upstairs near four bedrooms, including the luxe owner's suite with a spa-inspired bathroom and generous walk-in closet.
Key facts
- Luxe owner's suite
- Game room
- 2 garage spots
Tags
Property features AI
Finance
- Financial info: List price $222,999
Exterior
- Parking: 2 parking spaces; 2-car garage
- Home design: Single-family home; Barlow plan
Interior
- Bedrooms: 4 bedrooms
- Bathrooms: 2 full bathrooms and 1 half bathroom (2.5 total)
- Interior features: Spec new construction (Barlow plan); Living area approximately 2,173
Neighborhood map
What this means for you Summary
Snapshot
- This is a 4-bed/2.5-bath single-family listed at $213k.
Deal economics
- At list price, monthly cash flow is $-218 ($-3k/yr) — negative.
- To cash-flow at today's rent, offer at most $181k (14.8% below list).
- To meet the 1% rule (rent ≥ 1% of price), the offer needs to be $159k (25.5% below list).
- Recommended offer: $159k (25.5% below list) — sets the bar for 1% rule.
- Cap rate 5.1% vs local median 3.8% in San Antonio — top-decile yield for the area; either an underpriced asset or a hidden risk that comps aren't pricing in. Stress-test before assuming the spread holds.
Location & tenants
- Location reads 80/100 on livability (#31 in TX, #1,616 nationally) — a professional / high-income tenant draw. Strengths: amenities A+, commute A+, cost of living A+; Watch: schools C-, crime F.
- Southside ISD (rural): math 16% / reading 25% proficiency, ranked #771 of 826 in TX (top 93%) — low school quality limits family demand, transient renter base, plan for 1-2y turnover; 76% free/reduced lunch — lower-income household profile, screen leases tightly.
- Market conditions: 329 active listings in the ZIP; 3 comparable units currently listed for rent nearby; rentals lingering (median 44d on market — plan ~5-8 weeks vacancy on turnover, expect pricing pressure); 67% of comp listings sitting > 30 days — soft ceiling on asking rent; 8,308 units permitted in Bexar County in 2024 (2,506 in 5+ unit buildings).
Forward outlook
- In year one you build about $10k of equity ($1k loan paydown + $8k appreciation (3.9% local appreciation)).
- Bexar County population projected at +50% by 2050 — long-run rental-demand tailwind backs the buy-and-hold thesis.
- By year 4, paydown + projected appreciation supports a ~$33k cash-out refi (75% LTV) — recoverable capital for the next deal without selling this one.
Negotiation context
- Only 12 days on market — expect competitive offers; lowballing is unlikely to land.
Questions for the listing agent
- What do current leases actually rent for vs. the listed asking? Can we see a recent rent roll and the last 12 months of T-12 income?
- Is there a deadline driving the sale (1031 exchange, divorce, estate, relocation)? That informs how much negotiation room exists.
- Crime grade is F in this area — have there been break-ins, vandalism, or insurance claims at this property in the last 3 years? What carrier currently insures it and at what premium?
- The area grade is low — what's the realistic commute time and amenity access for the typical tenant pool here? Any planned neighborhood developments (good or bad) we should know about?
- What's the average days-on-market for RENTAL listings here right now (not sales)? A rising rental-DOM trend means longer vacancies and softer asking-rent achievability than the comps imply.
- What's the recent tenant-quality profile in this submarket — average credit score on applications, eviction rate, late-payment / NSF rate, and stable-employment percentage? A property-management company in the area should have these aggregated.
- How much new for-sale + rental construction is in the pipeline within 1–3 miles? Heavy new supply typically softens prices + rents 12–24 months out; constrained supply supports both.
Investment metrics
- 1% rule
- 0.75% ✗
- Cap rate
- 5.07%
- Cash-on-cash
- -4.38%
- DSCR
- 0.81
- GRM
- 11.2
CMA / ARV
- ARV (on-the-fly)
- $252,068
- Comps found
- 10
Show comp detail 10 sales within ~0.75 mi
| Address | Dist | Beds/Ba | Sqft | Sold | Price | $/sf | Match |
|---|---|---|---|---|---|---|---|
| 20464 Fire Stone | 0.29mi | 4/2.5 | 2,173 (0%) | 2mo | $209,999 | $97 | 85 |
| 2725 Morganite Ring | 0.05mi | 4/2.5 | 1,867 (-14%) | 1mo | $190,999 | $102 | 74 |
| 2741 Morganite Ring | 0.07mi | 4/2.5 | 1,867 (-14%) | 1mo | $222,999 | $119 | 72 |
| 20502 Andalusite Way | 0.14mi | 4/2.5 | 1,897 (-13%) | 1mo | $198,999 | $105 | 72 |
| 20518 Fire Stone | 0.28mi | 4/2.5 | 1,867 (-14%) | 5mo | $216,999 | $116 | 60 |
| 20506 Fire Stone | 0.28mi | 4/2.5 | 1,867 (-14%) | 5mo | $233,999 | $125 | 60 |
| 2815 Ruby Xing | 0.33mi | 4/2.5 | 1,948 (-10%) | 14mo | $229,900 | $118 | 56 |
| 20334 Fire Stone | 0.39mi | 4/2.5 | 1,952 (-10%) | 16mo | $212,499 | $109 | 51 |
| 20318 Fire Stone | 0.41mi | 4/2.5 | 1,952 (-10%) | 16mo | $229,999 | $118 | 50 |
| 20411 Red Coral | 0.31mi | 4/2.0 | 1,880 (-14%) | 23mo | $182,999 | $97 | 42 |
Match score weights: distance 35% · size 25% · config 20% · recency 20%. Top-matched comps best support the ARV.
Projected returns pro-forma
3.94% appreciation · 3.0% rent growth · sell at horizon
- IRR
- 6.3%
- Equity multiple
- 1.38×
- Total profit
- $22,656
- Equity at exit
- $107,311
- IRR
- 8.8%
- Equity multiple
- 2.46×
- Total profit
- $87,285
- Equity at exit
- $174,973
Cash invested: $59,640 (down + closing). Projections, not guarantees.
Landlord ↔ Tenant lean methodology
- Overall (STATE)
- 87 Strongly Landlord-Friendly
- State Texas
- 87 Strongly Landlord-Friendly · R+5
- County
- — inherits STATE
- City
- — inherits STATE
ZIP-level market 78264
- Home prices YoY
- 1.3%
- Active inventory
- 329
- Price-to-rent
- 11.2×
Monthly cashflow live
- Estimated rent
- $1,588 medium interval (Pro) →
- Mortgage (P&I)
- −$1,117
- Tax est. 1.5%
- −$266 /mo · $3,195/yr
- Insurance
- −$89
- HOA
- −$0
- Vacancy / Maint / Mgmt
- −$333
- Net cashflow
- $-218
Break-even live
UW: 25.0% down · 7.5% · 30yr · 1.5% tax · 5.0% vac · 8.0% maint · 8.0% mgmt
Financing live
Cash to close
- Down payment
- $53,250
- Closing costs
- $6,390
- Reserves months
- —
- Total cash needed
- —
Loan-product check · same deal, 3 products live
Conventional
25% down · 7.5% · 30yr
- Down + closing
- —
- Monthly P&I
- —
- Monthly cashflow
- —
- DSCR
- —
- Eligible?
- —
Personal DTI + credit; lowest rate.
DSCR
20% down · 8.5% · 30yr
- Down + closing
- —
- Monthly P&I
- —
- Monthly cashflow
- —
- DSCR
- —
- Eligible?
- —
No personal income docs; deal must DSCR.
Hard money
10% down · 12.0% · 12mo
- Down + closing
- —
- Monthly P&I
- —
- Monthly cashflow
- —
- DSCR
- —
- Eligible?
- —
Short-term bridge; refi at stabilization.
Rent comps 3 comps
| Address | Beds | Baths | Sqft | Rent | $/sqft | DOM | Units | Dist |
|---|---|---|---|---|---|---|---|---|
| 20622 Andalusite Way San Antonio, TX | 4.0 | 2.5 | 1535 | $1,550 | $1.01 | 44d | 1 | 0.20mi |
| 20823 Pinon Grv San Antonio, TX | 3.0 | 2.0 | 1403 | $1,650 | $1.18 | 44d | 1 | 1.16mi |
| 20414 Deets Trl San Antonio, TX | 3.0 | 2.5 | 1858 | $1,750 | $0.94 | 3d | 1 | 1.46mi |
Listing history 11 events
-
2026-06-18days on market $212,999 Active 12 DOM
-
2026-06-17pricedays on market $212,999 Active 11 DOM
-
2026-06-16days on market $215,999 Active 10 DOM
-
2026-06-15days on market $215,999 Active 9 DOM
-
2026-06-13days on market $215,999 Active 7 DOM
-
2026-06-13days on market $215,999 Active 6 DOM
-
2026-06-10price $215,999 Active 3 DOM
-
2026-06-09days on market $222,999 Active 3 DOM
-
2026-06-08days on market $222,999 Active 2 DOM
-
2026-06-07remarks 329-char remark
-
2026-06-07$222,999 Active 1 DOM
ⓘ Source: listings_history table (triggers on properties + properties_extension) + one-shot
backfill from property_details.listing_events for pre-trigger history.
Nearby sold comps map
Loading sold comps map…
Walkable amenities ~0.75 mi
Loading nearby amenities…
Taxation est. · year 1
- Rental income
- $19,051
- − Mortgage interest
- −$11,931
- − Property taxes
- −$3,195
- − Insurance
- −$1,065
- − Repairs & maintenance
- −$1,524
- − Management
- −$1,524
- − Depreciation
- −$6,196
- Taxable loss
- −$6,385
- Est. tax savings @ 24.0%
- +$1,532
- After-tax cash flow
- $-1,081/yr
For passive investors: Depreciation is non-cash, so a rental often shows a tax loss while cash-flowing — sheltering income. Rental losses are passive: they offset passive income freely, and up to $25,000/yr can offset ordinary (W-2) income if you actively participate and your MAGI is under $100k (phasing out to $0 by $150k); unused losses carry forward. On sale, claimed depreciation is recaptured at up to 25%, and gains may owe capital-gains tax (a 1031 exchange can defer both). Figures are a year-1 estimate at your 24.0% rate — not tax advice; consult a CPA.
Schools (NCES district)
- District
- Southside ISD
- NCES district ID
- 4840920
- Math proficiency
- 16% ▼ -15.00%
- Reading proficiency
- 25% ▼ -2.00%
- Median HH income
- $43,526
- Composite
- 17.68/100
- National rank
- #9027
- State rank
- #771 of 826 in TX
Livability — San Antonio
- Score
- 80/100
- State rank
- #31
- US rank
- #1616
Category grades
Schools grade is shown separately in the Schools card above.
Census & demographics
- City population
- 1,806,925
- Population (ZIP)
- 11,702
Population outlook (Bexar County) Hauer SSP2
- Today (2025)
- 2,336,851 people
- By 2030
- 2,560,728 · +9.6%
- By 2040
- 3,020,569 · +29.3%
- By 2050
- 3,493,522 · +49.5%
- By 2075
- 4,668,459 · +99.8%
- By 2100
- 5,533,242 · +136.8%
Race, ethnicity, and origin ACS 2023
- Neighborhood character
- Predominantly Hispanic (80%)
- Race & ethnicity
- Hispanic / Latino 80% Two or more races 35% White 17% Black 2% Native American 1%
- Hispanic origin (detail)
- Mexican 73%
- Common ancestry
- Lithuanian 1% Serbian 1% Greek 1%
- Foreign-born
- 14% · Canada
- Languages at home
- 48% English-only · Spanish 51% Tagalog/Filipino 0%
Political lean MEDSL · Bexar
- 2024 margin
- Lean D (+9.8) · D 54.3% · R 44.6% · Other 1.1%
- 2008→2024 swing
- +4.2pp toward D · 2008: 5.6pp · 2024: 9.8pp
- All cycles
- 2024: D+9.8 2020: D+18.2 2016: D+13.5 2012: D+4.6 2008: D+5.6
Not yet ingested
- Civics
- —
Market trends
- HPI YoY
- ▲ 3.94%
- Current HPI
- 298.8446
- Rent YoY
- —
- Metro
- —
- State GDP YoY
- ▲ 3.95%
- F500 in state
- 110
Industry mix (Fortune 500 HQ in TX)
| Industry | F500 HQs | Revenue |
|---|---|---|
| Energy | 16 | $1,198B |
|
||
| Technology | 5 | $198B |
|
||
| Engineering / Construction | 4 | $72B |
|
||
| Energy Services | 3 | $60B |
|
||
| Utilities | 3 | $41B |
|
||
| Healthcare | 2 | $330B |
|
||
Cash-flow waterfall
monthlySold comps — $/sqft
last 12 mo · ≤1 miLoading sold comps…