 Duplex
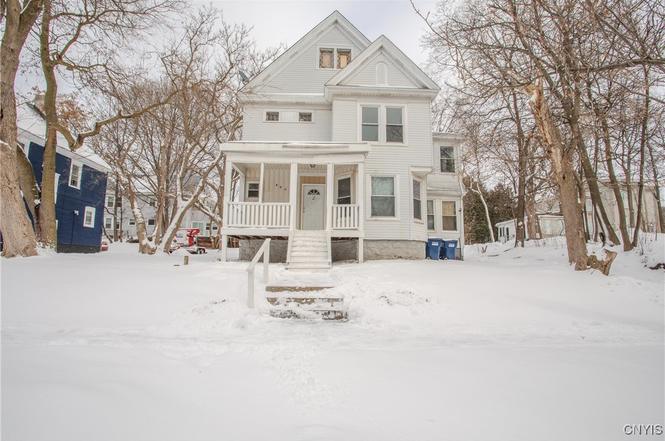
407 Graves St · Syracuse, NY
Flood risk 1/10 · Minimal
- FEMA flood zone
- X (unshaded)
- Chance of flooding over 30 yrs
- 0.0%
- Est. flood insurance / yr
- $473 – $860
Fire risk 1/10 · Minimal
- Est. fire insurance / yr
- $691 – $1,283
Heat risk 3/10 · Minor
- Hot days now (above 94°F)
- 7 days/yr
- Hot days in 30 yrs
- 16 days/yr
Wind risk 1/10 · Minimal
- Chance of severe wind over 30 yrs
- 0.0%
Air-quality risk 2/10 · Minimal
- Unhealthy air days now
- 0 days/yr
- Unhealthy air days in 30 yrs
- 1 days/yr
Risk factors via First Street. Map © Google.
Why this score? — see what drove the B+ grade
The composite is a weighted blend of 9 inputs, each scored 0–100. Each bar is that input's sub-score; the figure is the points it added to the 100-point composite (weight × sub-score).
- Cash flow +30.0/30.0
- ARV discount +14.8/15.0
- 1% rule +10.0/10.0
- DSCR +10.0/10.0
- Rent growth +4.6/5.0
- Livability +3.9/5.0
- Condition / age +2.5/5.0
- Schools +1.8/10.0
- Appreciation +0.0/10.0
$110,000
🖨 Deal sheet 📄 Offer letter ✓ Due diligence
Multi-family units
County records classify this as Multi-Family (2-4 Unit). Listing-text estimate: 2 units. confirmed
Listing remarks
well-maintained two-family home located at 407 Graves St. Featuring two spacious units, this property offers flexibility, steady income potential, and room for long-term value growth. The first-floor unit provides a comfortable layout with generous living space, a bright kitchen, and well-sized bedrooms—perfect for a primary residence or reliable rental income. The second-floor unit mirrors the home’s charm with its own private entrance, updated living areas, and strong rental appeal. Additional highlights include furnaces and water heaters, storage, and a backyard/lot suitable for outdoor enjoyment, gardening, or tenant use. Off-street parking enhances convenience for both unit
Key facts
- Off street parking
- Updated living areas
- Private entrance
Tags
Neighborhood map
What this means for you Summary
Snapshot
- This is a 2 × 2-bed/1.0-bath units multifamily listed at $110k.
Deal economics
- At list price, monthly cash flow is $2k ($21k/yr) — positive. Per door: $874/mo.
- The deal already cash-flows at list — no discount required.
- Meets the 1% rule at list price ($3k rent vs $110k).
- Recommended offer: $103k (6.0% below list) — sets the bar for market timing.
- Cap rate 25.4% vs local median 8.2% in Syracuse — top-decile yield for the area; either an underpriced asset or a hidden risk that comps aren't pricing in. Stress-test before assuming the spread holds.
Location & tenants
- Location reads 77/100 on livability (#187 in NY, #2,869 nationally) — a middle-class / working-renter tenant base. Strengths: amenities A+, commute A+, cost of living A+; Watch: schools D+, crime F, employment D-.
- Syracuse City School District (urban): math 18% / reading 26% proficiency, ranked #590 of 590 in NY (top 100%) — low school quality limits family demand, transient renter base, plan for 1-2y turnover; 74% free/reduced lunch — lower-income household profile, screen leases tightly.
- Market conditions: Rents rising fast (+8.4%/yr); 55 active listings in the ZIP; 9 comparable units currently listed for rent nearby; rentals at typical pace (median 21d on market — plan ~3-4 weeks tenant-placement turnaround); 44% of comp listings sitting > 30 days — soft ceiling on asking rent; 616 units permitted in Onondaga County in 2024 (256 in 5+ unit buildings).
- At $3,143/mo this rent would consume 80% of the median local household income ($47k/yr) (locally 1566% of renters already pay >50% of income on rent) — very limited rent-growth headroom before tenants either downsize or default.
Forward outlook
- Local home prices are declining (-3.0%/yr); year-one equity from $761 of loan paydown is wiped out by about $3k of value loss. Plan a longer hold.
- Onondaga County population projected to shrink 9% by 2050 — rents likely to lag national; underwrite the cash flow, not the appreciation.
- At projected returns (-3.0% appreciation + 8.0% rent growth), your $31k cash investment doubles in ~2 years — after that, you're playing with house money.
Negotiation context
- It's been on market 71 days — a 6% lower offer ($103k) is reasonable based on typical stale-listing flexibility.
- Current owner paid $63k; list at $110k implies a 75% gain — meaningful room to come down on a strong offer.
Risks & watch-outs
- Watch-outs: built in 1910 — expect roof / HVAC / electrical / plumbing capex.
Questions for the listing agent
- It's been on market 71 days. Have you received any prior offers? Is the seller open to a 6% concession, seller financing, or rate buy-down credit?
- Can we see the unit-by-unit rent roll, current vacancy, and any below-market leases? What's the average tenancy length?
- What capital expenditures (roof, boiler, parking lot, exteriors) have been made in the last 5 years, and what's planned in the next 2?
- Built in 1910 — when were the roof, HVAC, electrical panel, plumbing, and water heater last replaced?
- Why hasn't it sold? Are there any deal-killer items the seller is aware of (foundation, flood, title, zoning, code violations)?
- Is there a deadline driving the sale (1031 exchange, divorce, estate, relocation)? That informs how much negotiation room exists.
- Schools are D-rated, which usually means shorter tenancies and higher turnover. Who's the typical renter profile here, and what's been the actual vacancy rate?
- Crime grade is F in this area — have there been break-ins, vandalism, or insurance claims at this property in the last 3 years? What carrier currently insures it and at what premium?
- What's the average days-on-market for RENTAL listings here right now (not sales)? A rising rental-DOM trend means longer vacancies and softer asking-rent achievability than the comps imply.
- What's the recent tenant-quality profile in this submarket — average credit score on applications, eviction rate, late-payment / NSF rate, and stable-employment percentage? A property-management company in the area should have these aggregated.
- How much new apartment / multifamily construction is in the pipeline within 1–3 miles? Heavy new supply (>2% of stock underway) typically softens rents 12–24 months out; light construction supports rent growth.
Investment metrics
- 1% rule
- 2.86% ✓
- Cap rate
- 25.37%
- Cash-on-cash
- 68.14%
- DSCR
- 4.03
- GRM
- 2.9
CMA / ARV
- ARV (on-the-fly)
- $131,216
- Comps found
- 12
Show comp detail 12 sales within ~0.75 mi
| Address | Dist | Beds/Ba | Sqft | Sold | Price | $/sf | Match |
|---|---|---|---|---|---|---|---|
| 501-503 Dewitt St | 0.42mi | 4/2.0 | 2,370 (+7%) | 2mo | $198,000 | $84 | 68 |
| 932-934 Oak St | 0.36mi | 5/2.0 (+1) | 2,050 (-8%) | 2mo | $105,000 | $51 | 63 |
| 300 Helen St | 0.41mi | 5/2.0 (+1) | 2,098 (-6%) | 4mo | $165,000 | $79 | 63 |
| 128 John St | 0.53mi | 5/2.0 (+1) | 2,269 (+2%) | 6mo | $129,000 | $57 | 62 |
| 1107 Butternut St | 0.44mi | 4/2.0 | 2,002 (-10%) | 9mo | $34,900 | $17 | 56 |
| 1215 Oak St #17 | 0.60mi | 4/2.0 | 2,482 (+12%) | 1mo | $218,200 | $88 | 52 |
| 635 E Division St | 0.59mi | 4/2.0 | 2,376 (+7%) | 11mo | $110,000 | $46 | 52 |
| 317 E Division St | 0.71mi | 4/2.0 | 2,016 (-9%) | 2mo | $119,900 | $59 | 50 |
| 807 Burnet Ave | 0.71mi | 4/2.0 | 2,016 (-9%) | 4mo | $205,000 | $102 | 48 |
| 115 John St | 0.56mi | 5/2.0 (+1) | 2,516 (+13%) | 5mo | $120,000 | $48 | 43 |
| 339 N Beech St | 0.65mi | 5/2.0 (+1) | 2,016 (-9%) | 9mo | $190,000 | $94 | 41 |
| 1021 N Townsend St | 0.74mi | 3/2.0 (-1) | 2,030 (-9%) | 6mo | $69,900 | $34 | 41 |
Match score weights: distance 35% · size 25% · config 20% · recency 20%. Top-matched comps best support the ARV.
Projected returns pro-forma
-3.0% appreciation · 8.0% rent growth · sell at horizon
- IRR
- 73.1%
- Equity multiple
- 4.58×
- Total profit
- $110,200
- Equity at exit
- $16,401
- IRR
- 78.4%
- Equity multiple
- 11.23×
- Total profit
- $315,111
- Equity at exit
- $9,511
Cash invested: $30,800 (down + closing). Projections, not guarantees.
Landlord ↔ Tenant lean methodology
- Overall (STATE)
- 15 Strongly Tenant-Friendly
- State New York
- 15 Strongly Tenant-Friendly · D+10
- County
- — inherits STATE
- City
- — inherits STATE
ZIP-level market 13203
- Home prices YoY
- -11.9%
- Rents YoY
- 8.4%
- Active inventory
- 55
- Price-to-rent
- 5.8×
Monthly cashflow live
- Estimated rent
- $3,143 high interval (Pro) →
- Mortgage (P&I)
- −$577
- Tax from tax record
- −$111 /mo · $1,338/yr
- Insurance
- −$46
- HOA
- −$0
- Vacancy / Maint / Mgmt
- −$660
- Net cashflow
- $1,749
Break-even live
2-unit breakdown (identical units grouped — click to expand)
| Units | Beds | Baths | Est. rent |
|---|---|---|---|
| 2× units | 2 | 1 | $3,142 |
| #1 | 2 | 1 | $1,571 |
| #2 | 2 | 1 | $1,571 |
| Total (2 units) | $3,143 | ||
UW: 25.0% down · 7.5% · 30yr · 1.5% tax · 5.0% vac · 8.0% maint · 8.0% mgmt
Financing live
Cash to close
- Down payment
- $27,500
- Closing costs
- $3,300
- Reserves months
- —
- Total cash needed
- —
Loan-product check · same deal, 3 products live
Conventional
25% down · 7.5% · 30yr
- Down + closing
- —
- Monthly P&I
- —
- Monthly cashflow
- —
- DSCR
- —
- Eligible?
- —
Personal DTI + credit; lowest rate.
DSCR
20% down · 8.5% · 30yr
- Down + closing
- —
- Monthly P&I
- —
- Monthly cashflow
- —
- DSCR
- —
- Eligible?
- —
No personal income docs; deal must DSCR.
Hard money
10% down · 12.0% · 12mo
- Down + closing
- —
- Monthly P&I
- —
- Monthly cashflow
- —
- DSCR
- —
- Eligible?
- —
Short-term bridge; refi at stabilization.
Rent comps 9 comps
| Address | Beds | Baths | Sqft | Rent | $/sqft | DOM | Units | Dist |
|---|---|---|---|---|---|---|---|---|
| 712 Oak St Syracuse, NY | 3.0 | 1.0 | 2461 | $1,700 | $0.69 | 21d | 1 | 0.24mi |
| 365 Green St Syracuse, NY | 5.0 | 3.5 | 2263 | $3,300 | $1.46 | 21d | 1 | 0.27mi |
| 746 E Laurel St Unit 1 Syracuse, NY | 4.0 | 2.0 | 1400 | $1,500 | $1.07 | 43d | 1 | 0.29mi |
| 447 E Washington St Syracuse, NY | 3.0 | 1.5 | 2095 | $2,100 | $1.00 | 13d | 1 | 0.82mi |
| 1205 Madison St Fl -1 Syracuse, NY | 4.0 | 3.0 | 2988 | $2,640 | $0.88 | 43d | 1 | 1.11mi |
| 1108 Madison St Unit 2 Syracuse, NY | 3.0 | 1.5 | 1580 | $2,080 | $1.32 | 43d | 1 | 1.12mi |
| 1607 Burnet Ave Unit 1 Syracuse, NY | 3.0 | 1.0 | 2538 | $1,650 | $0.65 | 21d | 1 | 1.22mi |
| 202 Stafford Ave Syracuse, NY | 3.0 | 1.0 | 1692 | $1,800 | $1.06 | 13d | 1 | 1.34mi |
| 409 Westmoreland Ave Unit 9 Syracuse, NY | 3.0 | 1.0 | 2480 | $2,200 | $0.89 | 43d | 1 | 1.50mi |
Listing history 5 events
-
2026-02-21status Pending
-
2025-12-16historical Active Under Contract
-
2025-12-12$110,000 Active
-
2007-10-08soldstatus $63,000
-
2003-06-06soldstatus $59,000
ⓘ Source: listings_history table (triggers on properties + properties_extension) + one-shot
backfill from property_details.listing_events for pre-trigger history.
Tax reassessment forecast NY · Partial reset (capped growth)
- Current annual tax
- $1,338 · $111/mo
- Projected year-2 tax
- $1,598 · $133/mo
- Expected delta
- +$261/yr (+$22/mo · 19.5%)
ⓘ Screening estimate from a state-policy table — verify with the county assessor before closing.
Climate risk First Street
- Flood 1/10 Low FEMA zone X (unshaded) · 0% chance over 30 yrs
- Wildfire 1/10 Low
- Heat 3/10 Moderate 7 d/yr ≥94°F today · 16 d/yr by 30 yrs out
- Wind 1/10 Low 0% chance of damaging wind over 30 yrs
- Air quality 2/10 Low 0 unhealthy d/yr today · 1 by 30 yrs out
Nearby sold comps map
Loading sold comps map…
Walkable amenities ~0.75 mi
Loading nearby amenities…
Taxation est. · year 1
- Rental income
- $37,716
- − Mortgage interest
- −$6,162
- − Property taxes
- −$1,338
- − Insurance
- −$550
- − Repairs & maintenance
- −$3,017
- − Management
- −$3,017
- − Depreciation
- −$3,200
- Taxable income
- $20,432
- Est. tax owed @ 24.0%
- −$4,904
- After-tax cash flow
- $16,082/yr
For passive investors: Depreciation is non-cash, so a rental often shows a tax loss while cash-flowing — sheltering income. Rental losses are passive: they offset passive income freely, and up to $25,000/yr can offset ordinary (W-2) income if you actively participate and your MAGI is under $100k (phasing out to $0 by $150k); unused losses carry forward. On sale, claimed depreciation is recaptured at up to 25%, and gains may owe capital-gains tax (a 1031 exchange can defer both). Figures are a year-1 estimate at your 24.0% rate — not tax advice; consult a CPA.
Schools (NCES district)
- District
- Syracuse City School District
- NCES district ID
- 3628590
- Math proficiency
- 18% ▼ -5.00%
- Reading proficiency
- 26% ▬ 0.00%
- Median HH income
- $32,097
- Composite
- 17.83/100
- National rank
- #9007
- State rank
- #590 of 590 in NY
Livability — Syracuse
- Score
- 77/100
- State rank
- #187
- US rank
- #2869
Category grades
Schools grade is shown separately in the Schools card above.
Census & demographics
- Census place
- Syracuse, NY
- County
- Onondaga County · 247,257 people
- City population
- 152,627
- Metro
- Syracuse, NY
- Population (ZIP)
- 16,180
- Household income
- $46,997
- Rent vs Own
- Severe rent burden
- 1566.0
Population outlook (Onondaga County) Hauer SSP2
- Today (2025)
- 467,894 people
- By 2030
- 463,381 · -1.0%
- By 2040
- 447,697 · -4.3%
- By 2050
- 426,399 · -8.9%
- By 2075
- 373,661 · -20.1%
- By 2100
- 307,967 · -34.2%
Race, ethnicity, and origin ACS 2023
- Neighborhood character
- Diverse neighborhood (Simpson 0.67)
- Race & ethnicity
- White 52% Black 22% Hispanic / Latino 11% Two or more races 9% Asian 7%
- Hispanic origin (detail)
- Puerto Rican 6% Cuban 2%
- Common ancestry
- Romanian 3% Lithuanian 2% Iranian 2%
- Foreign-born
- 13% · Canada, India, Philippines
- Languages at home
- 81% English-only · Spanish 6% Other Indo-European 3% Other Asian/Pacific 3%
Political lean MEDSL · Onondaga
- 2024 margin
- D (+17.3) · D 58.6% · R 41.4%
- 2008→2024 swing
- -3.0pp toward R · 2008: 20.3pp · 2024: 17.3pp
- All cycles
- 2024: D+17.3 2020: D+20.6 2016: D+12.8 2012: D+21.1 2008: D+20.3
Not yet ingested
- Civics
- —
Market trends
- HPI YoY
- ▼ -35.69%
- Current HPI
- 263.2588
- Rent YoY
- ▲ 8.39%
- Metro
- Syracuse, NY
- State GDP YoY
- ▲ 2.60%
- F500 in state
- 92
Industry mix (Fortune 500 HQ in NY)
| Industry | F500 HQs | Revenue |
|---|---|---|
| Financial Services | 10 | $950B |
|
||
| Consumer Goods | 9 | $162B |
|
||
| Insurance | 4 | $225B |
|
||
| Telecommunications | 2 | $144B |
|
||
| Pharmaceuticals | 2 | $112B |
|
||
| Media / Entertainment | 2 | $69B |
|
||
Price history
+86.4% since first listed5 events — show timeline
- 2026-02-21 Pending — CNYIS
- 2025-12-16 Contingent — CNYIS
- 2025-12-12 Listed $110,000 CNYIS
- 2007-10-08 Sold (Public Records) $63,000 Public Records
- 2003-06-06 Sold (Public Records) $59,000 Public Records
Property tax history
-0.2%/yrLatest (2025): $1,338 · +0.0% YoY. Source: county tax records.
Cash-flow waterfall
monthlySold comps — $/sqft
last 12 mo · ≤1 miLoading sold comps…