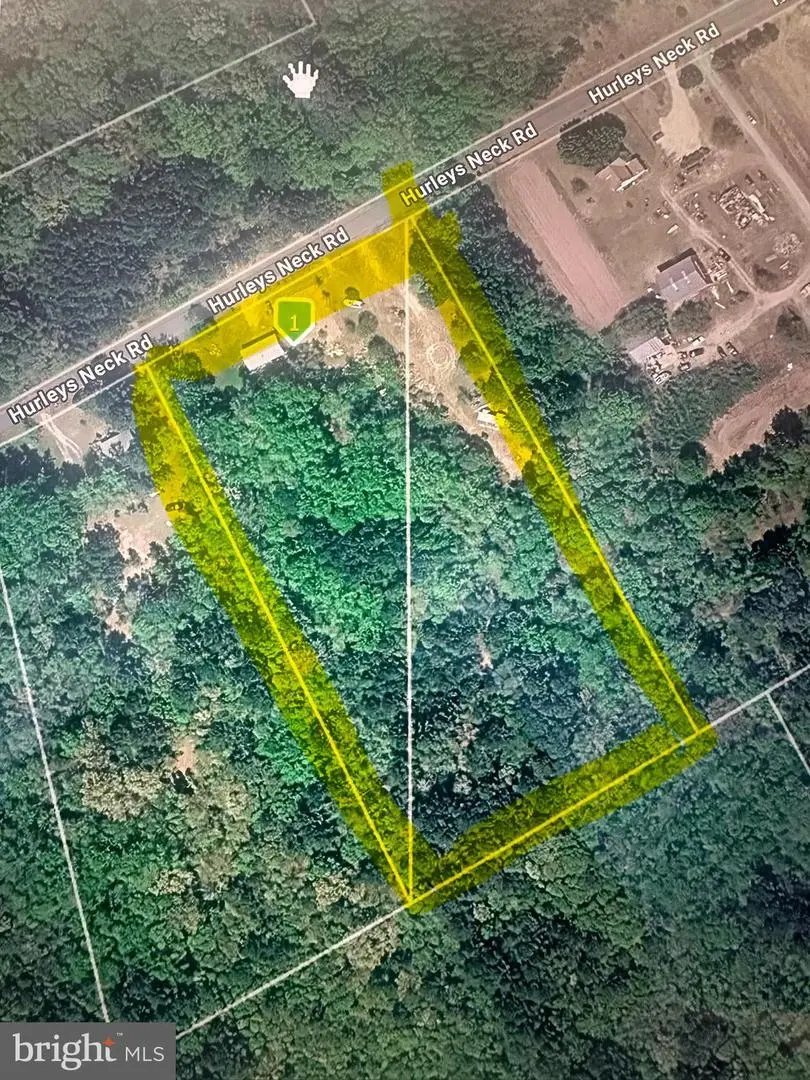
8381 Hurleys Neck Rd · Mardela Springs, MD
Flood risk 3/10 · Minor
- FEMA flood zone
- X (unshaded)
- Chance of flooding over 30 yrs
- 0.09%
- Est. flood insurance / yr
- $507 – $1,088
Fire risk 4/10 · Minor
- Est. fire insurance / yr
- $755 – $1,403
Heat risk 8/10 · Major
- Hot days now (above 106°F)
- 7 days/yr
- Hot days in 30 yrs
- 16 days/yr
Wind risk 6/10 · Moderate
- Chance of severe wind over 30 yrs
- 77.0%
Air-quality risk 3/10 · Minor
- Unhealthy air days now
- 2 days/yr
- Unhealthy air days in 30 yrs
- 2 days/yr
Risk factors via First Street. Map © Google.
Why this score? — see what drove the D grade
The composite is a weighted blend of 9 inputs, each scored 0–100. Each bar is that input's sub-score; the figure is the points it added to the 100-point composite (weight × sub-score).
- Appreciation +10.0/10.0
- Cash flow +9.5/30.0
- ARV discount +7.5/15.0
- Livability +3.5/5.0
- DSCR +2.7/10.0
- Rent growth +2.5/5.0
- Condition / age +2.5/5.0
- Schools +1.9/10.0
- 1% rule +1.5/10.0
$190,000
🖨 Deal sheet (PDF) 📄 Offer letter ✓ Due diligence
Listing remarks
Rare investment opportunity!! Currently offering two parcels of land being sold together, totaling 5.44 acres. This is unique find as both parcels are fully equipped with their own individual well and septic systems. Additionally, the property includes a mobile home.
Key facts
- 5.42 acre lot
- Built 1995
- Listed 32 days
Property features AI
Finance
- Other: Ownership is fee simple
Exterior
- Parking: Driveway
- Utilities: Well water; On-site septic system
- Home design: Manufactured home; Estimated year built; Single-story (all main-level living area); Facing direction not specified
- Construction: Aluminum siding; Metal roof; Above-grade finished living area approximately 1,056 (estimated)
- Exterior features: Additional parcel included (8385 Hurley Neck Rd. parcel referenced); Not in a federal flood zone; Rural location outside city limits
Interior
- Bedrooms: 3 bedrooms on the main level
- Bathrooms: 1 full bathroom (main level)
- Heating & cooling: Wood-burning stove for heat; Propane hot water
- Interior features: Drywall walls and ceilings; No basement
Neighborhood map
What this means for you Summary
Snapshot
- This is a 3-bed/2.0-bath manufactured listed at $190k.
Deal economics
- At list price, monthly cash flow is $-131 ($-2k/yr) — negative.
- To cash-flow at today's rent, offer at most $167k (12.2% below list).
- To meet the 1% rule (rent ≥ 1% of price), the offer needs to be $124k (34.5% below list).
- Recommended offer: $124k (34.5% below list) — sets the bar for 1% rule.
Location & tenants
- Location reads 70/100 on livability (#181 in MD) — a middle-class / working-renter tenant base. Strengths: housing A+, health & safety A+, employment A; Watch: crime F, amenities F, commute F.
- Wicomico County Public Schools (urban): math 16% / reading 26% proficiency, ranked #19 of 24 in MD (top 79%) — low school quality limits family demand, transient renter base, plan for 1-2y turnover.
- Zoned schools: Westside Primary (192 students, 42% FRL); Mardela Middle & High (math 19% / reading 48%, grade F, #148 of 222 statewide, top 67%, 691 students, 43% FRL).
- Zoned-school proficiency averages 34% at this address vs 21% district-wide (+12 pts) — the actual schools serving this property are materially stronger than the Wicomico County Public Schools average implies; a family-tenant draw the district grade alone would hide.
- Market conditions: 18 active listings in the ZIP; 278 units permitted in Wicomico County in 2024 (44 in 5+ unit buildings).
Forward outlook
- In year one you build about $20k of equity ($1k loan paydown + $19k appreciation (10.0% local appreciation)).
- Wicomico County population projected at +14% by 2050 — modest demand growth; plan on rents tracking national, not racing it.
- By year 2, paydown + projected appreciation supports a ~$33k cash-out refi (75% LTV) — recoverable capital for the next deal without selling this one.
Negotiation context
- It's been on market 32 days — a 3% lower offer ($184k) is reasonable based on typical stale-listing flexibility.
- 9 sale attempts since 24y ago with the ask held roughly flat each time — persistent listings suggest the price (not the market) is what's stuck; bring a comps-based counter.
- Current owner paid $60k; list at $190k implies a 217% gain — meaningful room to come down on a strong offer.
Risks & watch-outs
- Climate carrying-cost: major wind risk, 77% chance of damaging wind over 30y; extreme-heat days projected 7→16/yr by 2055 (HVAC capex compounding) — expect insurance premiums to compound above CPI over the hold.
Questions for the listing agent
- What do current leases actually rent for vs. the listed asking? Can we see a recent rent roll and the last 12 months of T-12 income?
- It's been on market 32 days. Have you received any prior offers? Is the seller open to a 35% concession, seller financing, or rate buy-down credit?
- Is there a deadline driving the sale (1031 exchange, divorce, estate, relocation)? That informs how much negotiation room exists.
- Schools are B-rated — typically a magnet for longer-tenancy family renters. What's the average tenant stay here, and is there a school-zone premium baked into asking?
- Crime grade is F in this area — have there been break-ins, vandalism, or insurance claims at this property in the last 3 years? What carrier currently insures it and at what premium?
- The area grade is low — what's the realistic commute time and amenity access for the typical tenant pool here? Any planned neighborhood developments (good or bad) we should know about?
- What's the average days-on-market for RENTAL listings here right now (not sales)? A rising rental-DOM trend means longer vacancies and softer asking-rent achievability than the comps imply.
- What's the recent tenant-quality profile in this submarket — average credit score on applications, eviction rate, late-payment / NSF rate, and stable-employment percentage? A property-management company in the area should have these aggregated.
- How much new for-sale + rental construction is in the pipeline within 1–3 miles? Heavy new supply typically softens prices + rents 12–24 months out; constrained supply supports both.
Investment metrics
- 1% rule
- 0.65% ✗
- Cap rate
- 5.46%
- Cash-on-cash
- -2.96%
- DSCR
- 0.87
- GRM
- 12.7
CMA / ARV
No comps found within radius.
Projected returns pro-forma
10.0% appreciation · 3.0% rent growth · sell at horizon
- IRR
- 22.1%
- Equity multiple
- 2.79×
- Total profit
- $95,005
- Equity at exit
- $171,167
- IRR
- 19.9%
- Equity multiple
- 6.38×
- Total profit
- $286,150
- Equity at exit
- $369,128
Cash invested: $53,200 (down + closing). Projections, not guarantees.
Landlord ↔ Tenant lean methodology
- Overall (STATE)
- 27 Tenant-Leaning
- State Maryland
- 27 Tenant-Leaning · D+14
- County
- — inherits STATE
- City
- — inherits STATE
ZIP-level market 21837
- Home prices YoY
- 23.2%
- Active inventory
- 18
- Price-to-rent
- 12.7×
Monthly cashflow live
- Estimated rent
- $1,244 medium interval (Pro) →
- Mortgage (P&I)
- −$996
- Tax from tax record
- −$38 /mo · $461/yr
- Insurance
- −$79
- HOA
- −$0
- Vacancy / Maint / Mgmt
- −$261
- Net cashflow
- $-131
Break-even live
Sensitivity live
| Price | -10% $-24 | -5% $-78 | +0% $-131 | +5% $-185 | +10% $-239 |
|---|---|---|---|---|---|
| Rent | -10% $-230 | -5% $-181 | +0% $-131 | +5% $-82 | +10% $-33 |
| Rate | -1.0pp $-36 | -0.5pp $-83 | base $-131 | +0.5pp $-181 | +1.0pp $-231 |
UW: 25.0% down · 7.5% · 30yr · 1.5% tax · 5.0% vac · 8.0% maint · 8.0% mgmt
Financing live
Cash to close
- Down payment
- $47,500
- Closing costs
- $5,700
- Reserves months
- —
- Total cash needed
- —
Loan-product check · same deal, 3 products live
Conventional
25% down · 7.5% · 30yr
- Down + closing
- —
- Monthly P&I
- —
- Monthly cashflow
- —
- DSCR
- —
- Eligible?
- —
Personal DTI + credit; lowest rate.
DSCR
20% down · 8.5% · 30yr
- Down + closing
- —
- Monthly P&I
- —
- Monthly cashflow
- —
- DSCR
- —
- Eligible?
- —
No personal income docs; deal must DSCR.
Hard money
10% down · 12.0% · 12mo
- Down + closing
- —
- Monthly P&I
- —
- Monthly cashflow
- —
- DSCR
- —
- Eligible?
- —
Short-term bridge; refi at stabilization.
Listing history 39 events
-
2026-06-21days on market $190,000 Active 32 DOM
-
2026-06-18days on market $190,000 Active 29 DOM
-
2026-06-17days on market $190,000 Active 28 DOM
-
2026-06-16days on market $190,000 Active 27 DOM
-
2026-06-15days on market $190,000 Active 26 DOM
-
2026-06-14days on market $190,000 Active 24 DOM
-
2026-06-13days on market $190,000 Active 23 DOM
-
2026-06-10days on market $190,000 Active 21 DOM
-
2026-06-09days on market $190,000 Active 20 DOM
-
2026-06-08days on market $190,000 Active 19 DOM
-
2026-06-07days on market $190,000 Active 18 DOM
-
2026-06-03days on market $190,000 Active 14 DOM
-
2026-06-02days on market $190,000 Active 13 DOM
-
2026-06-01days on market $190,000 Active 12 DOM
-
2026-05-31days on market $190,000 Active 11 DOM
-
2026-05-30days on market $190,000 Active 10 DOM
-
2026-05-21$190,000 Active
-
2026-05-20historical $190,000
-
2026-05-01historical
-
2026-01-05price $190,000
-
2025-11-18$200,000 Active
-
2022-02-07historical
-
2021-12-17$149,000 Active
-
2019-10-29historical
-
2019-06-13$70,000 Active
-
2019-04-24historical
-
2018-12-18$70,000 Active
-
2018-07-06historical
-
2018-04-05$90,000
-
2017-10-01historical
-
2017-04-10$75,000
-
2008-07-25historical
-
2007-05-30$110,000
-
2004-04-07soldstatus $60,000
-
2004-04-07soldstatus $60,000
-
2003-09-24soldstatus $60,000
-
2002-11-06historical
-
2002-07-24$54,900
-
1993-06-02soldstatus $50,000
ⓘ Source: listings_history table (triggers on properties + properties_extension) + one-shot
backfill from property_details.listing_events for pre-trigger history.
Tax reassessment forecast MD · Partial reset (capped growth)
- Current annual tax
- $461 · $38/mo
- Projected year-2 tax
- $1,266 · $105/mo
- Expected delta
- +$805/yr (+$67/mo · 174.8%)
ⓘ Screening estimate from a state-policy table — verify with the county assessor before closing.
Climate risk First Street
- Flood 3/10 Moderate FEMA zone X (unshaded) · 9% chance over 30 yrs
- Wildfire 4/10 Moderate
- Heat 8/10 Severe 7 d/yr ≥106°F today · 16 d/yr by 30 yrs out
- Wind 6/10 Major 77% chance of damaging wind over 30 yrs
- Air quality 3/10 Moderate 2 unhealthy d/yr today · 2 by 30 yrs out
Nearby sold comps map
Loading sold comps map…
Walkable amenities ~0.75 mi
Loading nearby amenities…
Taxation est. · year 1
- Rental income
- $14,924
- − Mortgage interest
- −$10,643
- − Property taxes
- −$461
- − Insurance
- −$950
- − Repairs & maintenance
- −$1,194
- − Management
- −$1,194
- − Depreciation
- −$5,527
- Taxable loss
- −$5,045
- Est. tax savings @ 24.0%
- +$1,211
- After-tax cash flow
- $-366/yr
For passive investors: Depreciation is non-cash, so a rental often shows a tax loss while cash-flowing — sheltering income. Rental losses are passive: they offset passive income freely, and up to $25,000/yr can offset ordinary (W-2) income if you actively participate and your MAGI is under $100k (phasing out to $0 by $150k); unused losses carry forward. On sale, claimed depreciation is recaptured at up to 25%, and gains may owe capital-gains tax (a 1031 exchange can defer both). Figures are a year-1 estimate at your 24.0% rate — not tax advice; consult a CPA.
Schools (NCES district)
- District
- Wicomico County Public Schools
- NCES district ID
- 2400690
- Math proficiency
- 16% ▼ -18.00%
- Reading proficiency
- 26% ▼ -13.00%
- Median HH income
- $51,745
- Composite
- 18.87/100
- National rank
- #8860
- State rank
- #19 of 24 in MD
Livability — Mardela Springs
- Score
- 70/100
- State rank
- #181
- US rank
- #8103
Category grades
Schools grade is shown separately in the Schools card above.
Census & demographics
- Population (ZIP)
- 2,975
Population outlook (Wicomico County) Hauer SSP2
- Today (2025)
- 108,548 people
- By 2030
- 111,783 · +3.0%
- By 2040
- 118,139 · +8.8%
- By 2050
- 123,641 · +13.9%
- By 2075
- 139,784 · +28.8%
- By 2100
- 145,334 · +33.9%
Race, ethnicity, and origin ACS 2023
- Neighborhood character
- Majority White (65%)
- Race & ethnicity
- White 65% Black 26% Hispanic / Latino 6% Two or more races 2%
- Hispanic origin (detail)
- Mexican 3%
- Common ancestry
- Romanian 2% Slovak 1% Serbian 0%
- Foreign-born
- 4% · Canada
- Languages at home
- 98% English-only · Spanish 1% Other Indo-European 1%
Political lean MEDSL · Wicomico
- 2024 margin
- Lean R (+5.5) · D 46.1% · R 51.5% · Other 2.4%
- 2008→2024 swing
- +0.3pp no change · 2008: -5.8pp · 2024: -5.5pp
- All cycles
- 2024: R+5.5 2020: R+1.9 2016: R+11.6 2012: R+6.9 2008: R+5.8
Not yet ingested
- Civics
- —
Market trends
- HPI YoY
- ▲ 51.70%
- Current HPI
- 274.26
- Rent YoY
- —
- Metro
- —
- State GDP YoY
- ▲ 2.97%
- F500 in state
- 12
Industry mix (Fortune 500 HQ in MD)
| Industry | F500 HQs | Revenue |
|---|---|---|
| Aerospace / Defense | 1 | $71B |
|
||
| Utilities | 1 | $25B |
|
||
| Hotels | 1 | $24B |
|
||
| Consumer Goods | 1 | $7B |
|
||
| Real Estate | 1 | $6B |
|
||
| Chemicals | 1 | $2B |
|
||
Price history
+280.0% since first listed23 events — show timeline
- 2026-05-21 Listed $190,000 BRIGHT MLS
- 2026-05-20 Coming Soon $190,000 BRIGHT MLS
- 2026-05-01 Listing Removed — BRIGHT MLS
- 2026-01-05 Price Changed $190,000 BRIGHT MLS
- 2025-11-18 Listed $200,000 BRIGHT MLS
- 2022-02-07 Listing Removed — BRIGHT MLS
- 2021-12-17 Listed $149,000 BRIGHT MLS
- 2019-10-29 Listing Removed — BRIGHT MLS
- 2019-06-13 Listed $70,000 BRIGHT MLS
- 2019-04-24 Listing Removed — BRIGHT MLS
- 2018-12-18 Listed $70,000 BRIGHT MLS
- 2018-07-06 Listing Removed — BRIGHT MLS
- 2018-04-05 Listed $90,000 BRIGHT MLS
- 2017-10-01 Listing Removed — BRIGHT MLS
- 2017-04-10 Listed $75,000 BRIGHT MLS
- 2008-07-25 Listing Removed — BRIGHT MLS
- 2007-05-30 Listed $110,000 BRIGHT MLS
- 2004-04-07 Sold (Public Records) $60,000 Public Records
- 2004-04-07 Sold (Public Records) $60,000 Public Records
- 2003-09-24 Sold (Public Records) $60,000 Public Records
- 2002-11-06 Listing Removed — BRIGHT MLS
- 2002-07-24 Listed $54,900 BRIGHT MLS
- 1993-06-02 Sold (Public Records) $50,000 Public Records
Property tax history
-1.7%/yrLatest (2025): $461 · -2.5% YoY. Source: county tax records.
Cash-flow waterfall
monthlySold comps — $/sqft
last 12 mo · ≤1 miLoading sold comps…