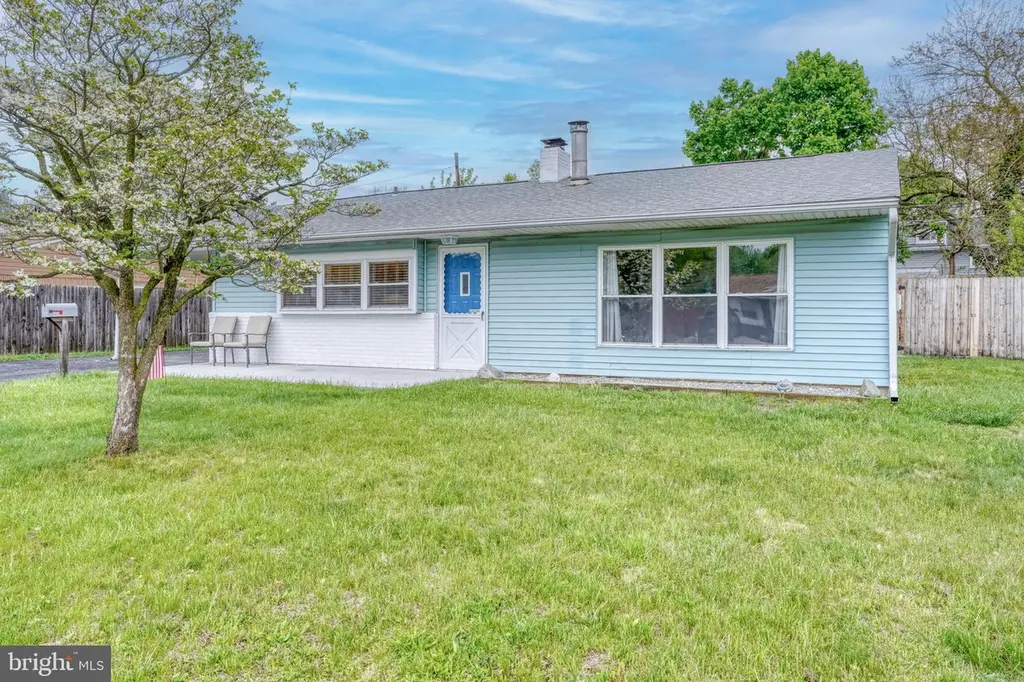
62 Montrose Dr · Brookside, DE
Flood risk 4/10 · Minor
- FEMA flood zone
- X (unshaded)
- Chance of flooding over 30 yrs
- 0.22%
- Est. flood insurance / yr
- $507 – $1,088
Fire risk 1/10 · Minimal
- Est. fire insurance / yr
- $476 – $884
Heat risk 7/10 · Major
- Hot days now (above 104°F)
- 7 days/yr
- Hot days in 30 yrs
- 15 days/yr
Wind risk 6/10 · Moderate
- Chance of severe wind over 30 yrs
- 27.0%
Air-quality risk 3/10 · Minor
- Unhealthy air days now
- 2 days/yr
- Unhealthy air days in 30 yrs
- 3 days/yr
Risk factors via First Street. Map © Google.
Why this score? — see what drove the C- grade
The composite is a weighted blend of 9 inputs, each scored 0–100. Each bar is that input's sub-score; the figure is the points it added to the 100-point composite (weight × sub-score).
- Cash flow +20.1/30.0
- ARV discount +11.3/15.0
- DSCR +6.4/10.0
- 1% rule +4.1/10.0
- Livability +3.5/5.0
- Rent growth +2.5/5.0
- Schools +2.5/10.0
- Condition / age +2.5/5.0
- Appreciation +0.0/10.0
$299,900
🖨 Deal sheet 📄 Offer letter ✓ Due diligence
Listing remarks
Charming 3-bedroom home with flexible living space in an established neighborhood in Newark. This cozy property offers a spacious, recently refreshed eat-in kitchen with updated quartz countertops and ample cabinet space. An inviting living room features an original brick fireplace and an operable wood-burning stove that provides supplemental heat throughout the adjoining living and kitchen spaces. There's an additional sitting room that could serve as a home office, den or potential 4th bedroom. Convenient side entry through the covered carport leads directly into the kitchen for easy everyday living. Thoughtful improvements completed by the seller include rerouting the heating and plumbin
Key facts
- 6,970 sq ft lot
- 4 parking spots
- Built 1954
Property features AI
Exterior
- Parking: Attached carport with 2 spaces; Driveway with 2 spaces; On-street parking; Four total garage/parking spaces
- Utilities: Public water; Public sewer; Electric service; Fiber optic internet
- Home design: Detached single-family home; Level entry to main level
- Construction: Vinyl siding; Slab foundation; Above-grade and below-grade structures
- Exterior features: Patio(s); Flood lights; Sidewalks; Street lights; Privacy wood fencing
Interior
- Kitchen: Built-in range; Electric oven/range; Range hood; Dishwasher; Refrigerator; Extra refrigerator/freezer; Eat-in kitchen; Pantry
- Bedrooms: Three bedrooms on the main level
- Flooring: Luxury vinyl plank
- Bathrooms: One full bathroom on the main level
- Heating & cooling: Hot water baseboard heating (oil-fired); Oil hot water; Ceiling fans; Window air conditioning units
- Interior features: Attic; Tub with shower; Ceiling fans; Combination kitchen/dining area; Crown moldings; Entry-level bedroom; Eat-in kitchen; Pantry; Recessed lighting; Wood stove
- Laundry & utility: Washer; Electric dryer
Neighborhood map
What this means for you Summary
Snapshot
- This is a 3-bed/1.0-bath single-family listed at $300k.
Deal economics
- At list price, monthly cash flow is $376 ($5k/yr) — positive.
- The deal already cash-flows at list — no discount required.
- To meet the 1% rule (rent ≥ 1% of price), the offer needs to be $274k (8.7% below list).
- Recommended offer: $274k (8.7% below list) — sets the bar for 1% rule.
- Cap rate 7.8% vs local median 5.0% in Brookside — top-decile yield for the area; either an underpriced asset or a hidden risk that comps aren't pricing in. Stress-test before assuming the spread holds.
Location & tenants
- Location reads 69/100 on livability (#28 in DE) — a middle-class / working-renter tenant base. Strengths: schools A+, cost of living A+, housing A+; Watch: crime C-, amenities F, commute F.
- Christina School District (suburban): math 22% / reading 33% proficiency, ranked #18 of 26 in DE (top 69%) — low school quality limits family demand, transient renter base, plan for 1-2y turnover.
- Market conditions: 74 active listings in the ZIP; 12 comparable units currently listed for rent nearby; rentals at typical pace (median 24d on market — plan ~3-4 weeks tenant-placement turnaround); solid renter incomes; 1,367 units permitted in New Castle County in 2024 (201 in 5+ unit buildings).
- This rent runs 43% of the median local income ($76k/yr) — at the standard rent-burdened threshold; future hikes will face affordability resistance.
Forward outlook
- Local home prices are declining (-3.0%/yr); year-one equity from $2k of loan paydown is wiped out by about $9k of value loss. Plan a longer hold.
- New Castle County population projected at +9% by 2050 — modest demand growth; plan on rents tracking national, not racing it.
Negotiation context
- Only 14 days on market — expect competitive offers; lowballing is unlikely to land.
Risks & watch-outs
- Watch-outs: built in 1954 — expect roof / HVAC / electrical / plumbing capex.
- Climate carrying-cost: major wind risk, 27% chance of damaging wind over 30y; extreme-heat days projected 7→15/yr by 2055 (HVAC capex compounding) — expect insurance premiums to compound above CPI over the hold.
Questions for the listing agent
- Built in 1954 — when were the roof, HVAC, electrical panel, plumbing, and water heater last replaced?
- Is there a deadline driving the sale (1031 exchange, divorce, estate, relocation)? That informs how much negotiation room exists.
- Schools are A-rated — typically a magnet for longer-tenancy family renters. What's the average tenant stay here, and is there a school-zone premium baked into asking?
- What's the average days-on-market for RENTAL listings here right now (not sales)? A rising rental-DOM trend means longer vacancies and softer asking-rent achievability than the comps imply.
- What's the recent tenant-quality profile in this submarket — average credit score on applications, eviction rate, late-payment / NSF rate, and stable-employment percentage? A property-management company in the area should have these aggregated.
- How much new for-sale + rental construction is in the pipeline within 1–3 miles? Heavy new supply typically softens prices + rents 12–24 months out; constrained supply supports both.
Investment metrics
- 1% rule
- 0.91% ✗
- Cap rate
- 7.80%
- Cash-on-cash
- 5.37%
- DSCR
- 1.24
- GRM
- 9.1
CMA / ARV
- ARV (median comp)
- $327,810
- List price
- $299,900
- Delta
- -8.51%
- Verdict
- FAIR
- Comps
- 20 within 1.0 mi
Show comp detail 12 sales within ~0.75 mi
| Address | Dist | Beds/Ba | Sqft | Sold | Price | $/sf | Match |
|---|---|---|---|---|---|---|---|
| 62 Montrose Dr | 0.00mi | 3/1.0 | 1,528 (-3%) | 0mo | $280,000 | $183 | 95 |
| 3 Matthews Rd | 0.21mi | 4/1.0 (+1) | 1,500 (-5%) | 5mo | $340,000 | $227 | 73 |
| 67 Mercer Dr | 0.49mi | 3/1.0 | 1,525 (-3%) | 1mo | $325,000 | $213 | 71 |
| 11 Mitchell Cir | 0.25mi | 3/1.0 | 1,700 (+8%) | 6mo | $241,000 | $142 | 70 |
| 3 Durham Ct | 0.34mi | 3/2.0 | 1,525 (-3%) | 6mo | $335,000 | $220 | 69 |
| 10 Monterry Dr | 0.26mi | 3/3.0 | 1,700 (+8%) | 1mo | $235,000 | $138 | 66 |
| 884 Broadfield Dr | 0.73mi | 3/1.0 | 1,600 (+2%) | 1mo | $380,000 | $238 | 63 |
| 26 Kensington Ln | 0.63mi | 4/2.0 (+1) | 1,572 (-0%) | 3mo | $411,000 | $261 | 59 |
| 183 Brookside Blvd | 0.44mi | 3/2.0 | 1,700 (+8%) | 5mo | $380,000 | $224 | 58 |
| 378 Hobart Dr | 0.45mi | 3/1.5 | 1,450 (-8%) | 7mo | $390,000 | $269 | 58 |
| 209 Warfield Rd | 0.64mi | 3/2.0 | 1,600 (+2%) | 7mo | $405,000 | $253 | 58 |
| 511 Shue Dr | 0.61mi | 3/1.0 | 1,350 (-14%) | 4mo | $196,000 | $145 | 45 |
Match score weights: distance 35% · size 25% · config 20% · recency 20%. Top-matched comps best support the ARV.
Projected returns pro-forma
-3.0% appreciation · 3.0% rent growth · sell at horizon
- IRR
- -8.0%
- Equity multiple
- 0.70×
- Total profit
- $-24,806
- Equity at exit
- $44,716
- IRR
- 1.5%
- Equity multiple
- 1.10×
- Total profit
- $8,661
- Equity at exit
- $25,930
Cash invested: $83,972 (down + closing). Projections, not guarantees.
Landlord ↔ Tenant lean methodology
- Overall (STATE)
- 70 Landlord-Friendly
- State Delaware
- 70 Landlord-Friendly · D+7
- County
- — inherits STATE
- City
- — inherits STATE
ZIP-level market 19713
- Active inventory
- 74
- Price-to-rent
- 9.1×
Monthly cashflow live
- Estimated rent
- $2,738 high interval (Pro) →
- Mortgage (P&I)
- −$1,573
- Tax from tax record
- −$89 /mo · $1,073/yr
- Insurance
- −$125
- HOA
- −$0
- Vacancy / Maint / Mgmt
- −$575
- Net cashflow
- $376
Break-even live
UW: 25.0% down · 7.5% · 30yr · 1.5% tax · 5.0% vac · 8.0% maint · 8.0% mgmt
Financing live
Cash to close
- Down payment
- $74,975
- Closing costs
- $8,997
- Reserves months
- —
- Total cash needed
- —
Loan-product check · same deal, 3 products live
Conventional
25% down · 7.5% · 30yr
- Down + closing
- —
- Monthly P&I
- —
- Monthly cashflow
- —
- DSCR
- —
- Eligible?
- —
Personal DTI + credit; lowest rate.
DSCR
20% down · 8.5% · 30yr
- Down + closing
- —
- Monthly P&I
- —
- Monthly cashflow
- —
- DSCR
- —
- Eligible?
- —
No personal income docs; deal must DSCR.
Hard money
10% down · 12.0% · 12mo
- Down + closing
- —
- Monthly P&I
- —
- Monthly cashflow
- —
- DSCR
- —
- Eligible?
- —
Short-term bridge; refi at stabilization.
Rent comps 12 comps
| Address | Beds | Baths | Sqft | Rent | $/sqft | DOM | Units | Dist |
|---|---|---|---|---|---|---|---|---|
| 18 Montrose Dr Newark, DE | 4.0 | 3.0 | 1500 | $5,000 | $3.33 | 43d | 1 | 0.32mi |
| 28 Keith St Newark, DE | 4.0 | 1.5 | 1375 | $1,750 | $1.27 | 43d | 1 | 0.37mi |
| 5 Farnsworth Rd Newark, DE | 4.0 | 2.0 | 1700 | $2,500 | $1.47 | 24d | 1 | 0.51mi |
| 600 Judy Way Newark, DE | 3.0 | 2.5 | 2025 | $2,900 | $1.43 | 43d | 1 | 0.52mi |
| 1 Waltham St Newark, DE | 4.0 | 1.5 | 1452 | $2,250 | $1.55 | 4d | 1 | 0.53mi |
| 225 Brennen Dr Newark, DE | 3.0 | 1.0 | 1325 | $2,200 | $1.66 | 43d | 1 | 0.57mi |
| 31 N Skyward Dr Newark, DE | 3.0 | 1.5 | 1700 | $2,400 | $1.41 | 5d | 1 | 0.69mi |
| 8 Midland Dr Newark, DE | 3.0 | 2.0 | 1500 | $2,895 | $1.93 | 17d | 1 | 0.86mi |
| 1001 Compass Way Newark, DE | 1.0–2.0 | 1.0–2.0 | 1014 | $3,000 | $2.96 | 1d | 35 | 0.91mi |
| 366 Manuel St Newark, DE | 4.0 | 2.0 | 1362 | $2,300 | $1.69 | 4d | 1 | 1.35mi |
| 271 S Dillwyn Rd Newark, DE | 3.0 | 1.5 | 1325 | $2,700 | $2.04 | 5d | 1 | 1.43mi |
| 32 Bobby Dr Newark, DE | 4.0 | 2.0 | 1400 | $2,400 | $1.71 | 24d | 1 | 1.45mi |
Listing history 3 events
-
2026-05-16status Pending 1289-char remark
-
2026-05-02$299,900 Active 1289-char remark
-
1984-05-01soldstatus $46,900
ⓘ Source: listings_history table (triggers on properties + properties_extension) + one-shot
backfill from property_details.listing_events for pre-trigger history.
Tax reassessment forecast DE · Partial reset (capped growth)
- Current annual tax
- $1,073 · $89/mo
- Projected year-2 tax
- $1,406 · $117/mo
- Expected delta
- +$333/yr (+$28/mo · 31.1%)
ⓘ Screening estimate from a state-policy table — verify with the county assessor before closing.
Climate risk First Street
- Flood 4/10 Moderate FEMA zone X (unshaded) · 22% chance over 30 yrs
- Wildfire 1/10 Low
- Heat 7/10 Severe 7 d/yr ≥104°F today · 15 d/yr by 30 yrs out
- Wind 6/10 Major 27% chance of damaging wind over 30 yrs
- Air quality 3/10 Moderate 2 unhealthy d/yr today · 3 by 30 yrs out
Nearby sold comps map
Loading sold comps map…
Walkable amenities ~0.75 mi
Loading nearby amenities…
Taxation est. · year 1
- Rental income
- $32,851
- − Mortgage interest
- −$16,799
- − Property taxes
- −$1,073
- − Insurance
- −$1,500
- − Repairs & maintenance
- −$2,628
- − Management
- −$2,628
- − Depreciation
- −$8,724
- Taxable loss
- −$501
- Est. tax savings @ 24.0%
- +$120
- After-tax cash flow
- $4,628/yr
For passive investors: Depreciation is non-cash, so a rental often shows a tax loss while cash-flowing — sheltering income. Rental losses are passive: they offset passive income freely, and up to $25,000/yr can offset ordinary (W-2) income if you actively participate and your MAGI is under $100k (phasing out to $0 by $150k); unused losses carry forward. On sale, claimed depreciation is recaptured at up to 25%, and gains may owe capital-gains tax (a 1031 exchange can defer both). Figures are a year-1 estimate at your 24.0% rate — not tax advice; consult a CPA.
Schools (NCES district)
- District
- Christina School District
- NCES district ID
- 1000200
- Math proficiency
- 22% ▼ -12.00%
- Reading proficiency
- 33% ▼ -5.00%
- Median HH income
- $58,838
- Composite
- 24.93/100
- National rank
- #7567
- State rank
- #18 of 26 in DE
Livability — Brookside
- Score
- 69/100
- State rank
- #28
- US rank
- #8635
Category grades
Schools grade is shown separately in the Schools card above.
Census & demographics
- Census place
- Brookside, DE
- County
- New Castle County · 483,412 people
- City population
- 30,549
- Metro
- Philadelphia-Camden-Wilmington, PA-NJ-DE-MD
- Population (ZIP)
- 30,747
- Household income
- $76,493
- Rent vs Own
- Severe rent burden
- 926.0
Population outlook (New Castle County) Hauer SSP2
- Today (2025)
- 594,686 people
- By 2030
- 609,164 · +2.4%
- By 2040
- 632,154 · +6.3%
- By 2050
- 649,068 · +9.1%
- By 2075
- 687,771 · +15.7%
- By 2100
- 694,961 · +16.9%
Race, ethnicity, and origin ACS 2023
- Neighborhood character
- Diverse neighborhood (Simpson 0.67)
- Race & ethnicity
- White 50% Black 21% Hispanic / Latino 19% Two or more races 12% Asian 6%
- Hispanic origin (detail)
- Mexican 8% Puerto Rican 3% Dominican 2%
- Common ancestry
- Romanian 4% Slovak 1% Lithuanian 1%
- Foreign-born
- 17% · Canada, China, Jamaica
- Languages at home
- 76% English-only · Spanish 15% Chinese 2% Arabic 2%
Political lean MEDSL · New Castle
- 2024 margin
- Solid D (+32.6) · D 65.5% · R 32.9% · Other 1.6%
- 2008→2024 swing
- -8.1pp toward R · 2008: 40.6pp · 2024: 32.6pp
- All cycles
- 2024: D+32.6 2020: D+37.1 2016: D+29.6 2012: D+34.1 2008: D+40.6
Not yet ingested
- Civics
- —
Market trends
- HPI YoY
- ▼ -255.28%
- Current HPI
- 269.969
- Rent YoY
- —
- Metro
- Philadelphia-Camden-Wilmington, PA-NJ-DE-MD
- State GDP YoY
- —
- F500 in state
- 0
Price history
+497.0% since first listed4 events — show timeline
- 2026-06-09 Sold (MLS) $280,000 BRIGHT MLS
- 2026-05-16 Pending — BRIGHT MLS
- 2026-05-02 Listed $299,900 BRIGHT MLS
- 1984-05-01 Sold (Public Records) $46,900 Public Records
Property tax history
-1.0%/yrLatest (2024): $1,073 · +3.8% YoY. Source: county tax records.
Cash-flow waterfall
monthlySold comps — $/sqft
last 12 mo · ≤1 miLoading sold comps…